The correct graph which shows the variation of paramagnetic susceptibility S with temperature T is
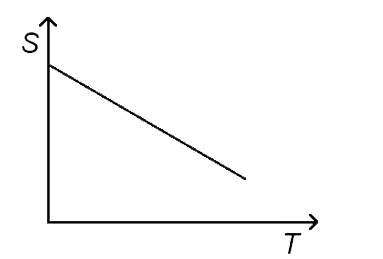
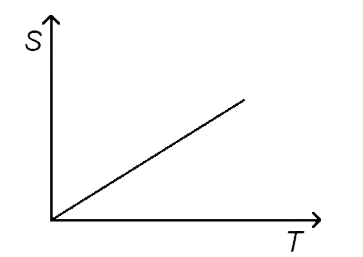
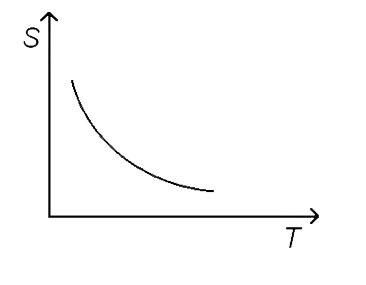
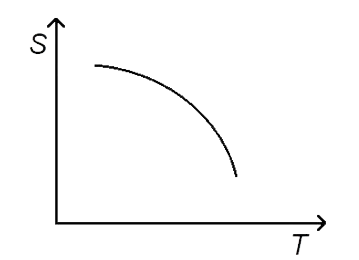
The correct Answer is:C
To solve the problem of determining the correct graph that shows the variation of paramagnetic susceptibility S with temperature T, we can follow these steps:
1. Understand the Relationship: According to the Curie law, the paramagnetic susceptibility S is inversely proportional to the temperature T. This can be mathematically expressed as:
S∝1T
2. Express the Relationship Mathematically: We can write the relationship as:
S=CT
where C is the Curie constant.
3. Identify the Type of Graph: The equation S=CT can be rearranged to show that as T increases, S decreases. This indicates a hyperbolic relationship.
4. Graph Characteristics: The graph of S versus T will show a downward curve, starting from a higher value of S when T is low and approaching zero as T increases.
5. Select the Correct Option: Among the given options, we need to identify the graph that depicts this inverse relationship. The correct graph will show a hyperbolic decline of S with increasing T.
6. Conclusion: After analyzing the options, we find that the graph corresponding to the equation S=CT is the one that correctly represents the variation of paramagnetic susceptibility with temperature.
Final Answer:
The correct graph showing the variation of paramagnetic susceptibility S with temperature T is Option 3.
S∝1T
S=CT
where C is the Curie constant.
The correct graph showing the variation of paramagnetic susceptibility S with temperature T is Option 3.
Topper's Solved these Questions
Similar Questions
Knowledge Check
Which one is the correct graph which gives the variation of magnetic susceptibility (x) with tempperature for a diamagnetic substacne?
A B
B C
C D
D
The graph which represents the variation of mean kinetic energy of moleules with temperature ∘C is ?
A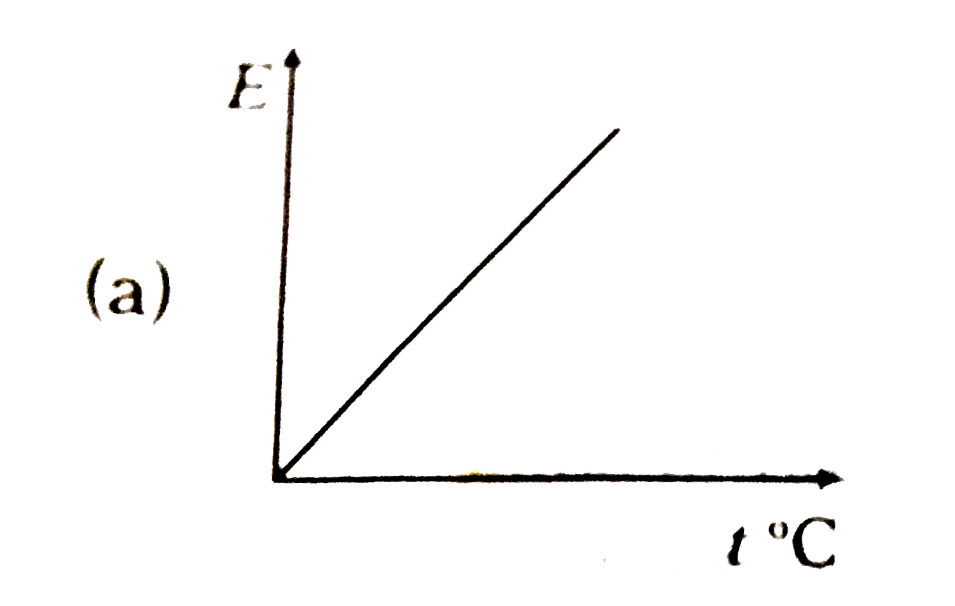 B
B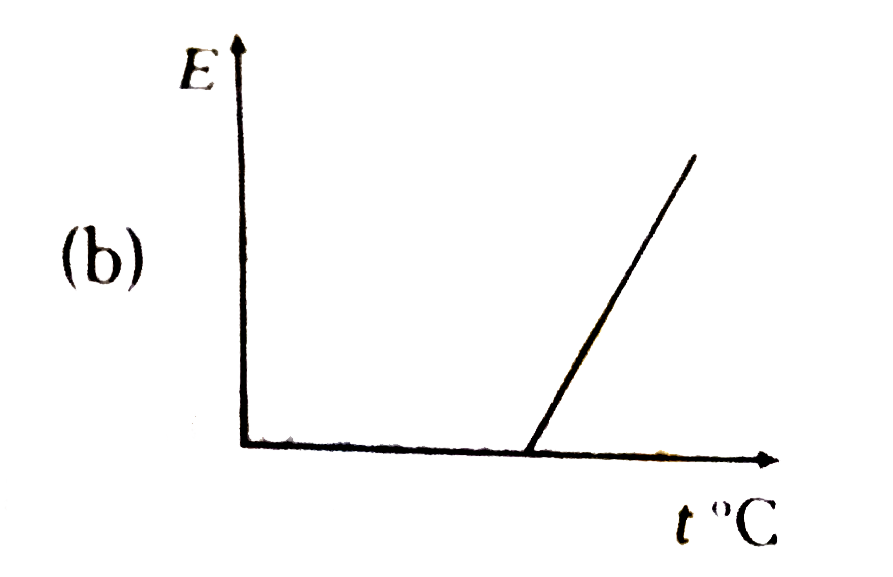 C
C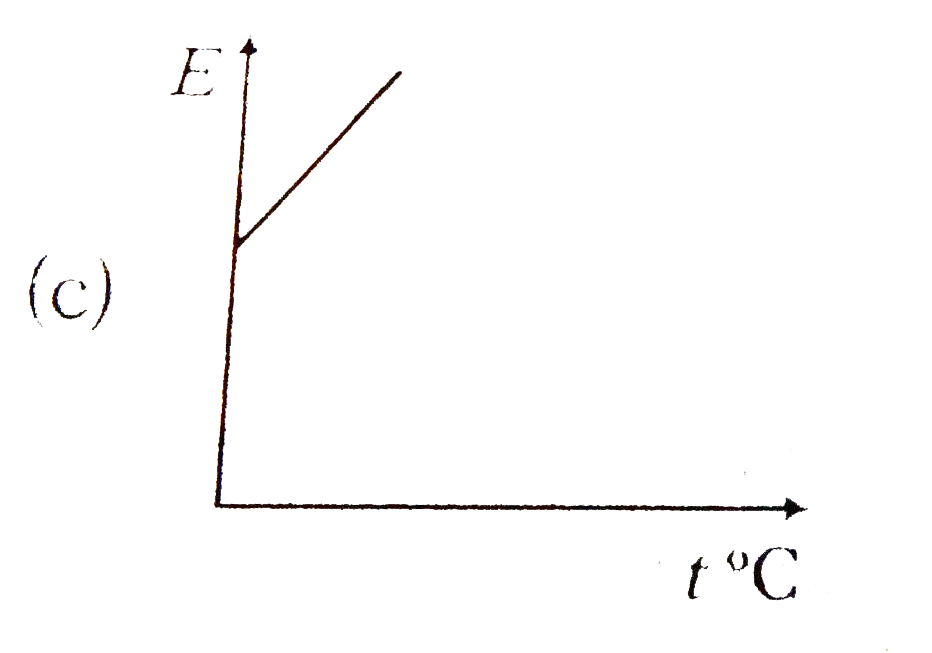 D
D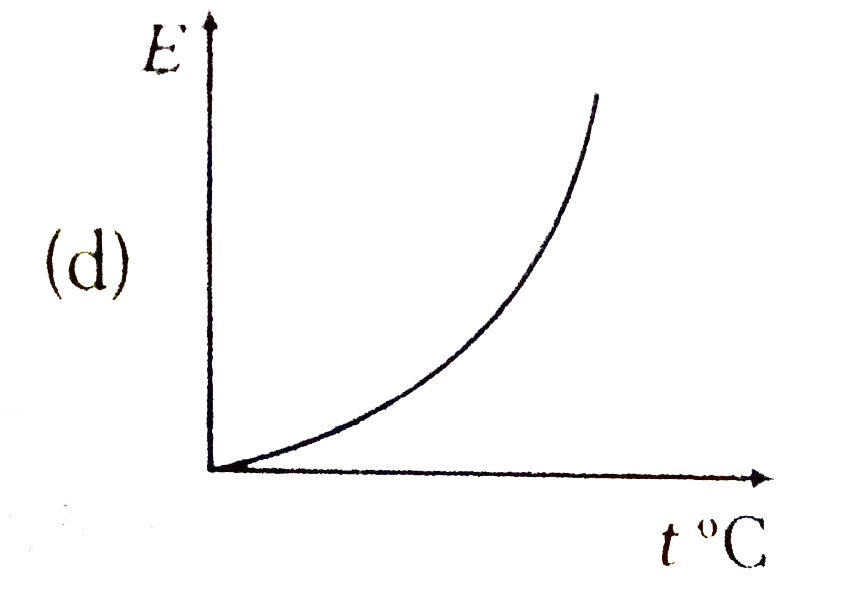
The variation of magnetic susceptibility (x) with temperature (T) for a diamagnetic material is best represented by
A B
B C
C D
D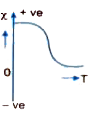
The variation of magnetic susceptibility (χ) with absolute temperature T for a ferromagnetic material is
View Solutionwhich of the following graph represents the variation of resistivity (ρ) with temperature (T) for copper?
View SolutionThe variation of magnetic susceptibility (χ) with temperature for a diamagnetic substance is best represented by
View SolutionThe variation of magnetic susceptibility (χ) with temperature for a diamagnetic substance is best represented by
View SolutionThe variation of magnetic susceptibility (χ) with temperature for dimagnetic substance is represented by
View Solution
