The graphs given below depict the dependence of two reactive impedences X1 and X2 on the frequency of the alternating e.m.f. applied individually to them. We can then say that
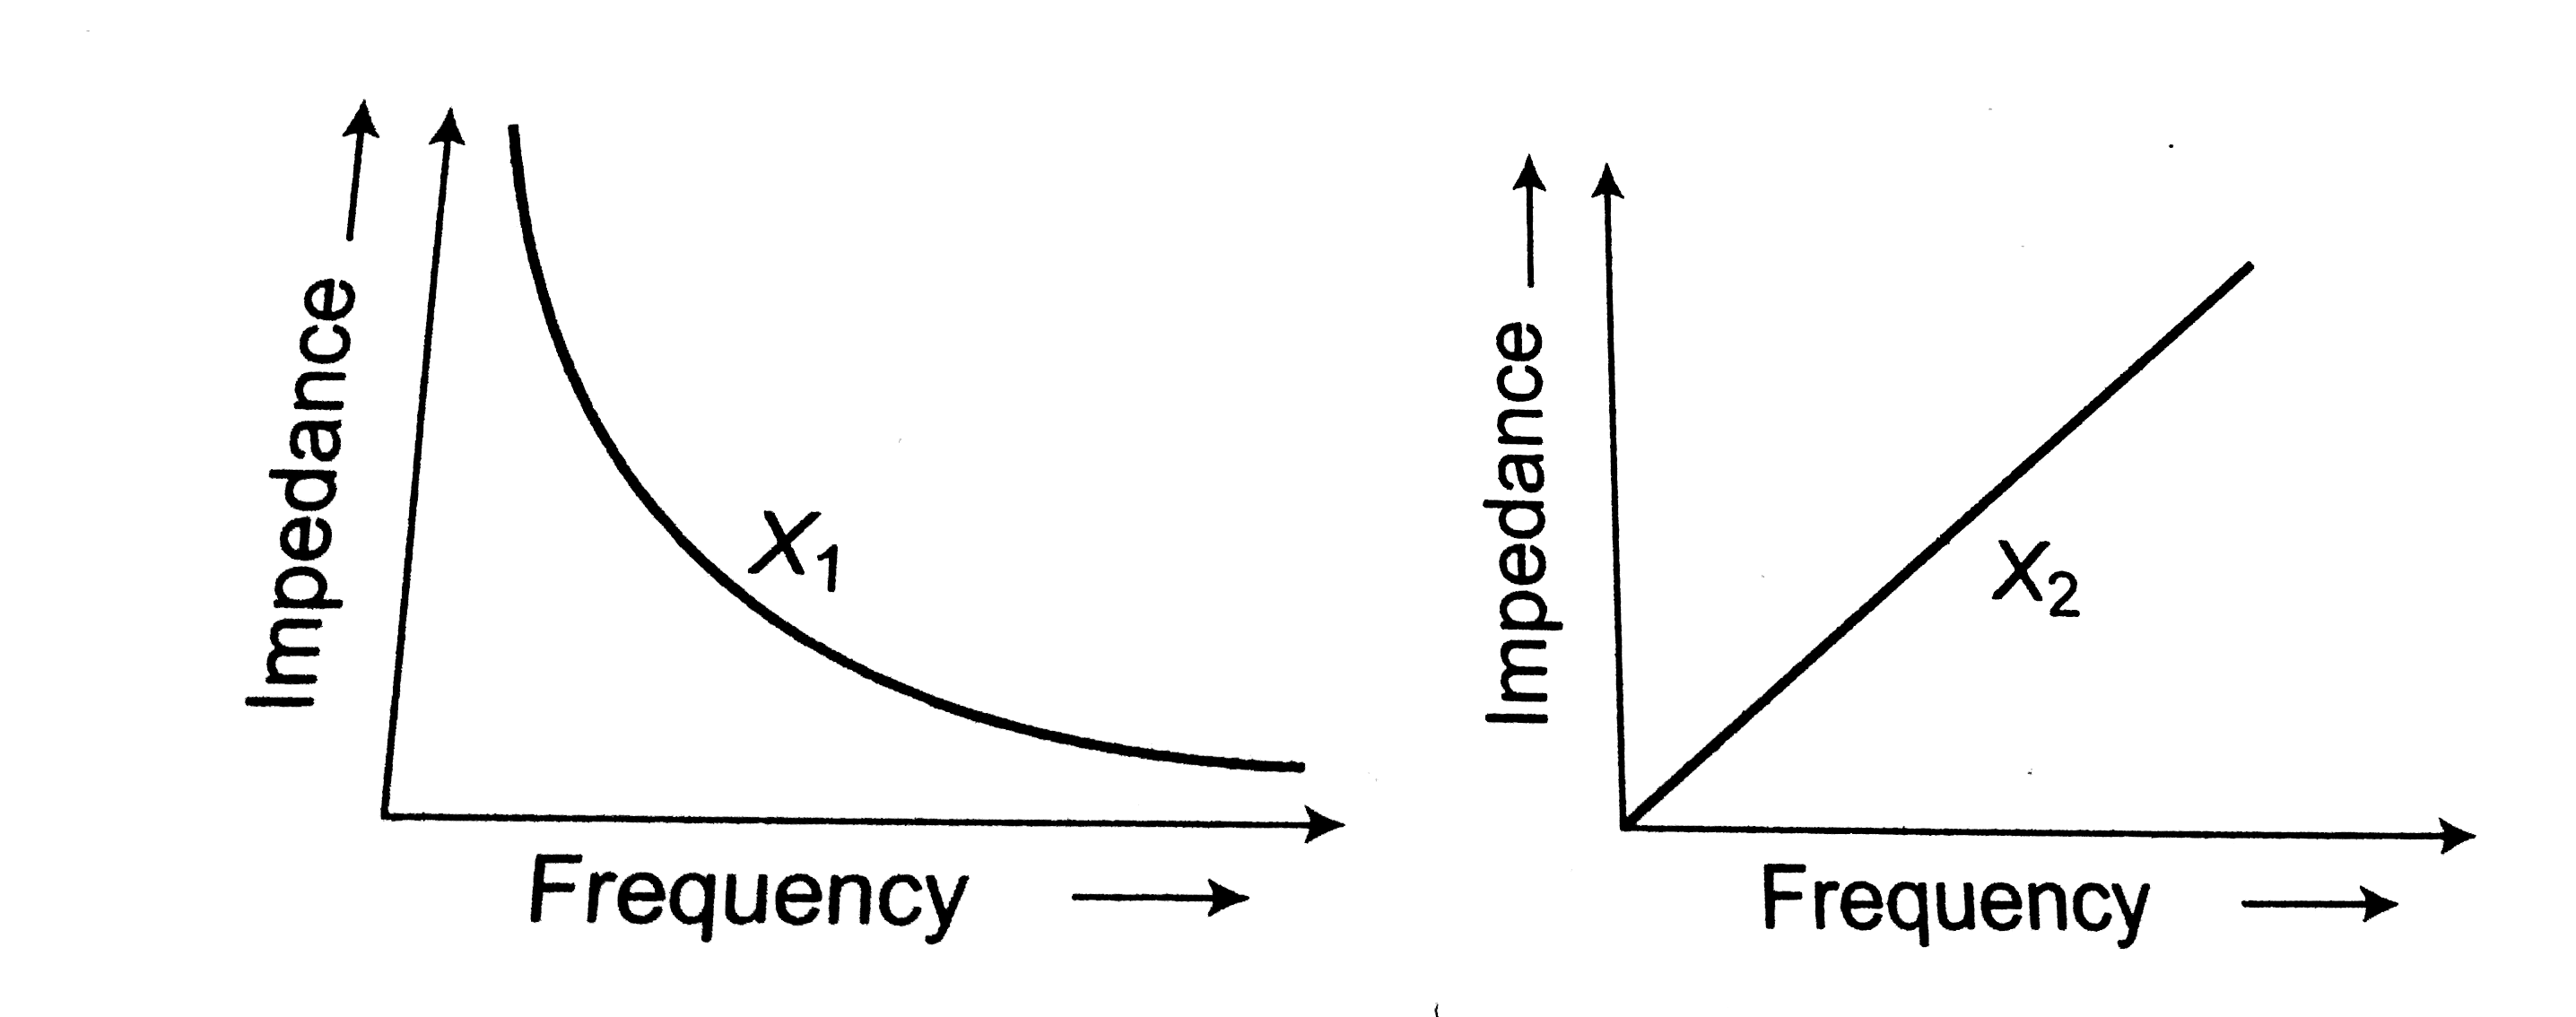
X1 is an inductor and X2 is a capacitor
X1 is a resistor and X2 is a capacitor
X1 is a capacitor and X2 is an inductor
X1 is an inductor and X2 is a resistor
The correct Answer is:c
Step by step video, text & image solution for The graphs given below depict the dependence of two reactive impedences X_(1) and X_(2) on the frequency of the alternating e.m.f. applied individually to them. We can then say that by Physics experts to help you in doubts & scoring excellent marks in Class 12 exams.
Updated on:21/07/2023Topper's Solved these Questions
Similar Questions
Knowledge Check
Figure (i) and (i) show the displacement-time graphs of two particles moving along the x-axis. We can say that
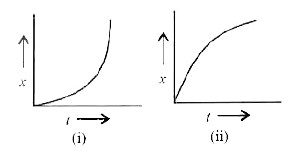 Aboth the particles are having a uniformly retarded motionBboth the particles are having a uniformly acceleraled motionCParticle (1) is having a uniformly accelerated motion while particle (i) is having a uniformly retarded motionDParticle (i) is having a uniformly retarded motion while particle (ii) is having a uniformly accelerated motion
Figures (i) and (ii) below show the displacement-time graphs of two particles moving along the x -axis. We can say that
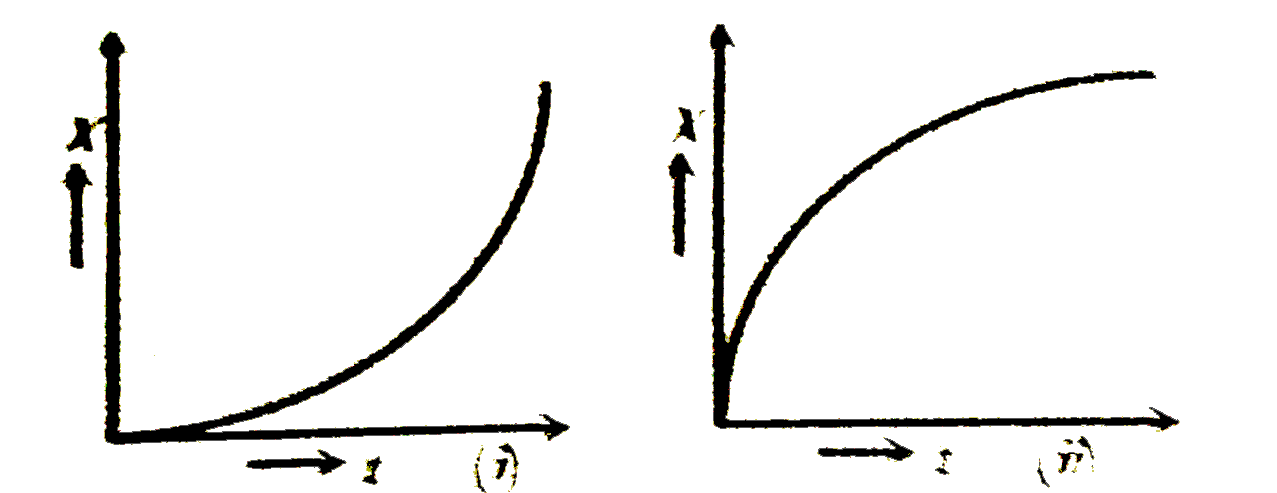 ABoth the particles are having a uniformly accelerated motionBBoth the particles are having a uniformly retarded motionCParticle (i) is having a uniformly accelerated motion while particle (ii) is having a uniformly retarded motionDParticle (i) is having a uniformly retarded motion while particle (ii) is having a uniformly accelerated motion
The graph of y=f(x) is given below
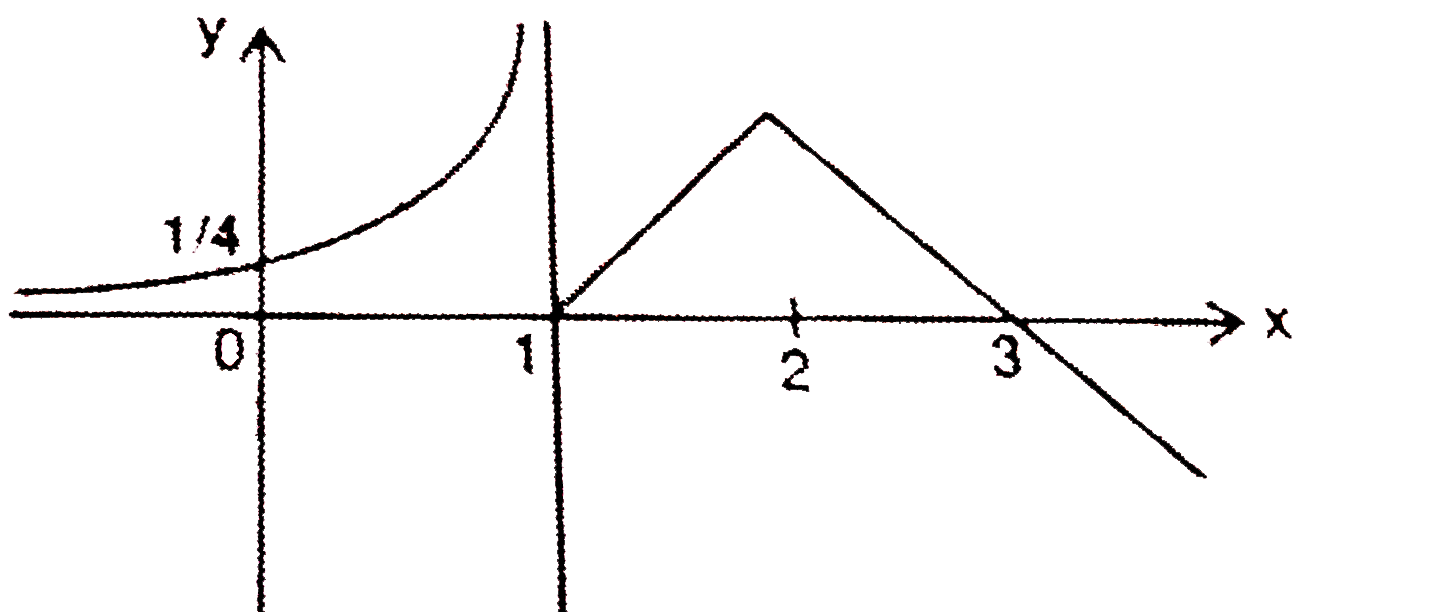
then the graph y=|f(|x|)| is :A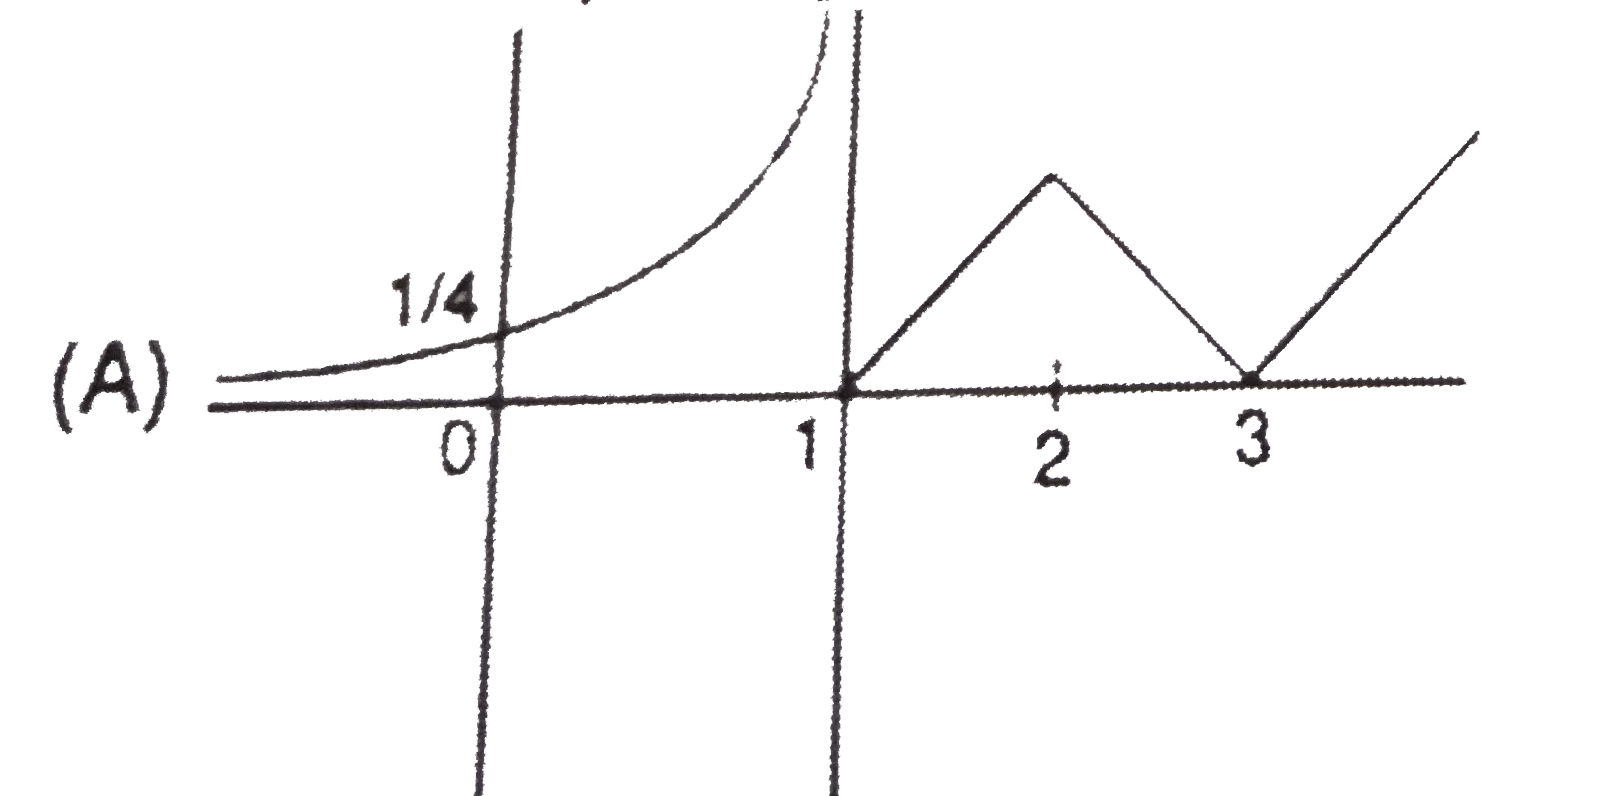 B
B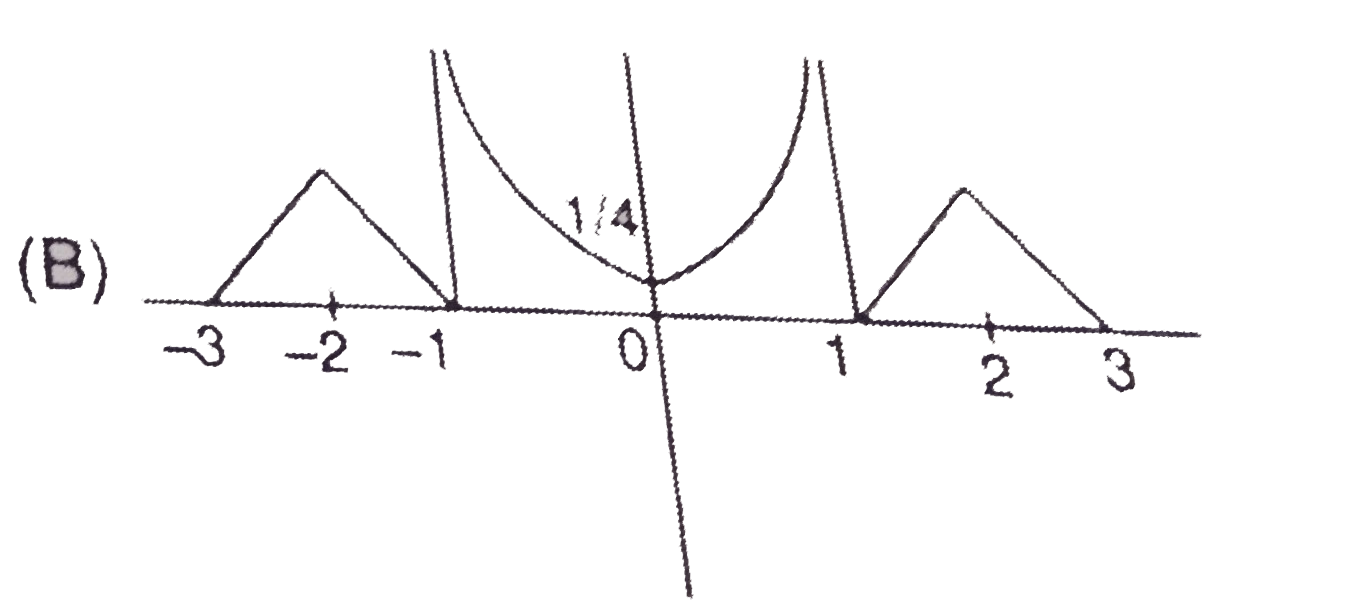 C
C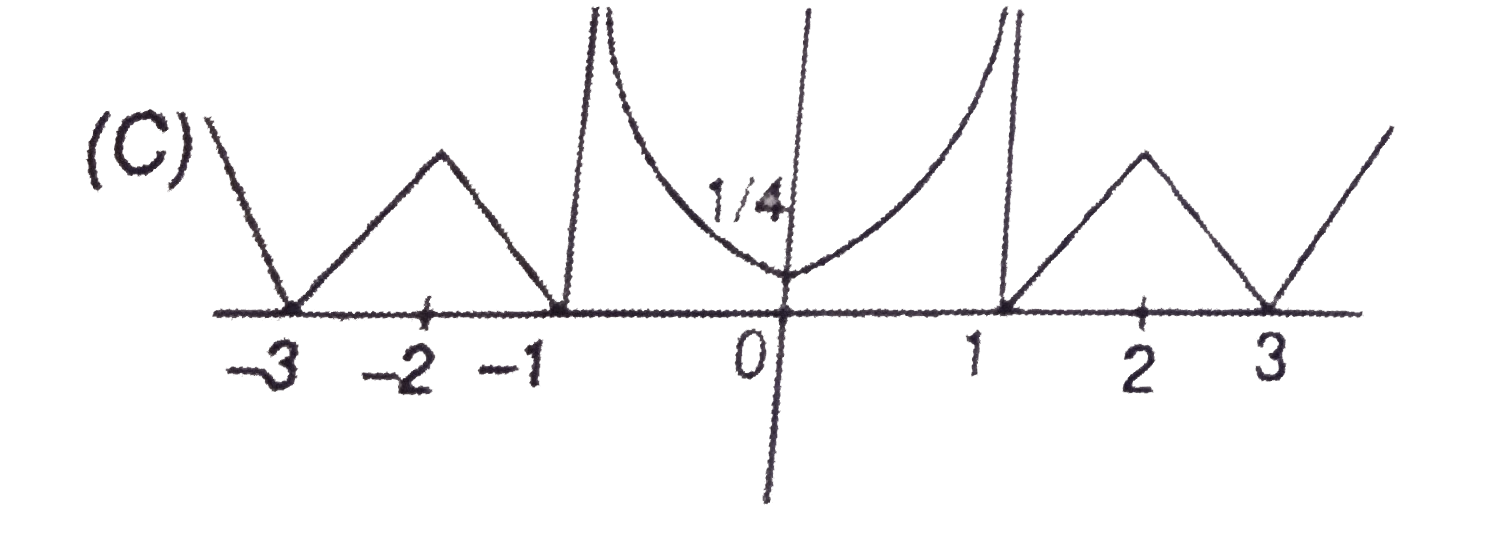 Dnone of these
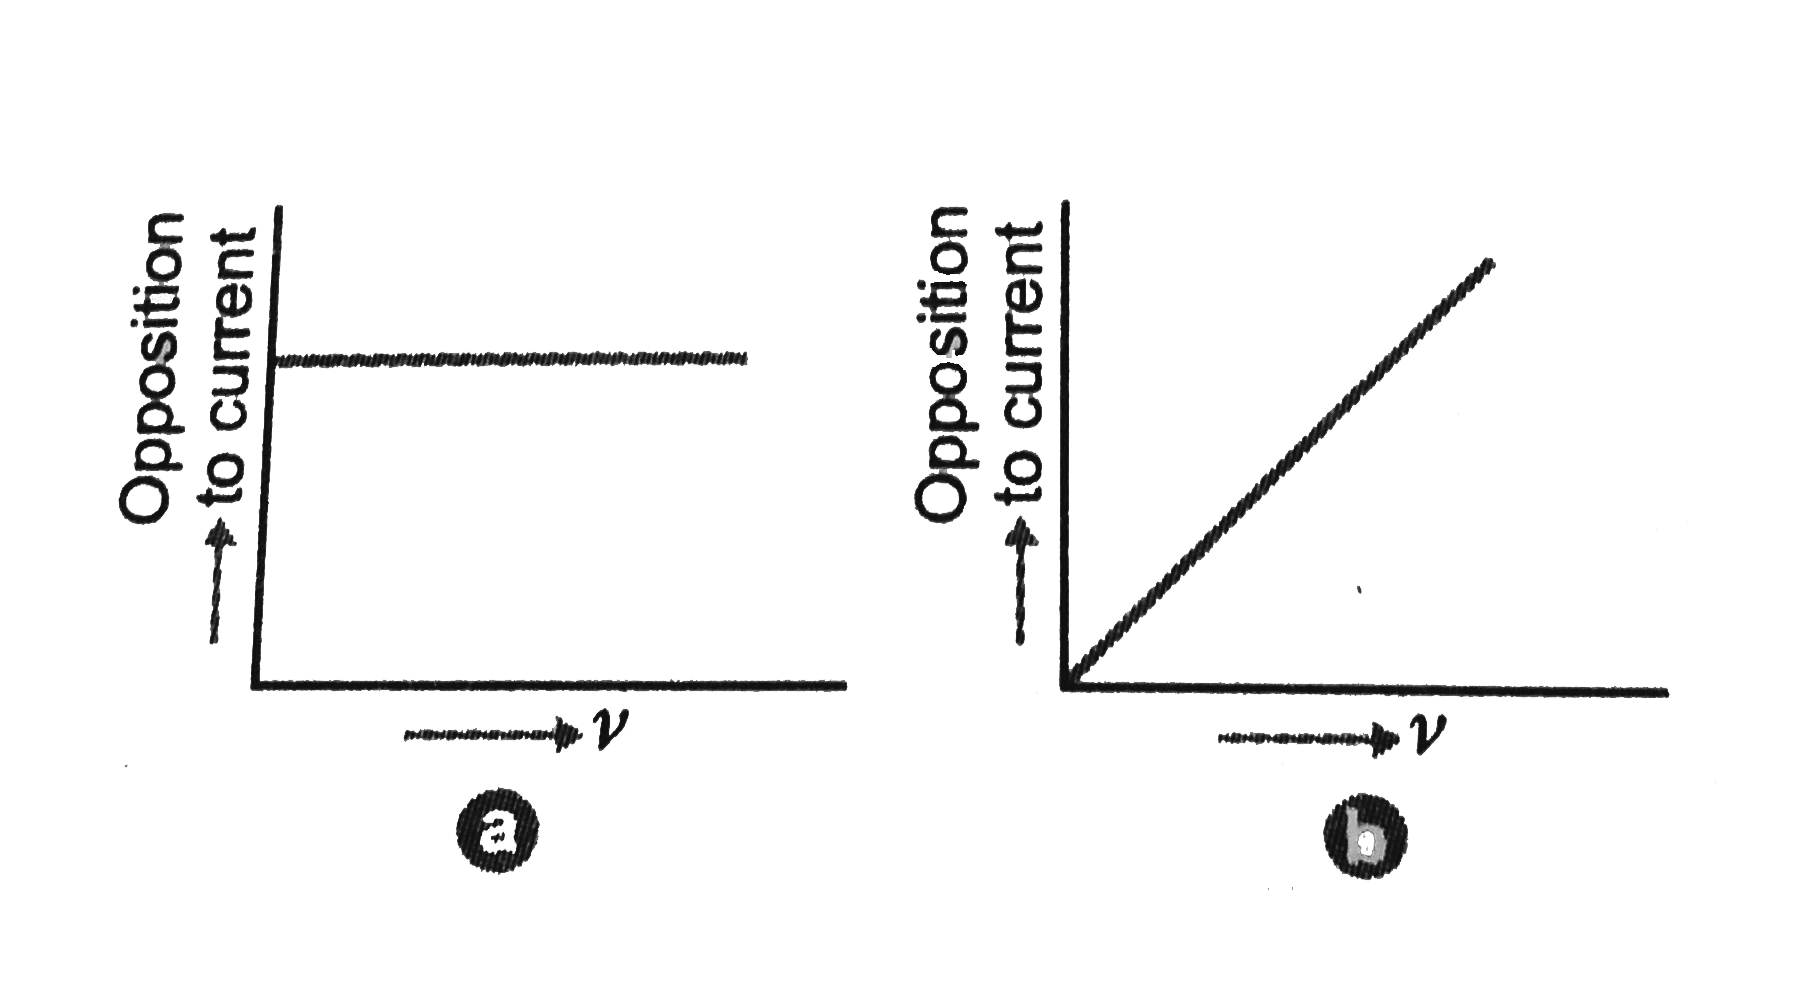
The graphs shown in Fig. represent the variation of opposition offered by the circuit element of the flow of a.c. with frequency of applied e.m.f. Iddntify the circuit element .
View Solution. Graph of y=f(x) is given,below then graph of 1f(x) is represented by
View SolutionIn a series LCR circuit, impedance Z is same at two frequencies f1 and f2. Therefore, the resonant frequency of this circuit is
View SolutionIf the frequency of alternating e.m.f. is in L−C−R circuit, then the value of impedance Z will change with log (frequency) as
View SolutionStudents A and B connect the two resistors R1 and R2 given to them in the manners shown below :

and then insert them at X and Y into the measuring circuit shown below :
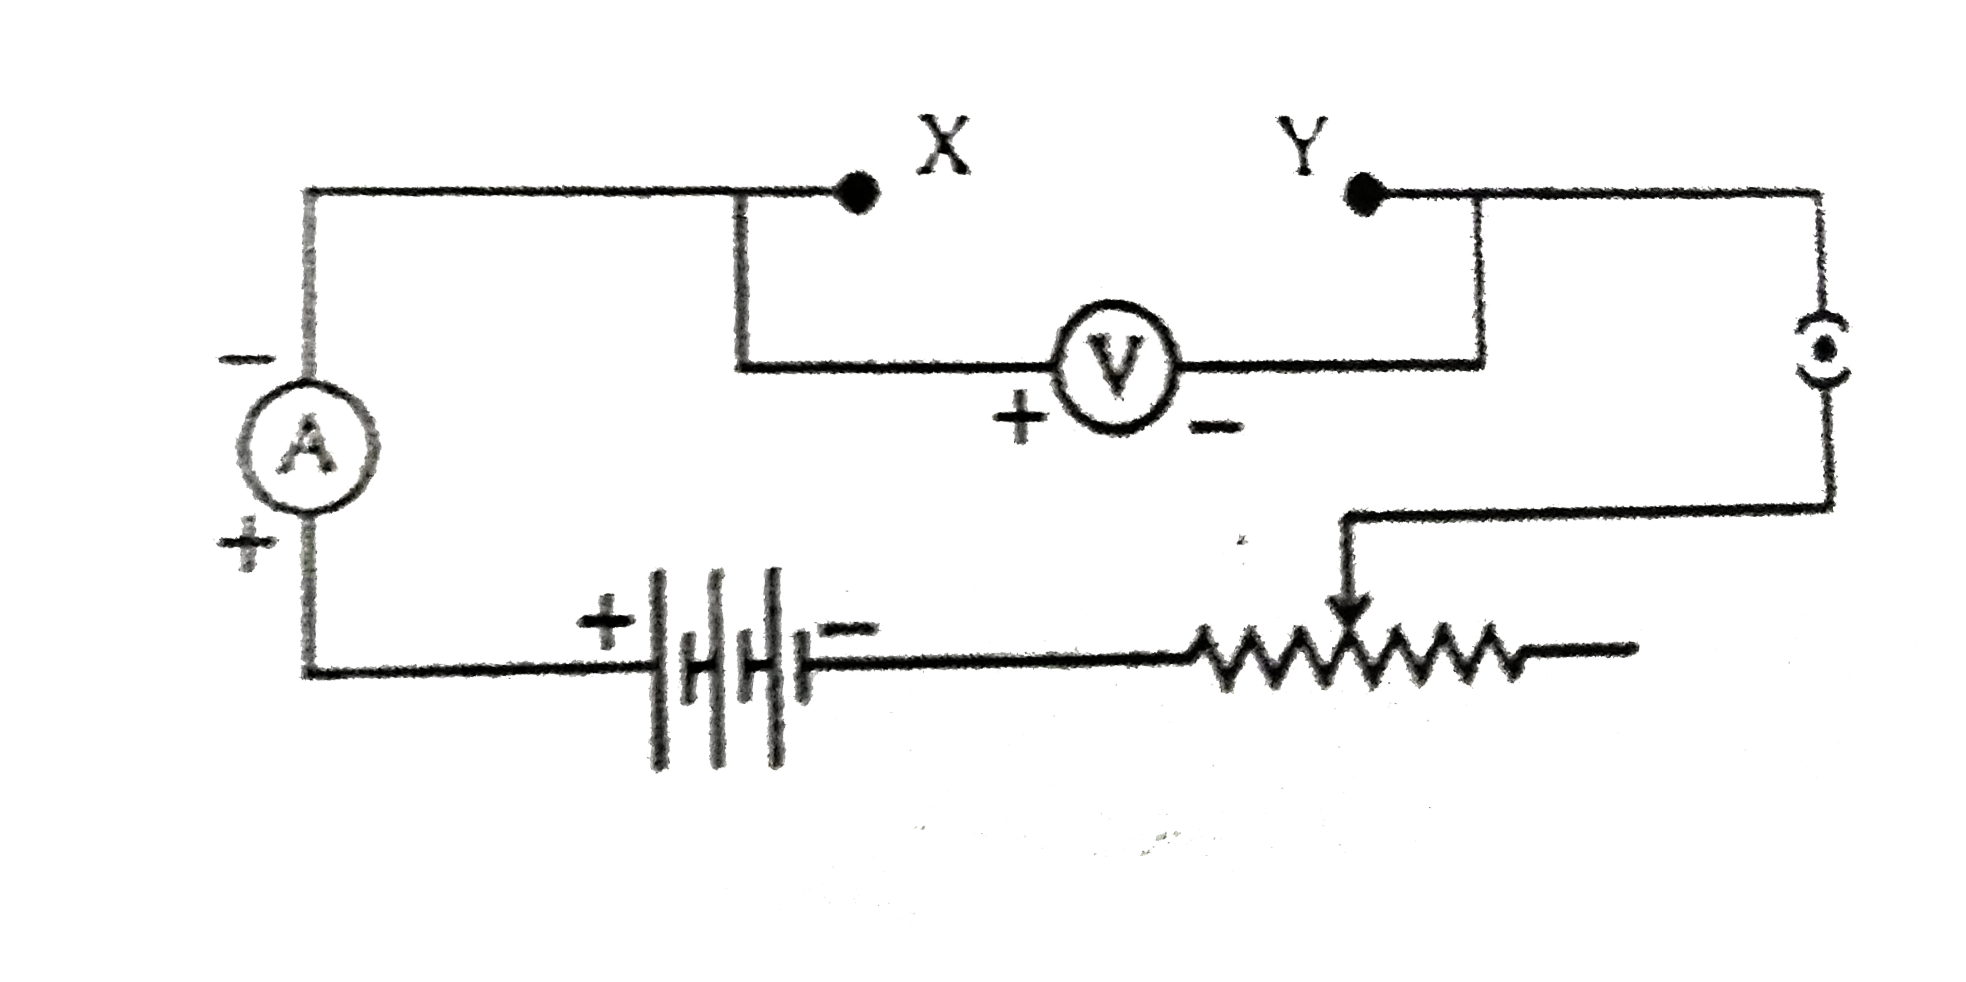
We can then say that
View Solution

