The heating curve of a paritcular substance in solid state is as shown in the figure .choose the correct alternative
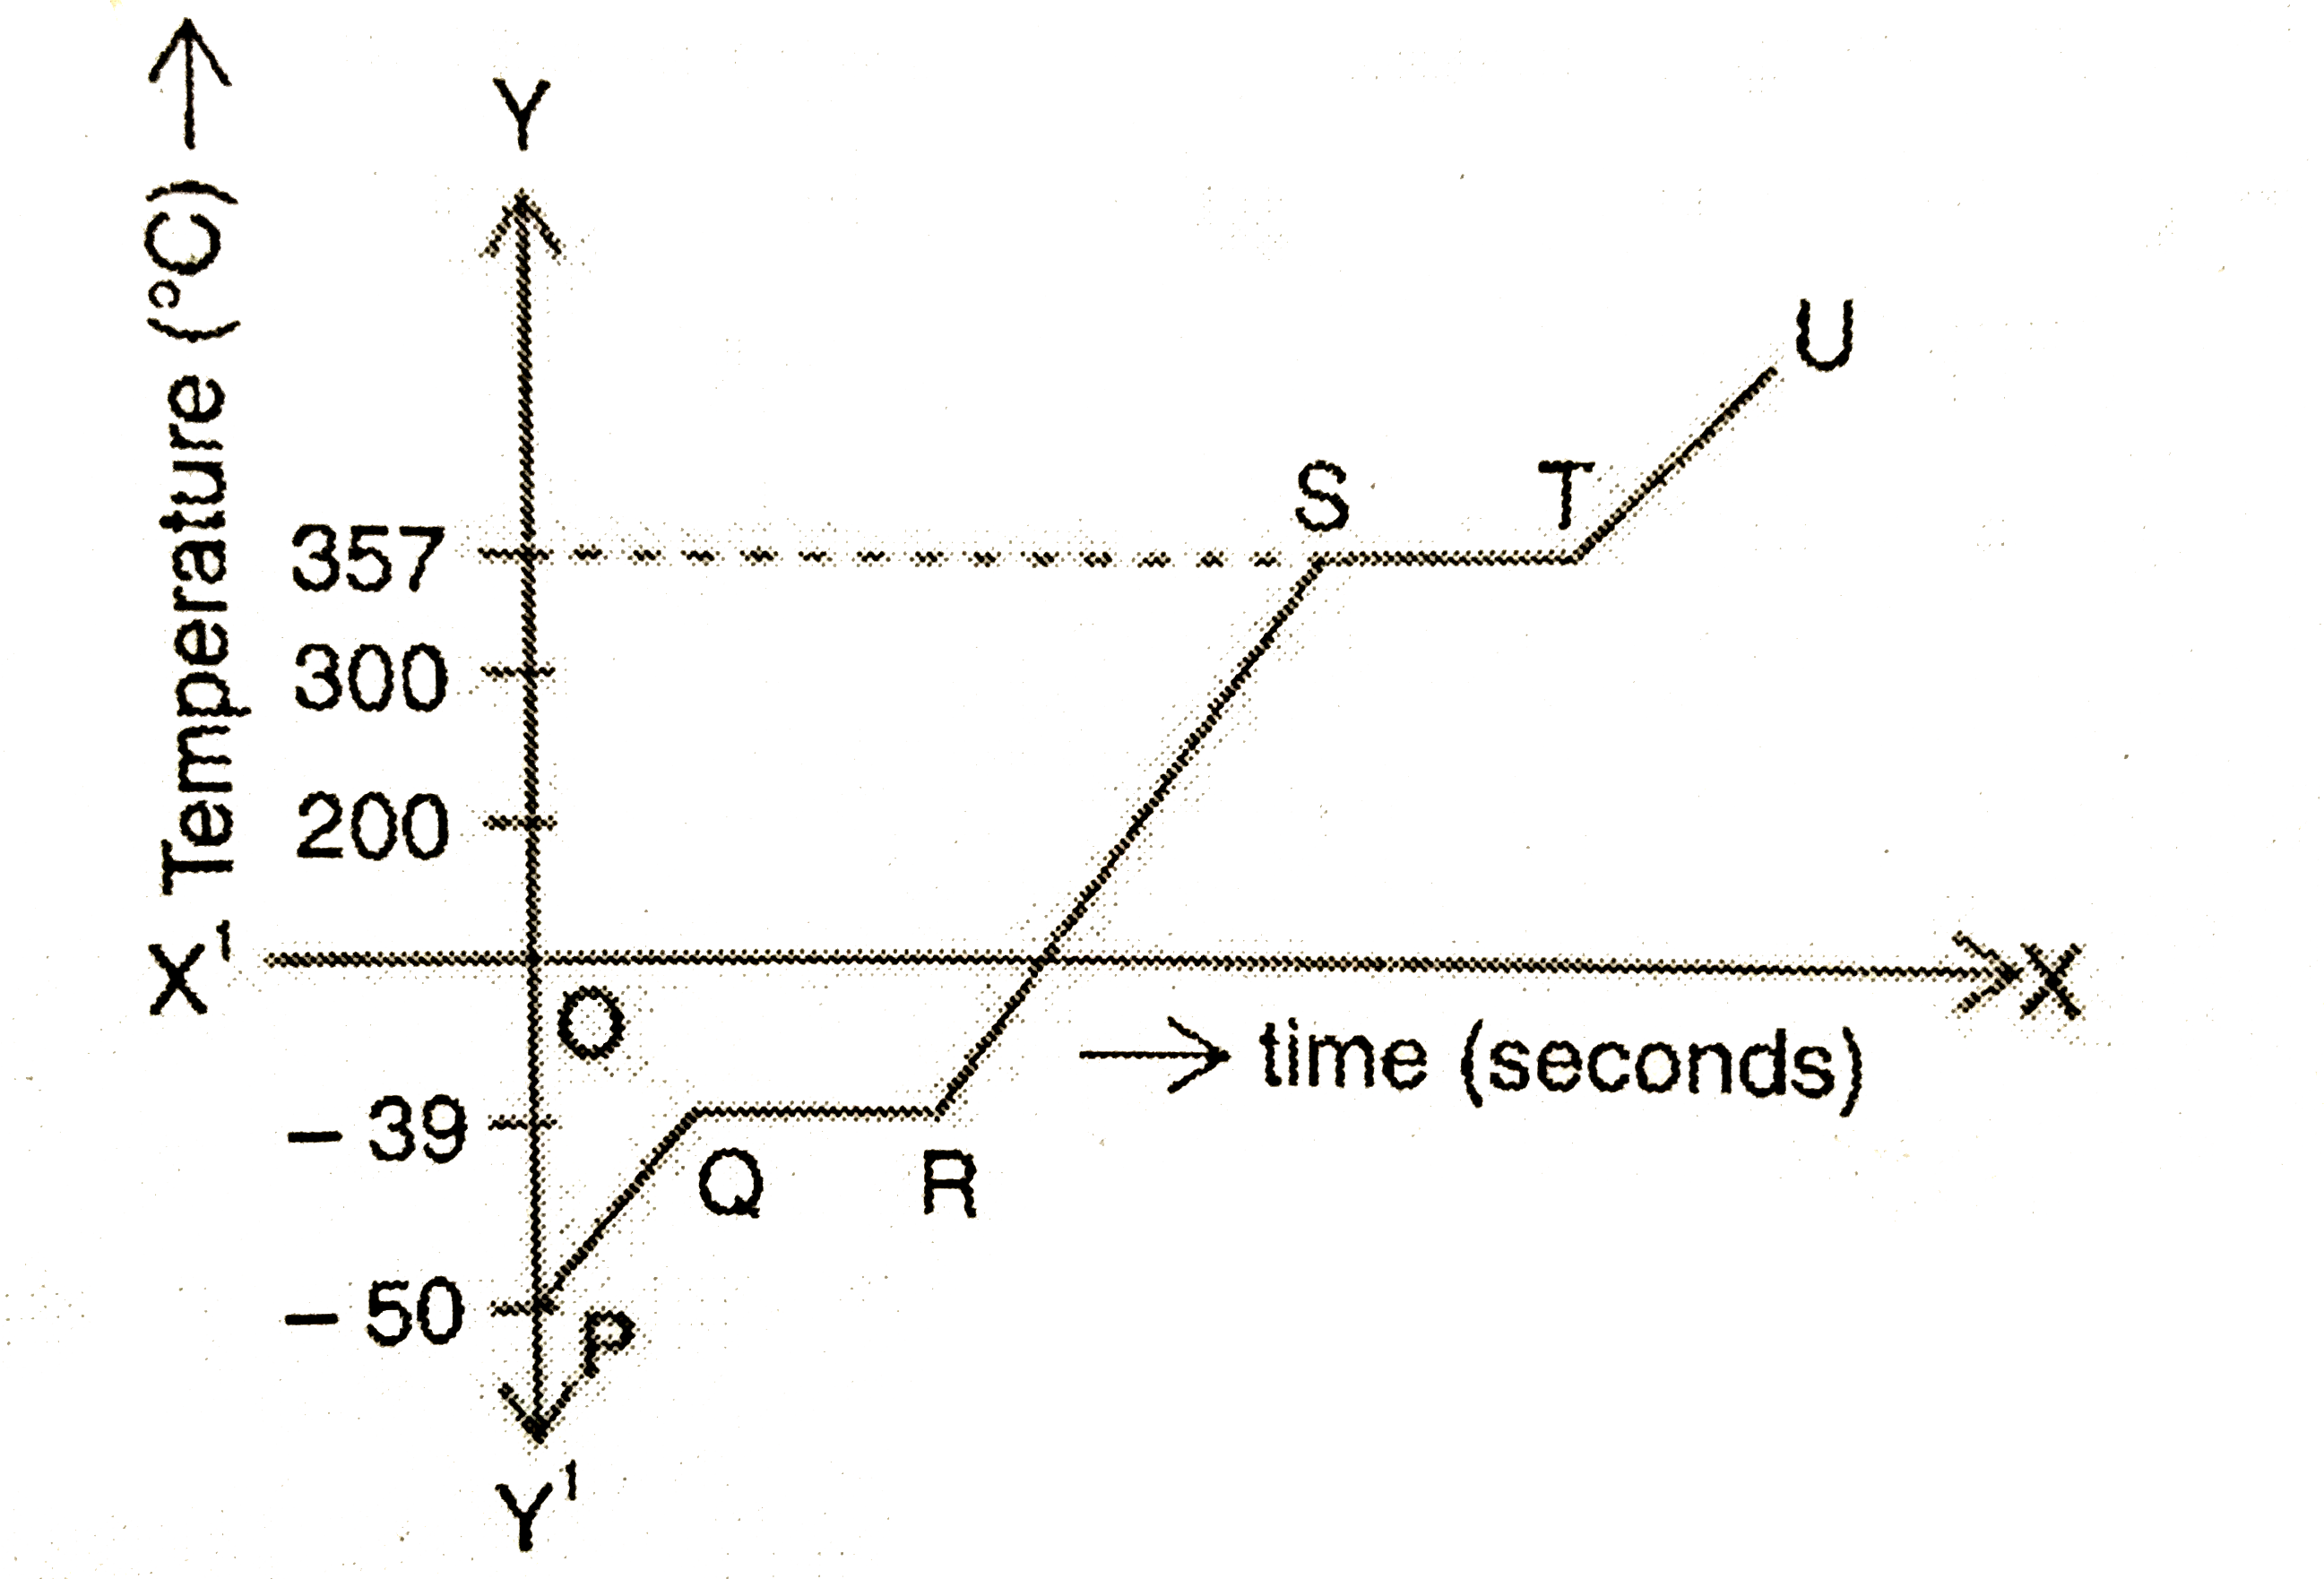
The porition QR of the graph indicates
no change in heat energy.
change in temperature.
change of state.
Both (b) and (c)
The correct Answer is:C
The portion QR of the graph indicates change of state
Similar Questions
The heating curve of a particular substance in solid state is as shown in the figure: Choose the correct alternative.
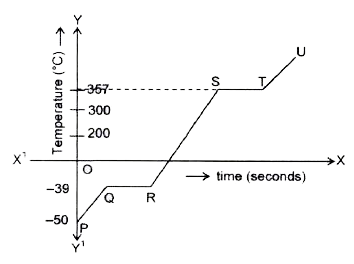
RS part of the graph indicates ___ state of substance.
View SolutionThe heating curve of a particular substance in solid state is as shown in the figure .choose the correct alternative
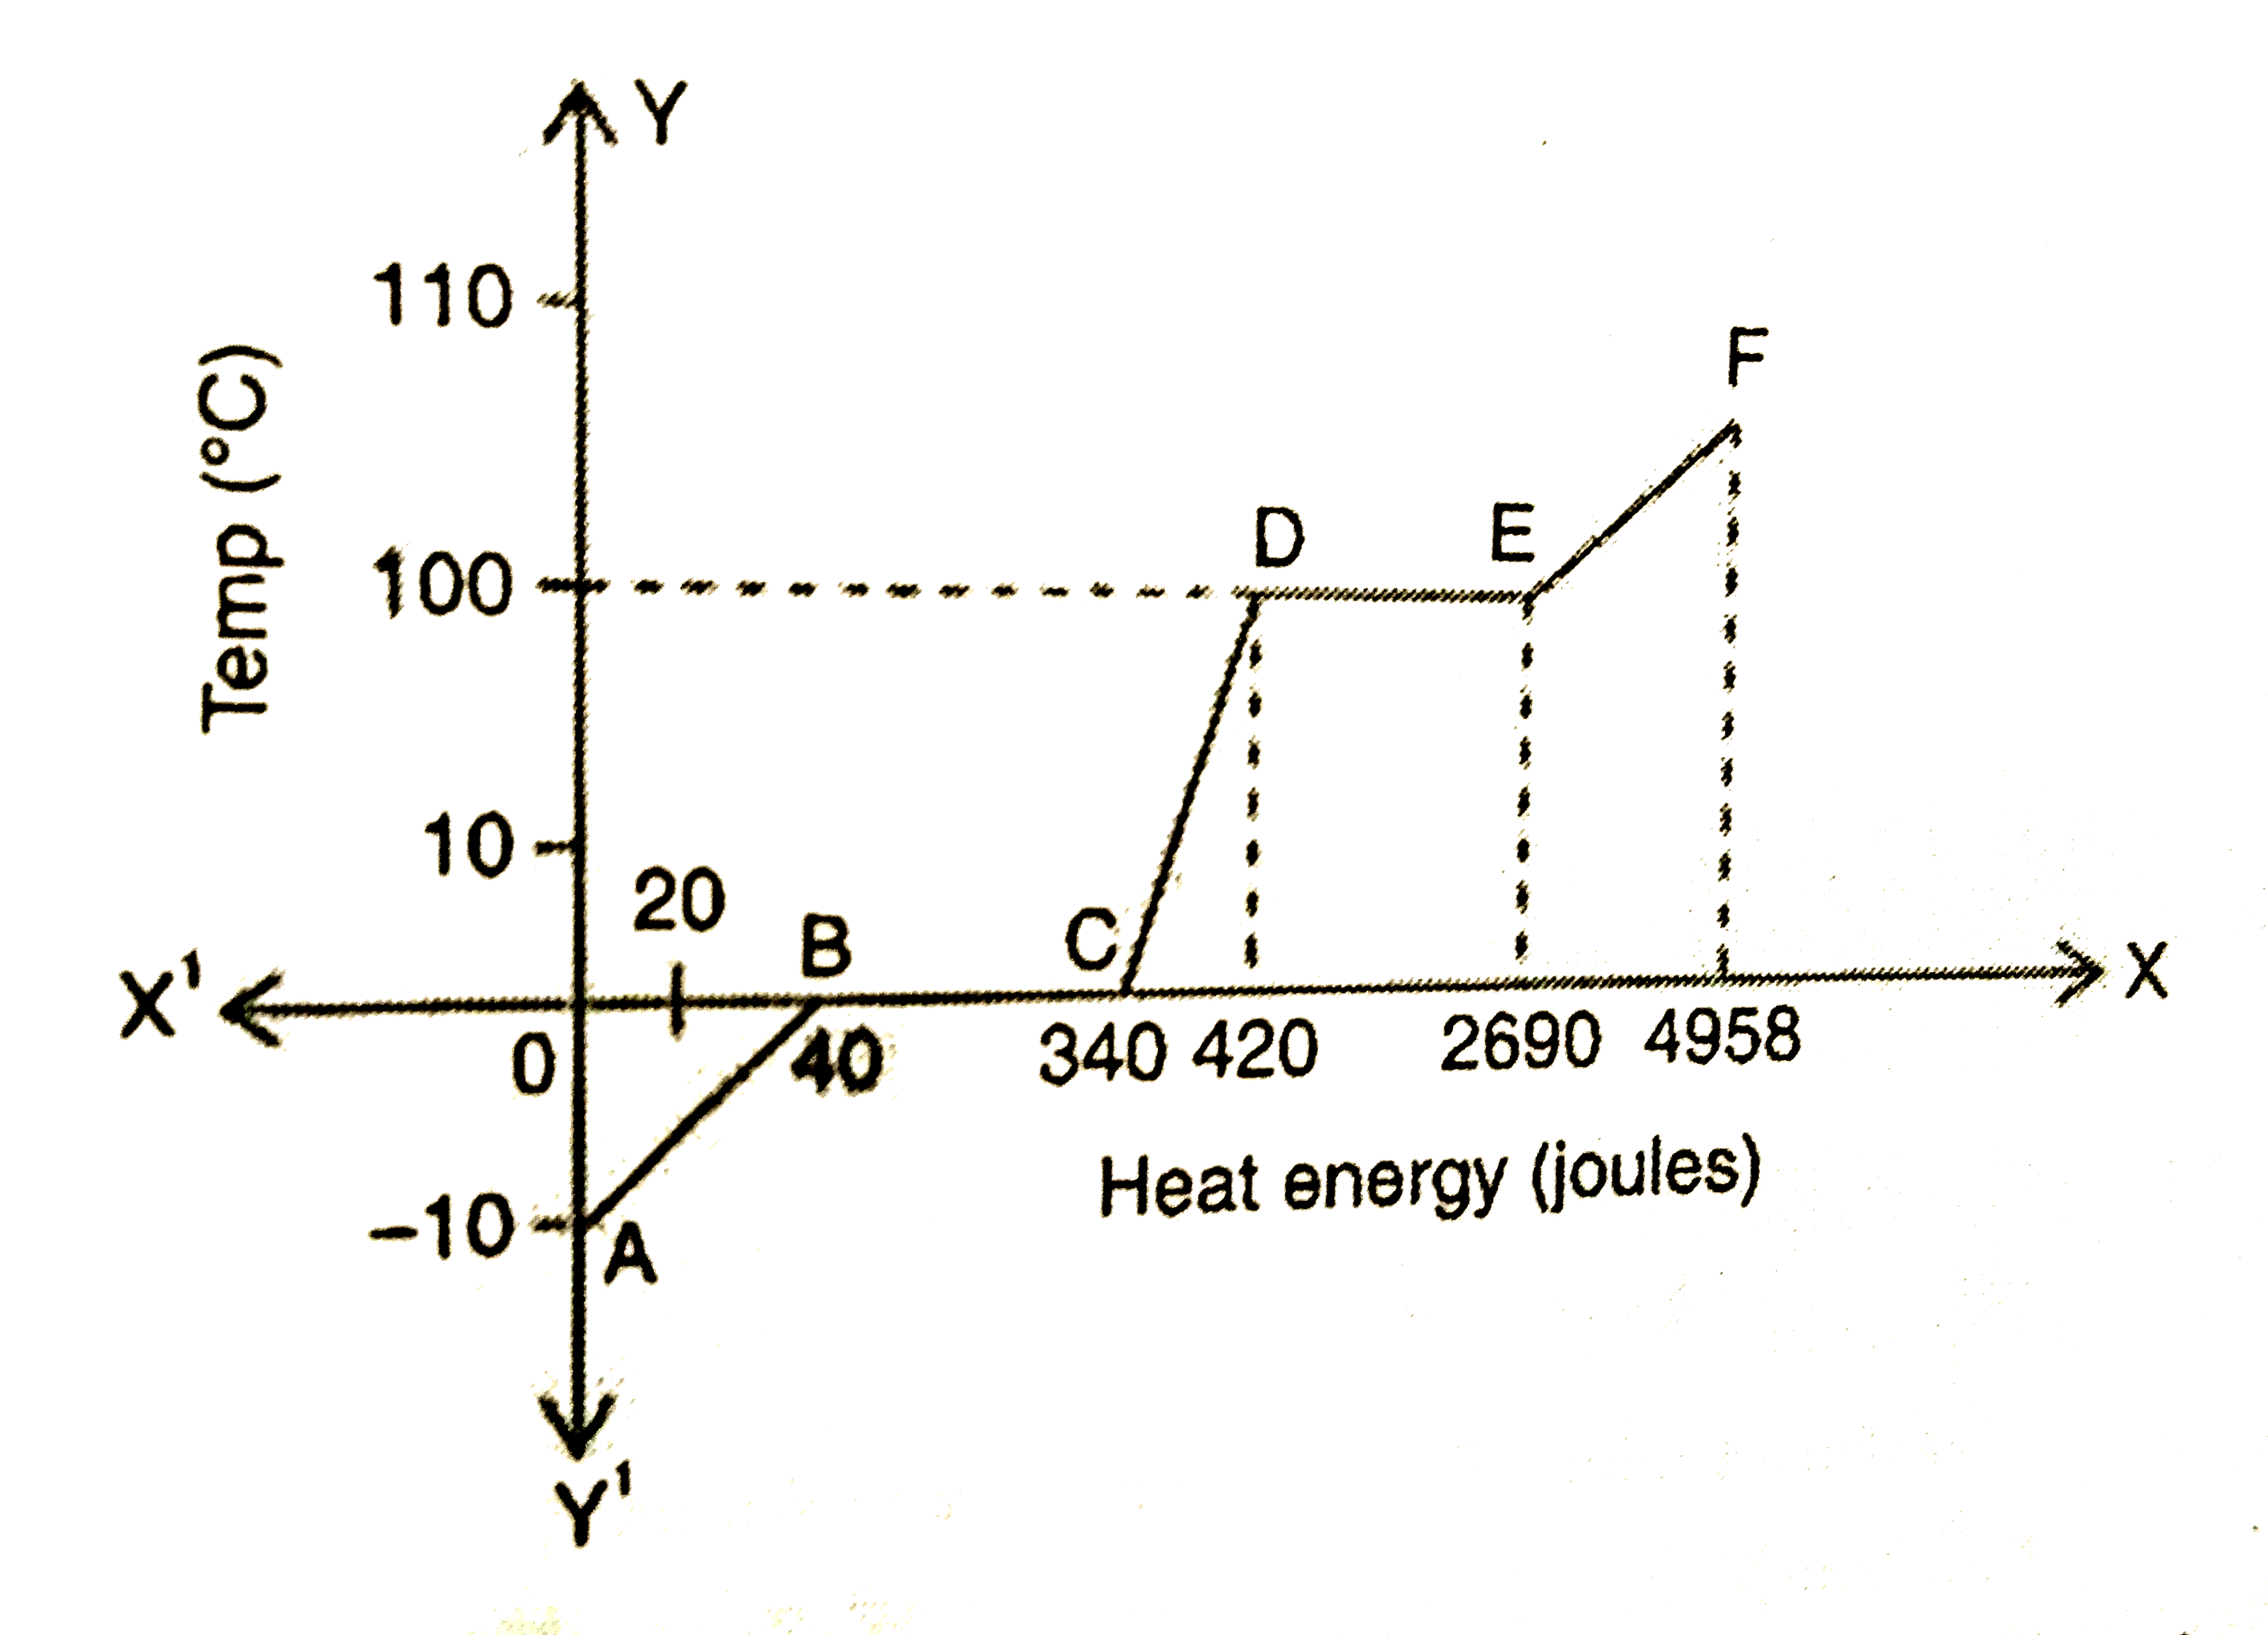
The change of state in the graph is represented by ________part.
View Solution
Knowledge Check
The heating curve of a paritcular substance in solid state is as shown in the figure .choose the correct alternative

The porition QR of the graph indicatesAno change in heat energy.Bchange in temperature.Cchange of state.DBoth (b) and (c).The heating curve of a paritcular substance in solid state is as shown in the figure .choose the correct alternative

The porition QR of the graph indicatesAno change in heat energy.Bchange in temperature.Cchange of state.DBoth (b) and (c)The heating curve of a particular substance in solid state is as shown in the figure: Choose the correct alternative.
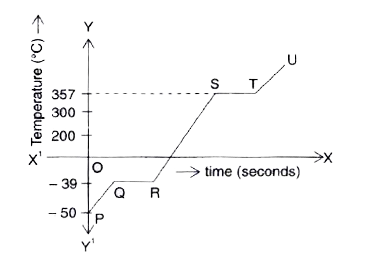
The portion RS of the graph indicates _____ state of substance.AsolidBliquidCgaseousDCannot be determined
The heating cuve of particular substance in solid state is as shown in the figure : Choose the correct aternativ e
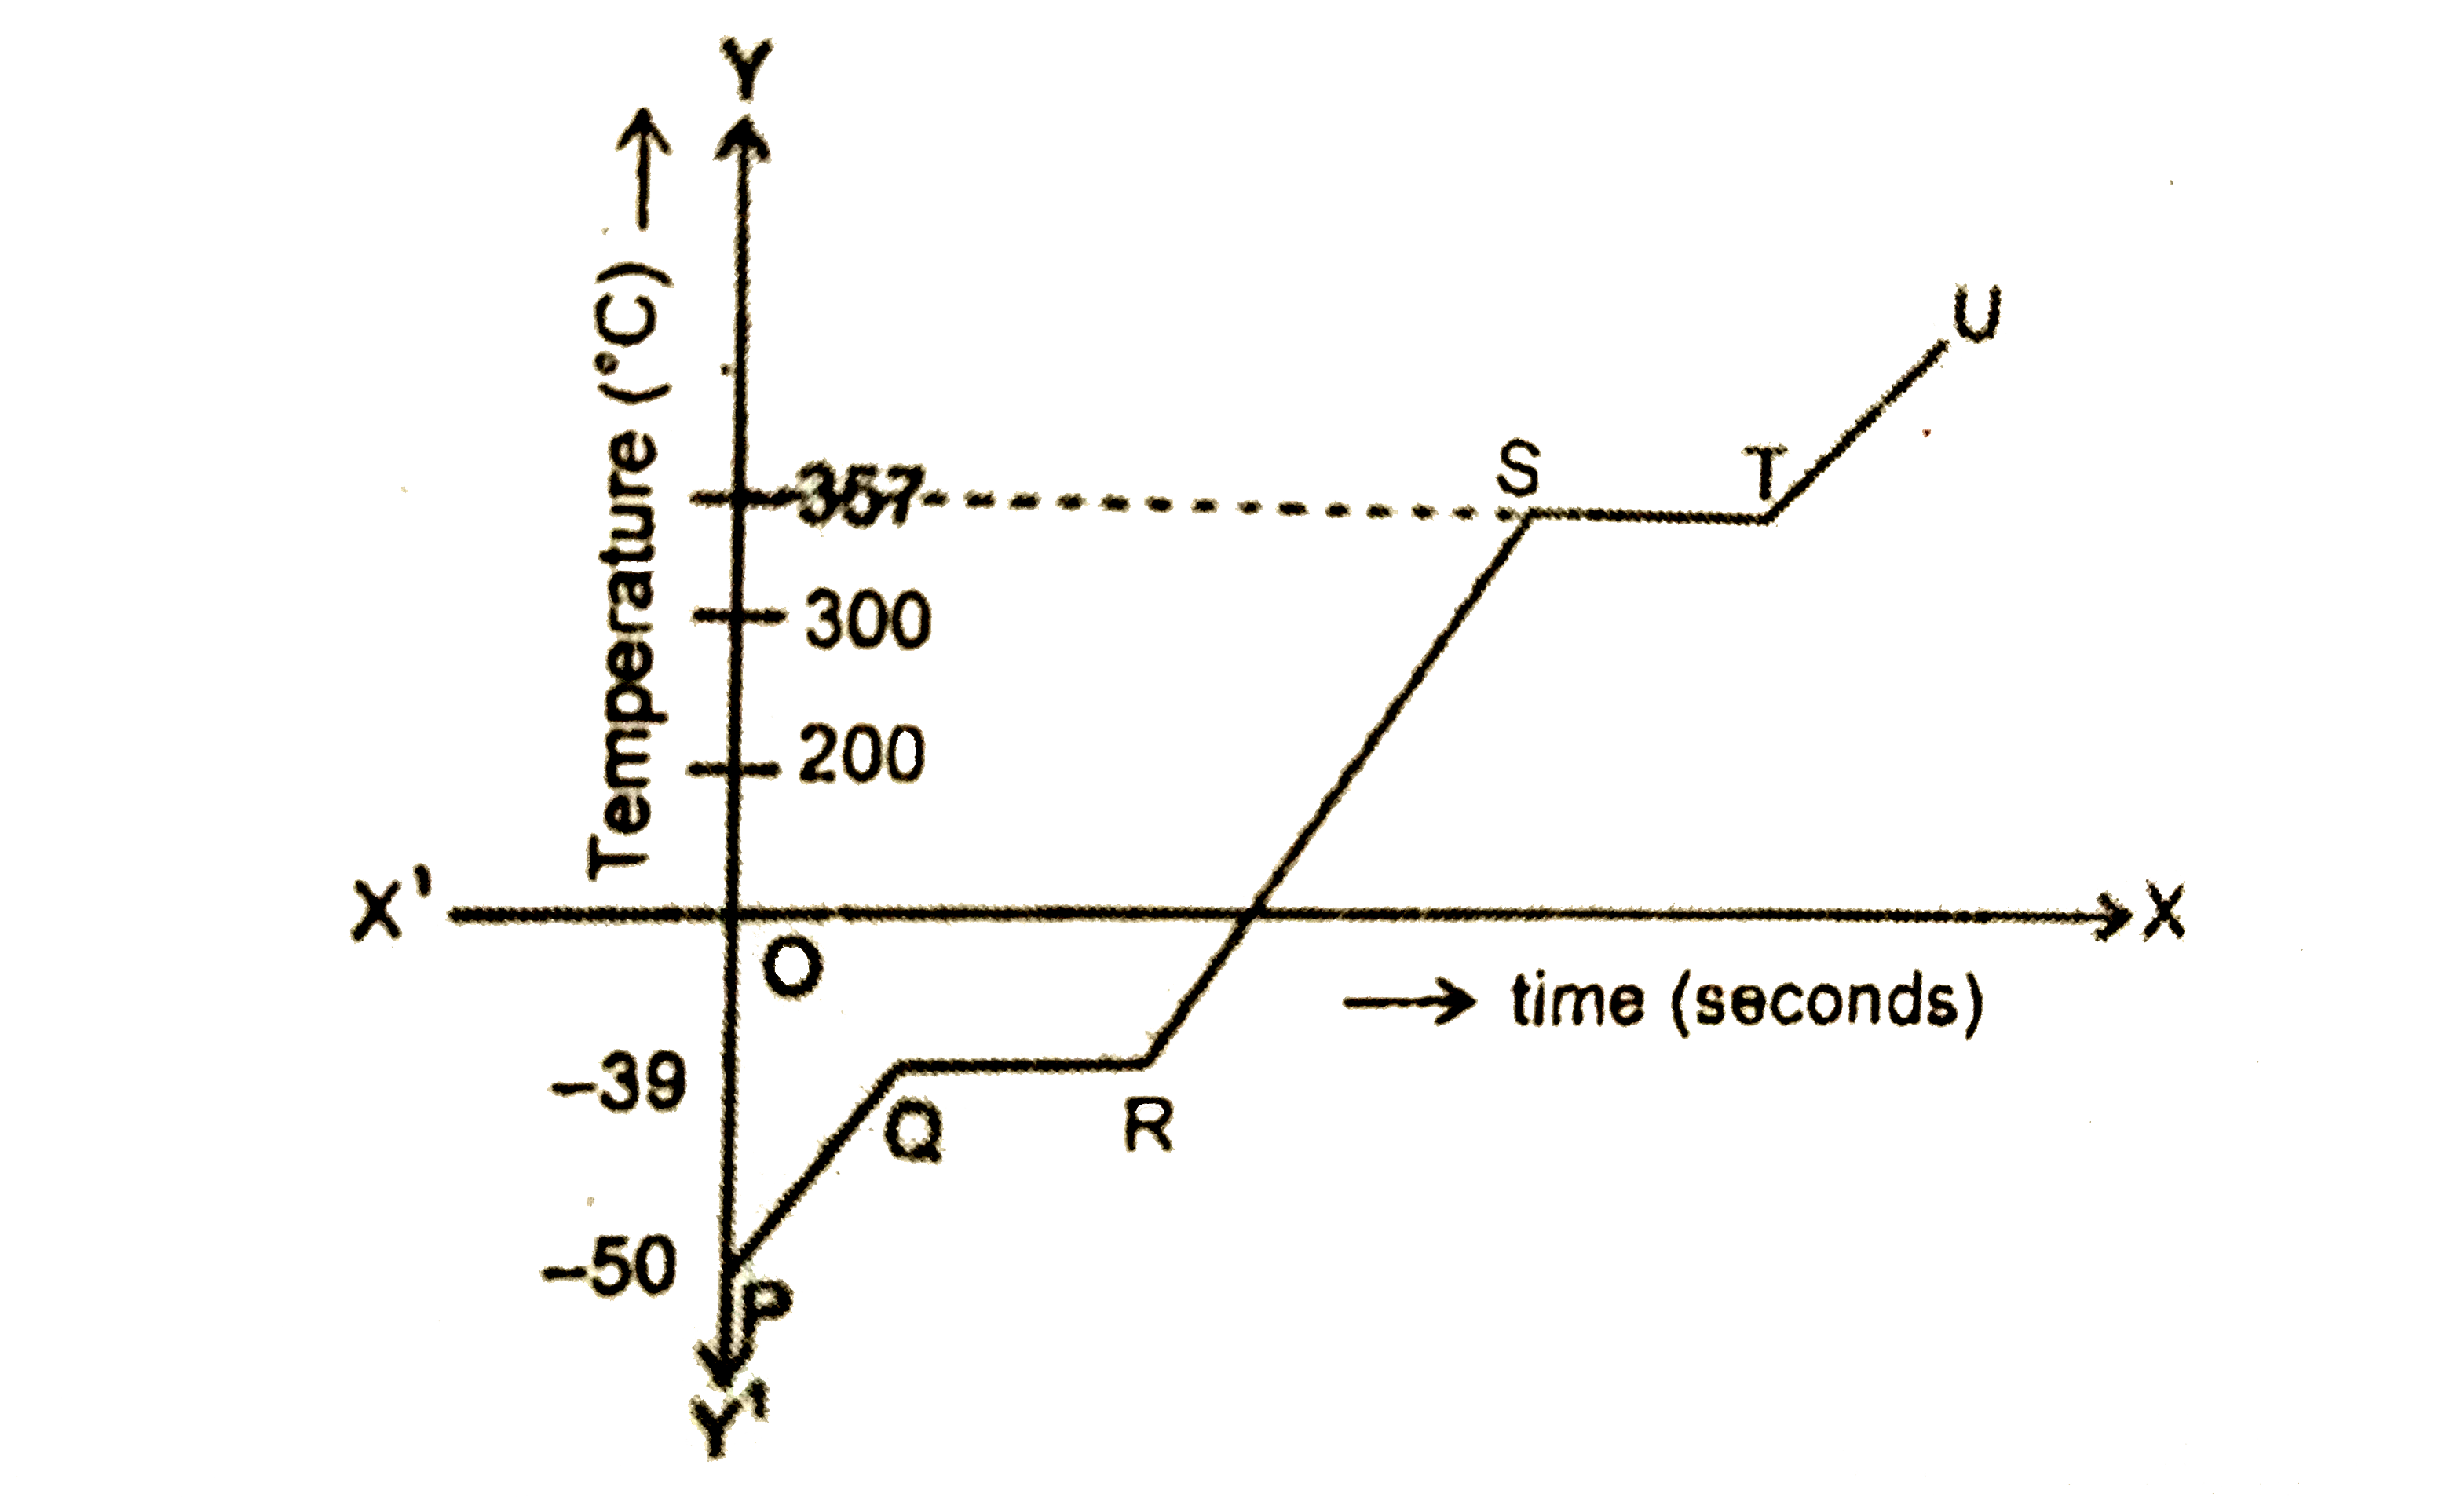 The boiling point of the substance is _________C∘
View SolutionThe heating cuve of particular substance in solid state is as shown in the figure : Choose the correct aternativ e
 The boiling point of the substance is _________C∘
View SolutionThe heating curve of a particular substance in solid state is as shows in the figure.Choose the correct alternative
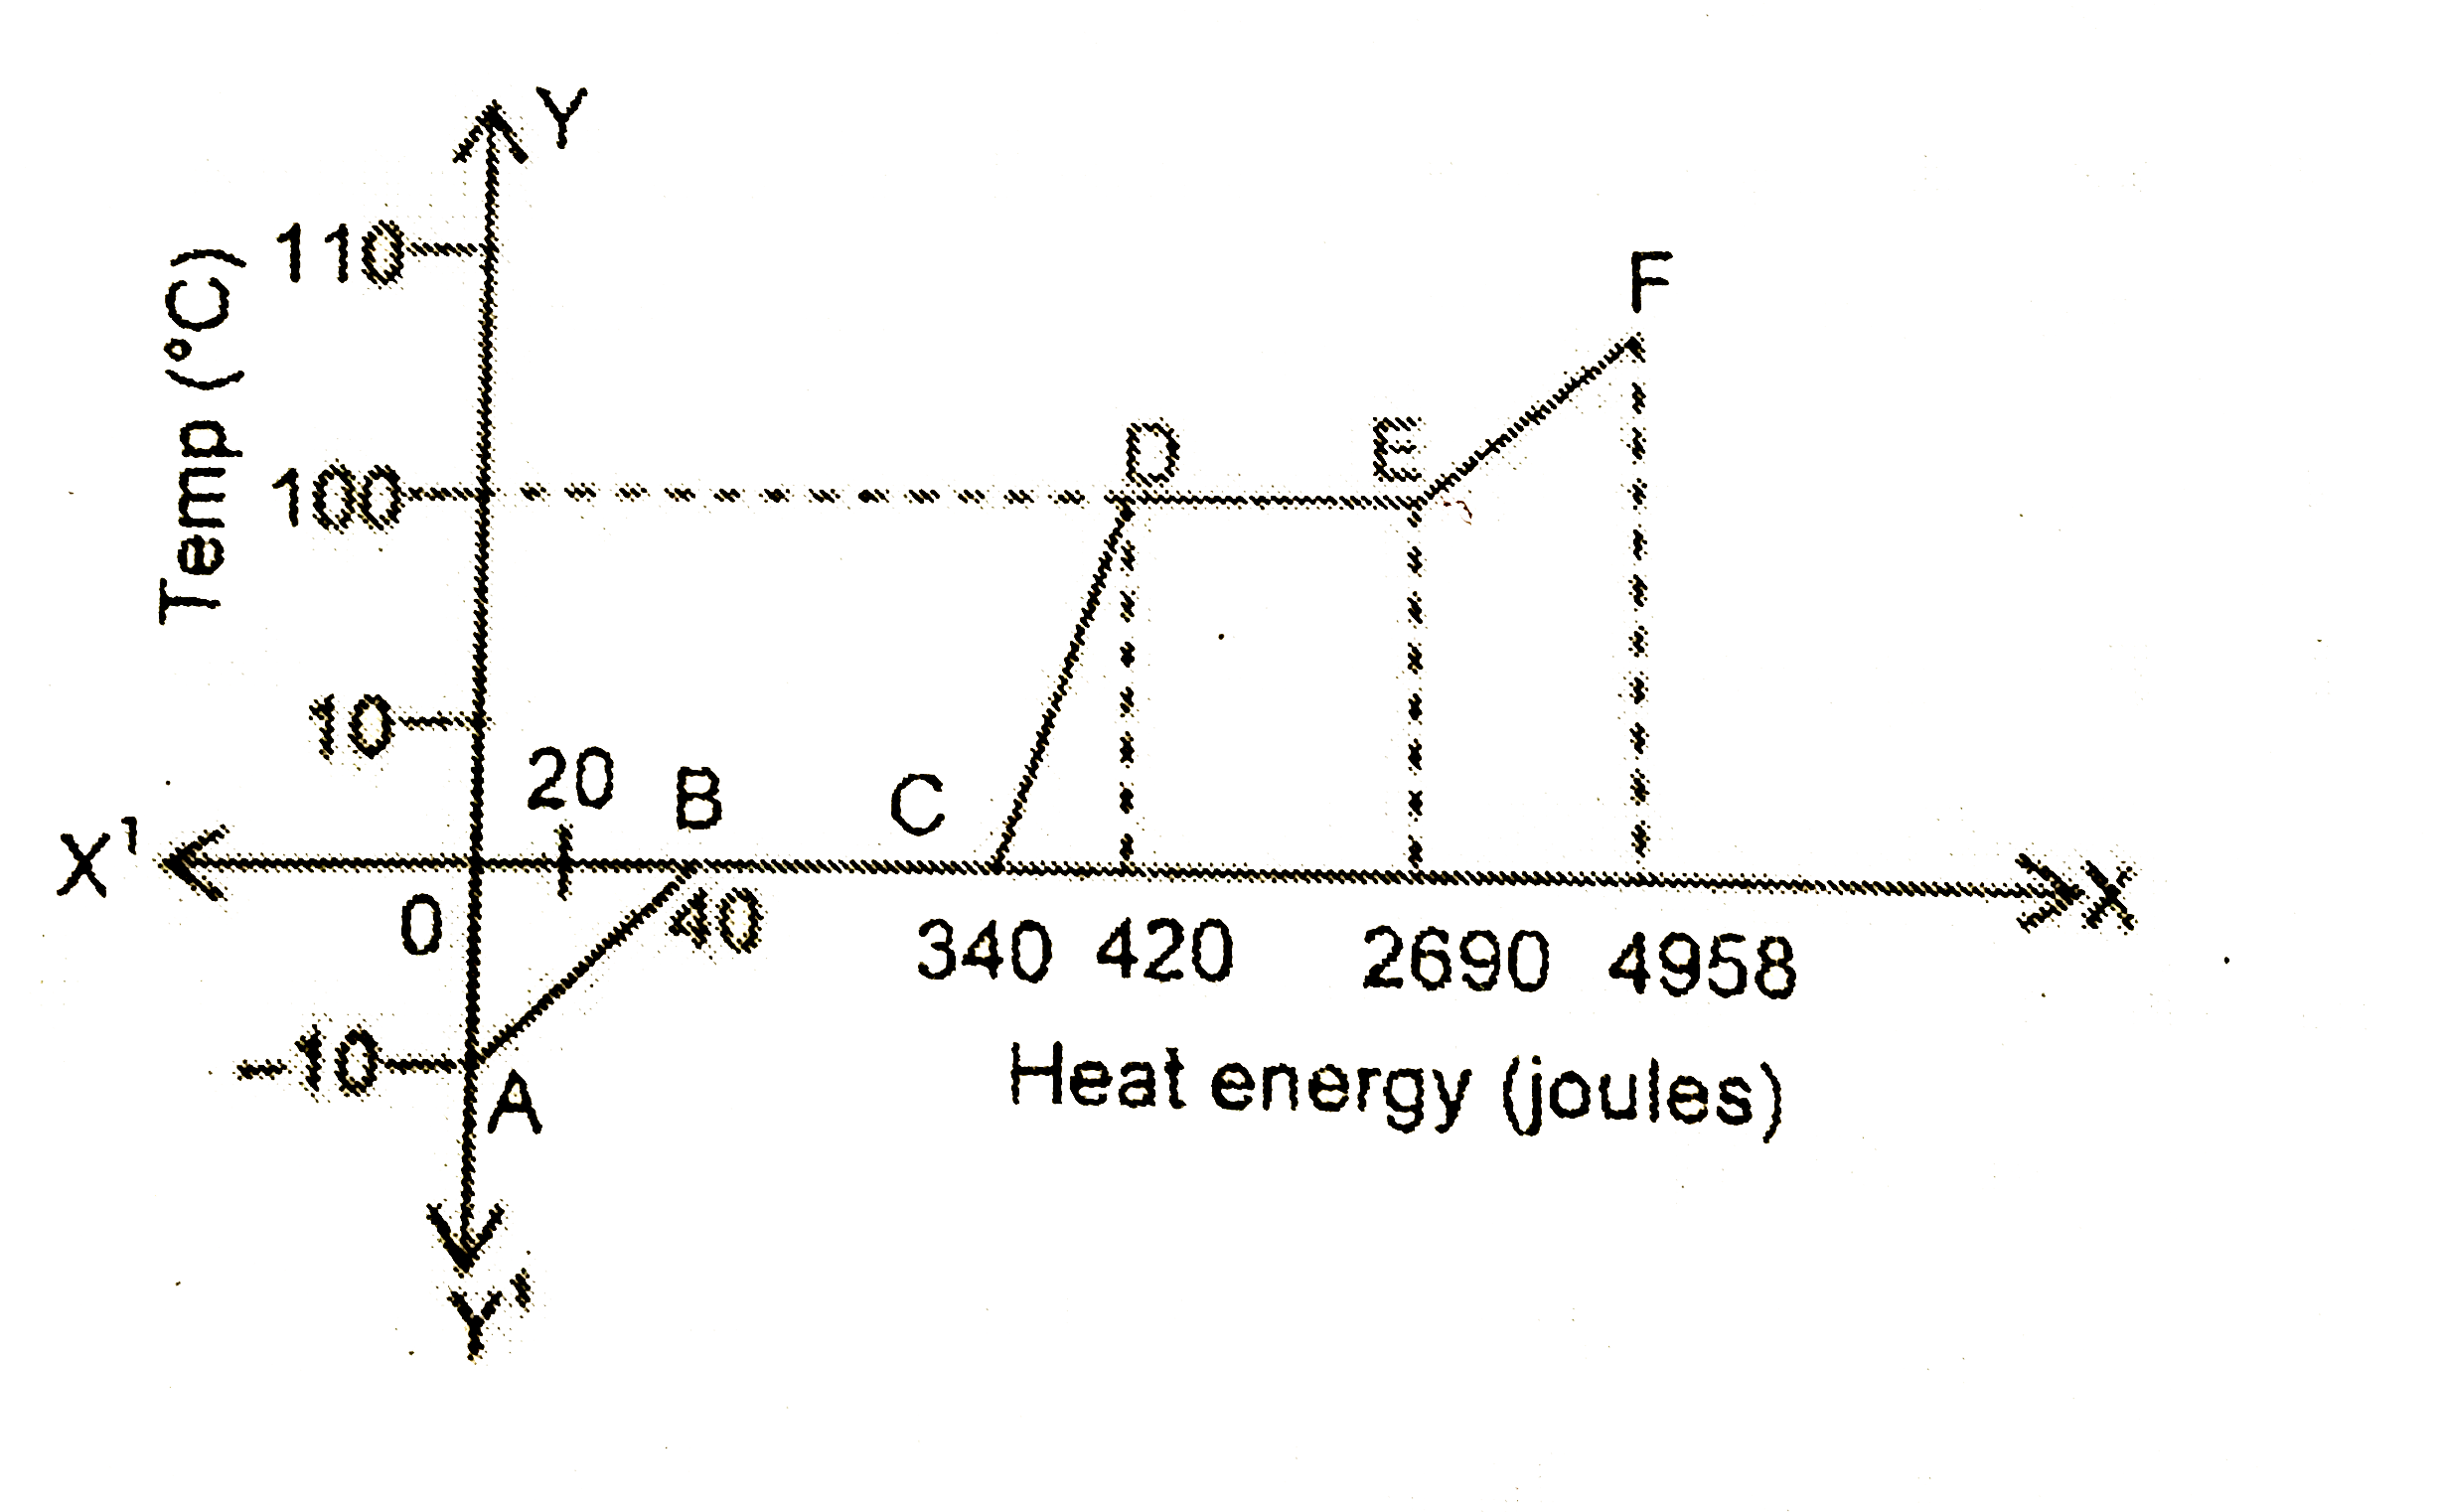
The change of state in the graph is represented by ________part.
View SolutionThe heating curve of a particular substance in solid state is as shows in the figure.Choose the correct alternative

The change of state in the graph is represented by ________part.
View SolutionThe heating curve of a particular substance in solid state is as shows in the figure.Choose the correct alternative

The change of state in the graph is represented by ________part.
View Solution
