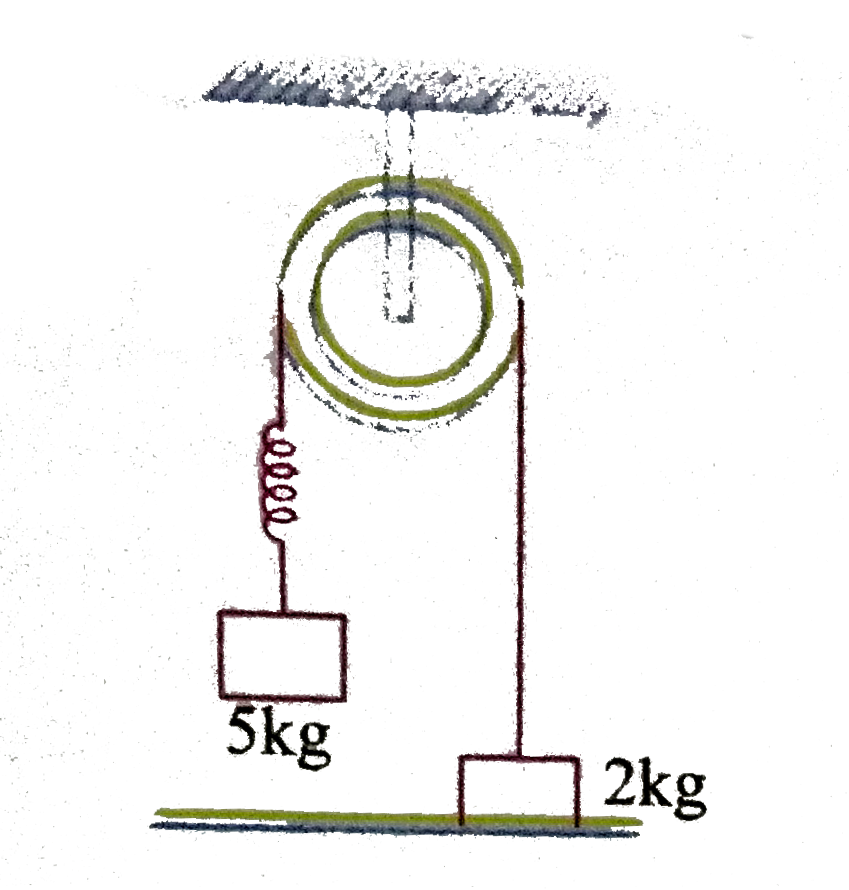
The kinetic energy (KE) versus time graph for a graph for a particle moving along a straight line is shown in the figure. The force vs time graph for the particle may be
 .
.
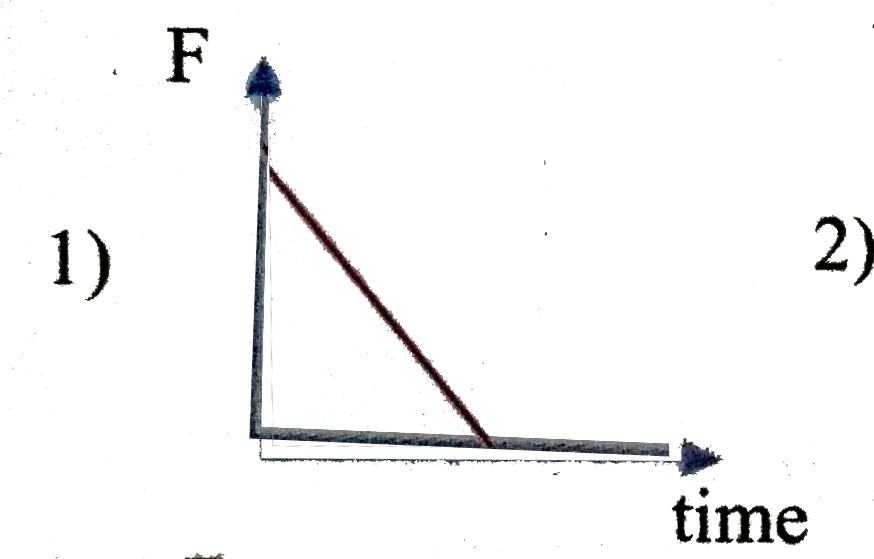
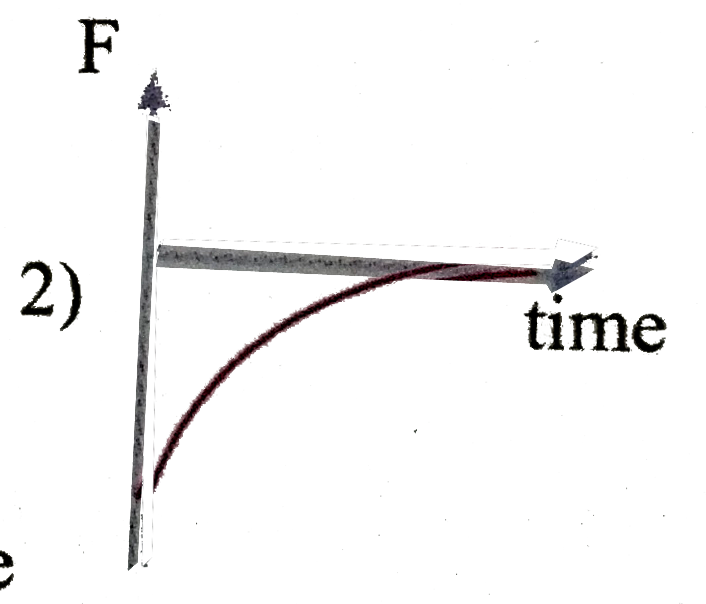
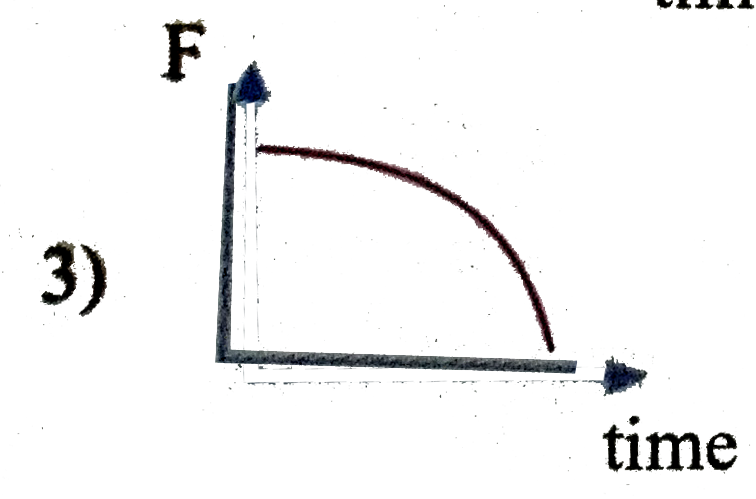
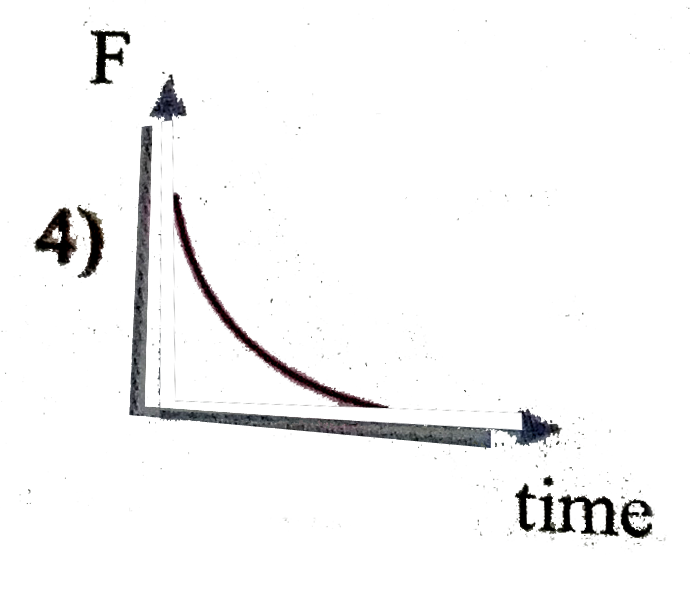
The correct Answer is:D
Ek=12mv2=kt,⇒ power 'P'=(dEkdt)=k
In this case, P=Fv
Hence, F=Pv=K√2Ktm=K'√t
where K1 is another constant.
Topper's Solved these Questions
- WORK POWER AND ENERGYBOOK - NARAYNACHAPTER - WORK POWER AND ENERGYEXERCISE - NCERT (Based Questions)
45 Videos
- WORK POWER AND ENERGYBOOK - NARAYNACHAPTER - WORK POWER AND ENERGYEXERCISE - Level-V (Single Answer)
24 Videos
- WORK POWER AND ENERGYBOOK - NARAYNACHAPTER - WORK POWER AND ENERGYEXERCISE - Level- II (C.W)
68 Videos
- WORK , ENERGY & POWER BOOK - NARAYNACHAPTER - WORK , ENERGY & POWER EXERCISE - EXERCISE IV
43 Videos
Similar Questions
The kinetic energy (KE) versus time graph for a particle moving along a straight line is as shown in the figure. The force versus time graph for the particle may be

View SolutionThe x-t graph of a particle moving along a straight line is shown in figure
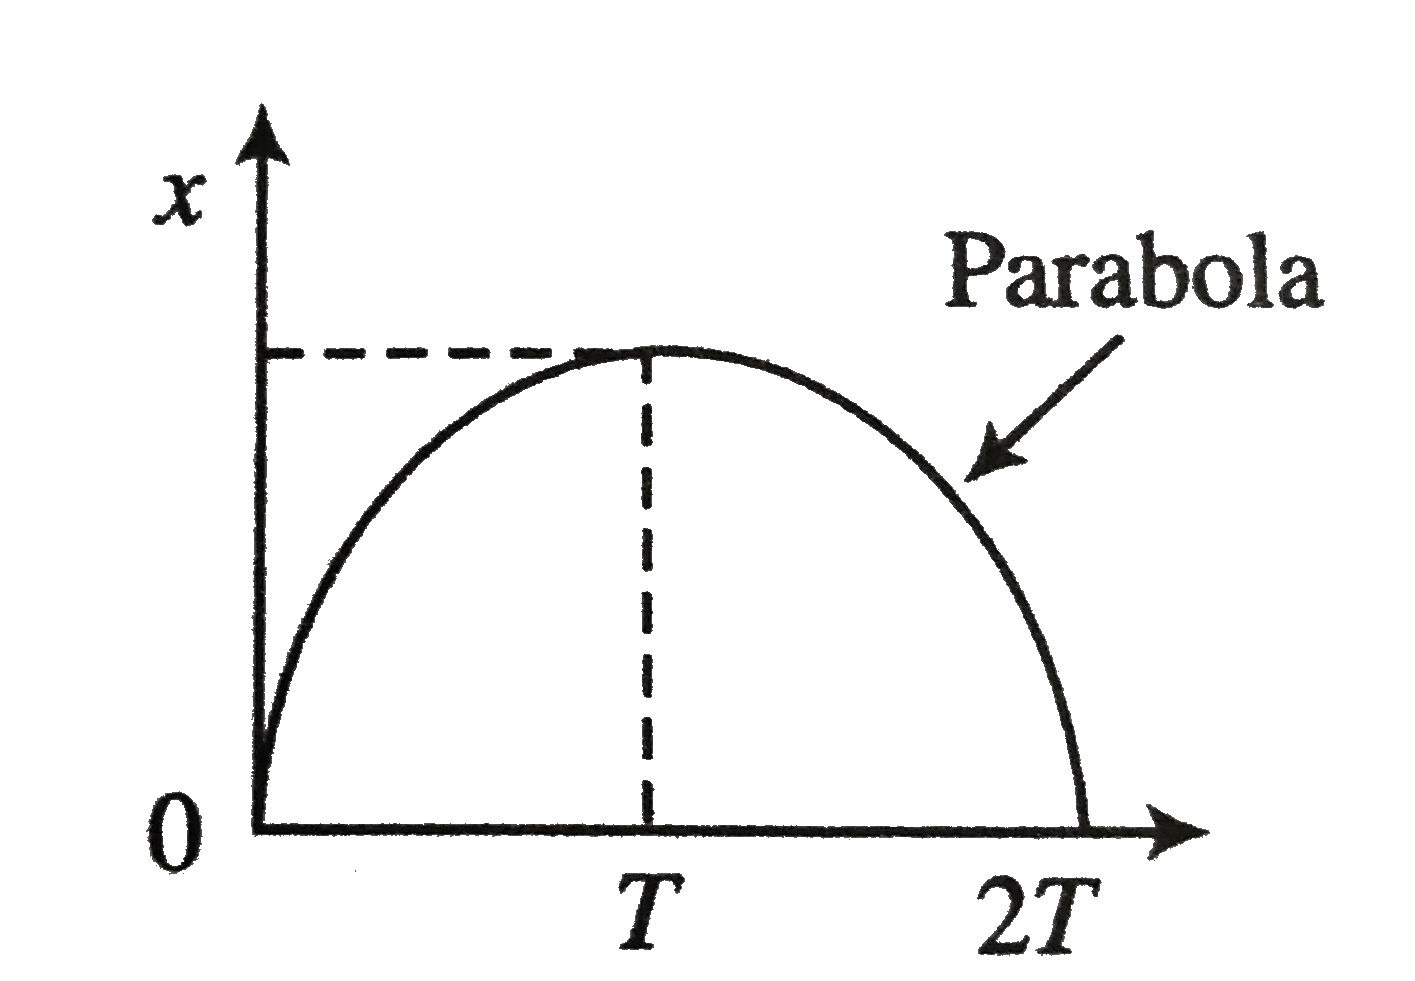
The speed-time graph of the particle is correctly shown by
View Solution
Knowledge Check
The kinetic energy (KE) versus time graph for a particle moving along a straight line is as shown in the figure. The force versus time graph for the particle may be
 A
A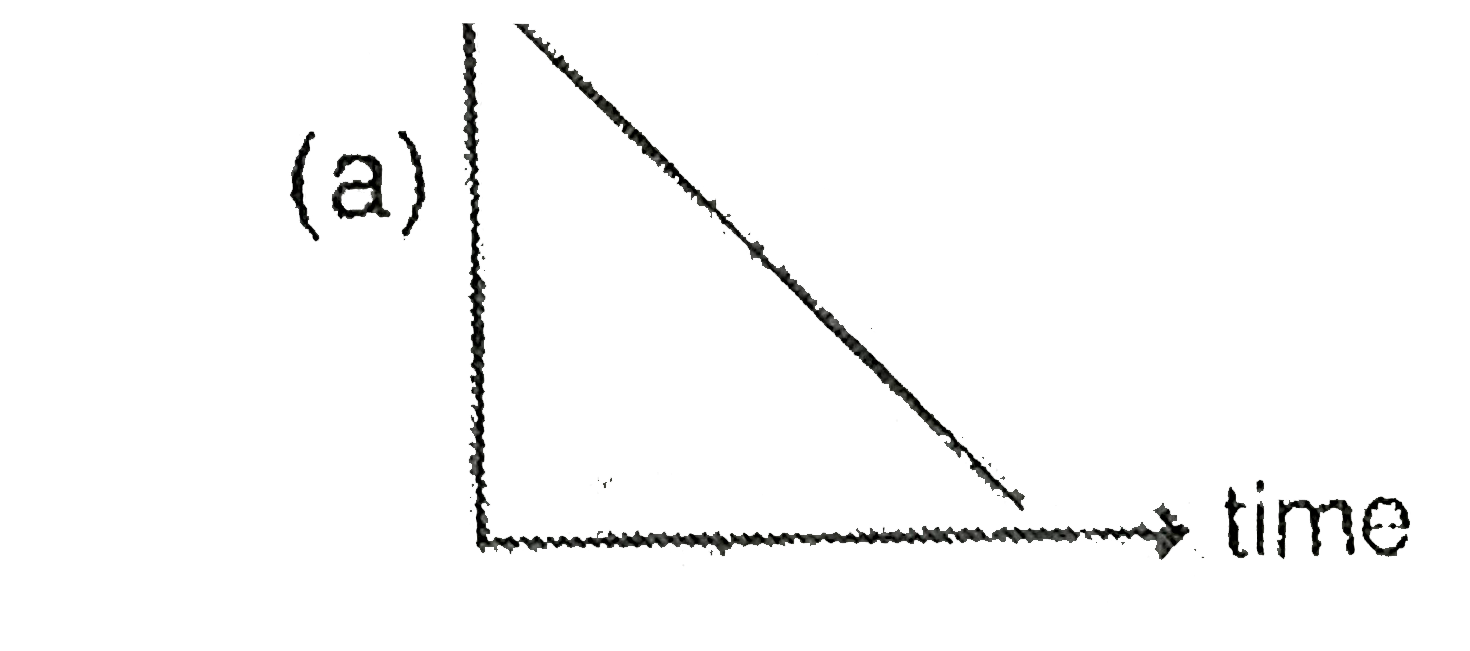 B
B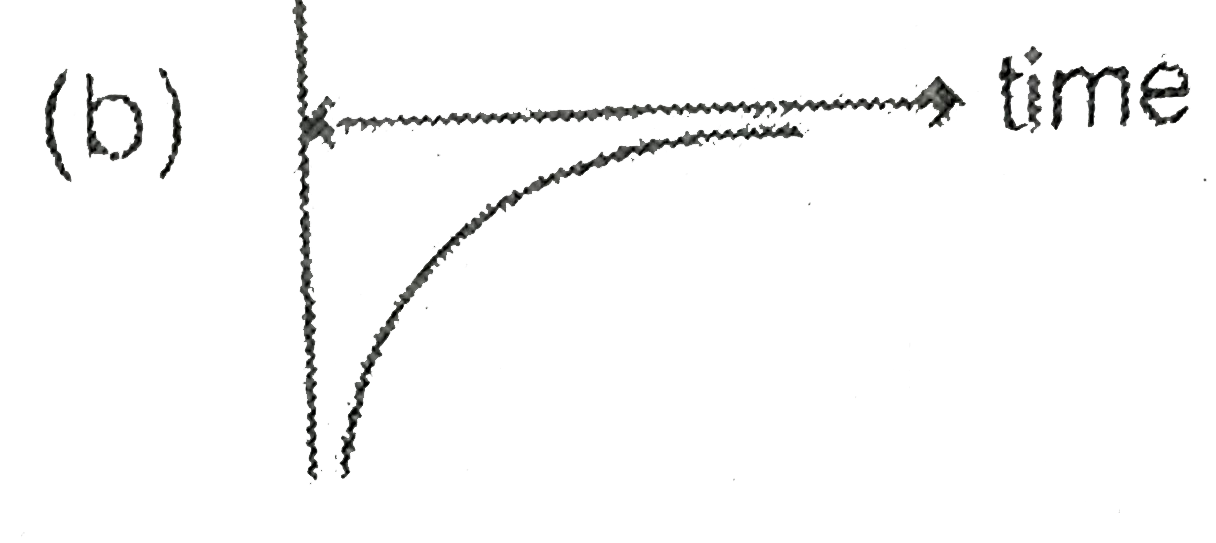 C
C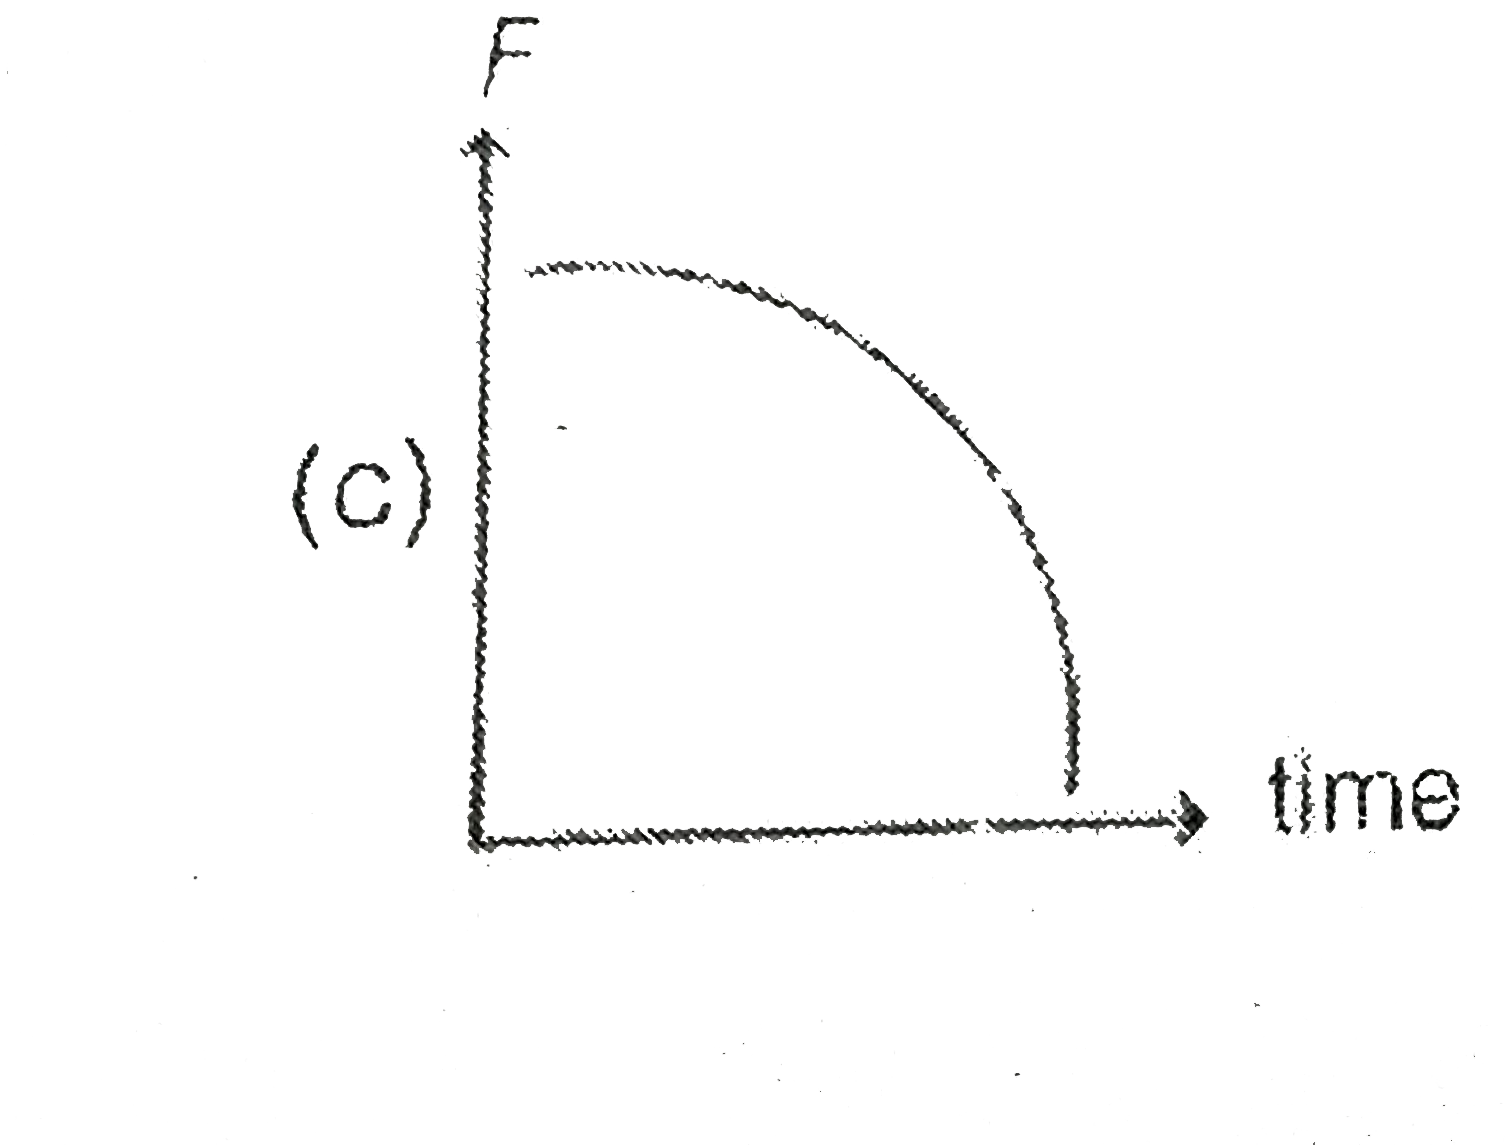 D
D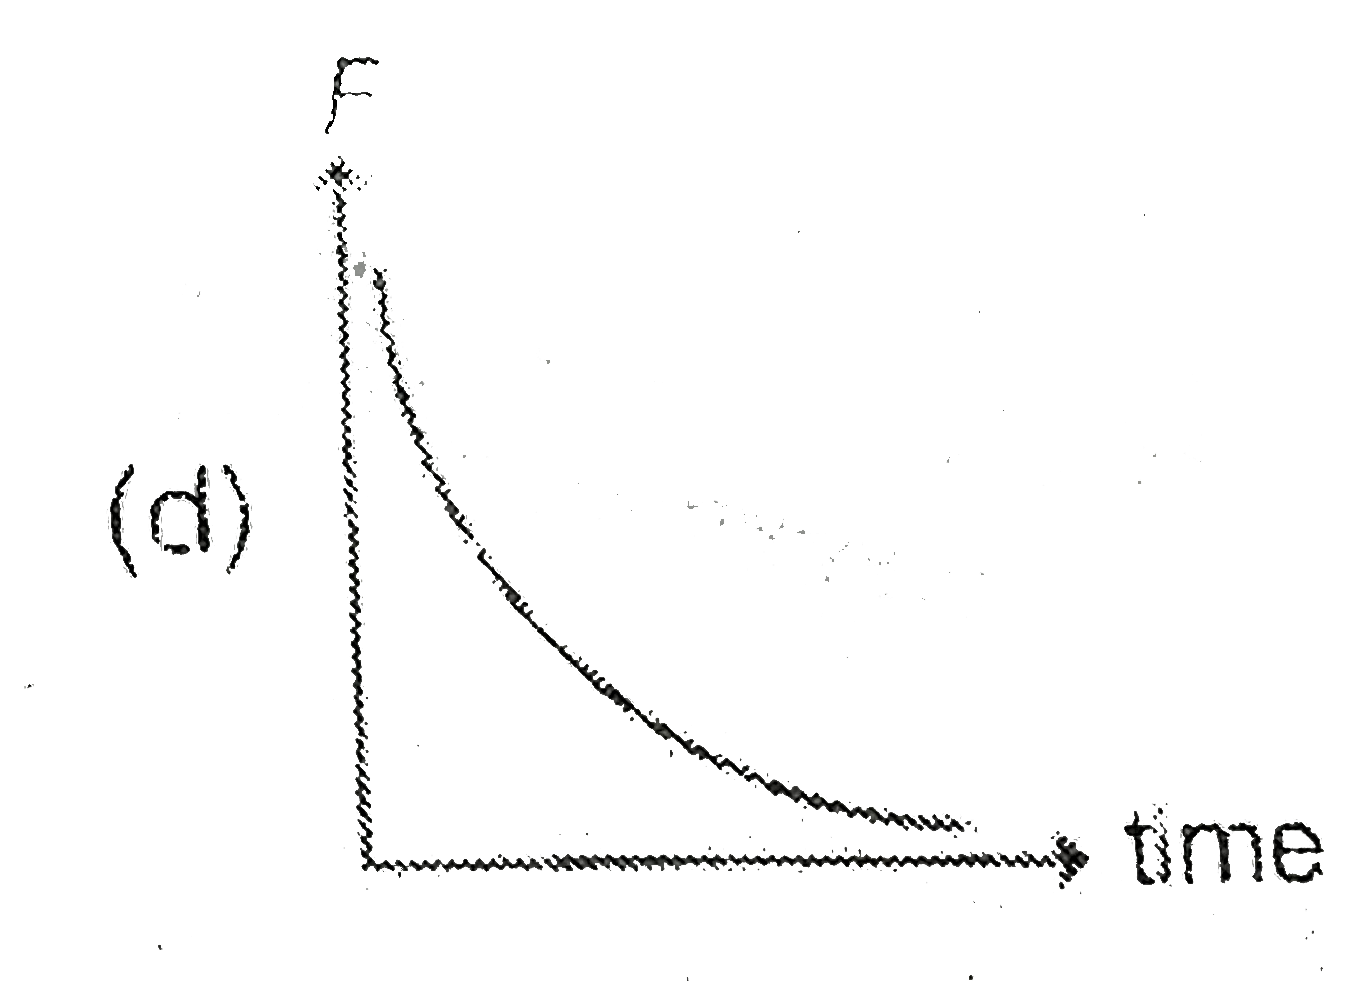
The x-t graph of a particle moving along a straight line is shown in figure

The speed-time graph of the particle is correctly shown byA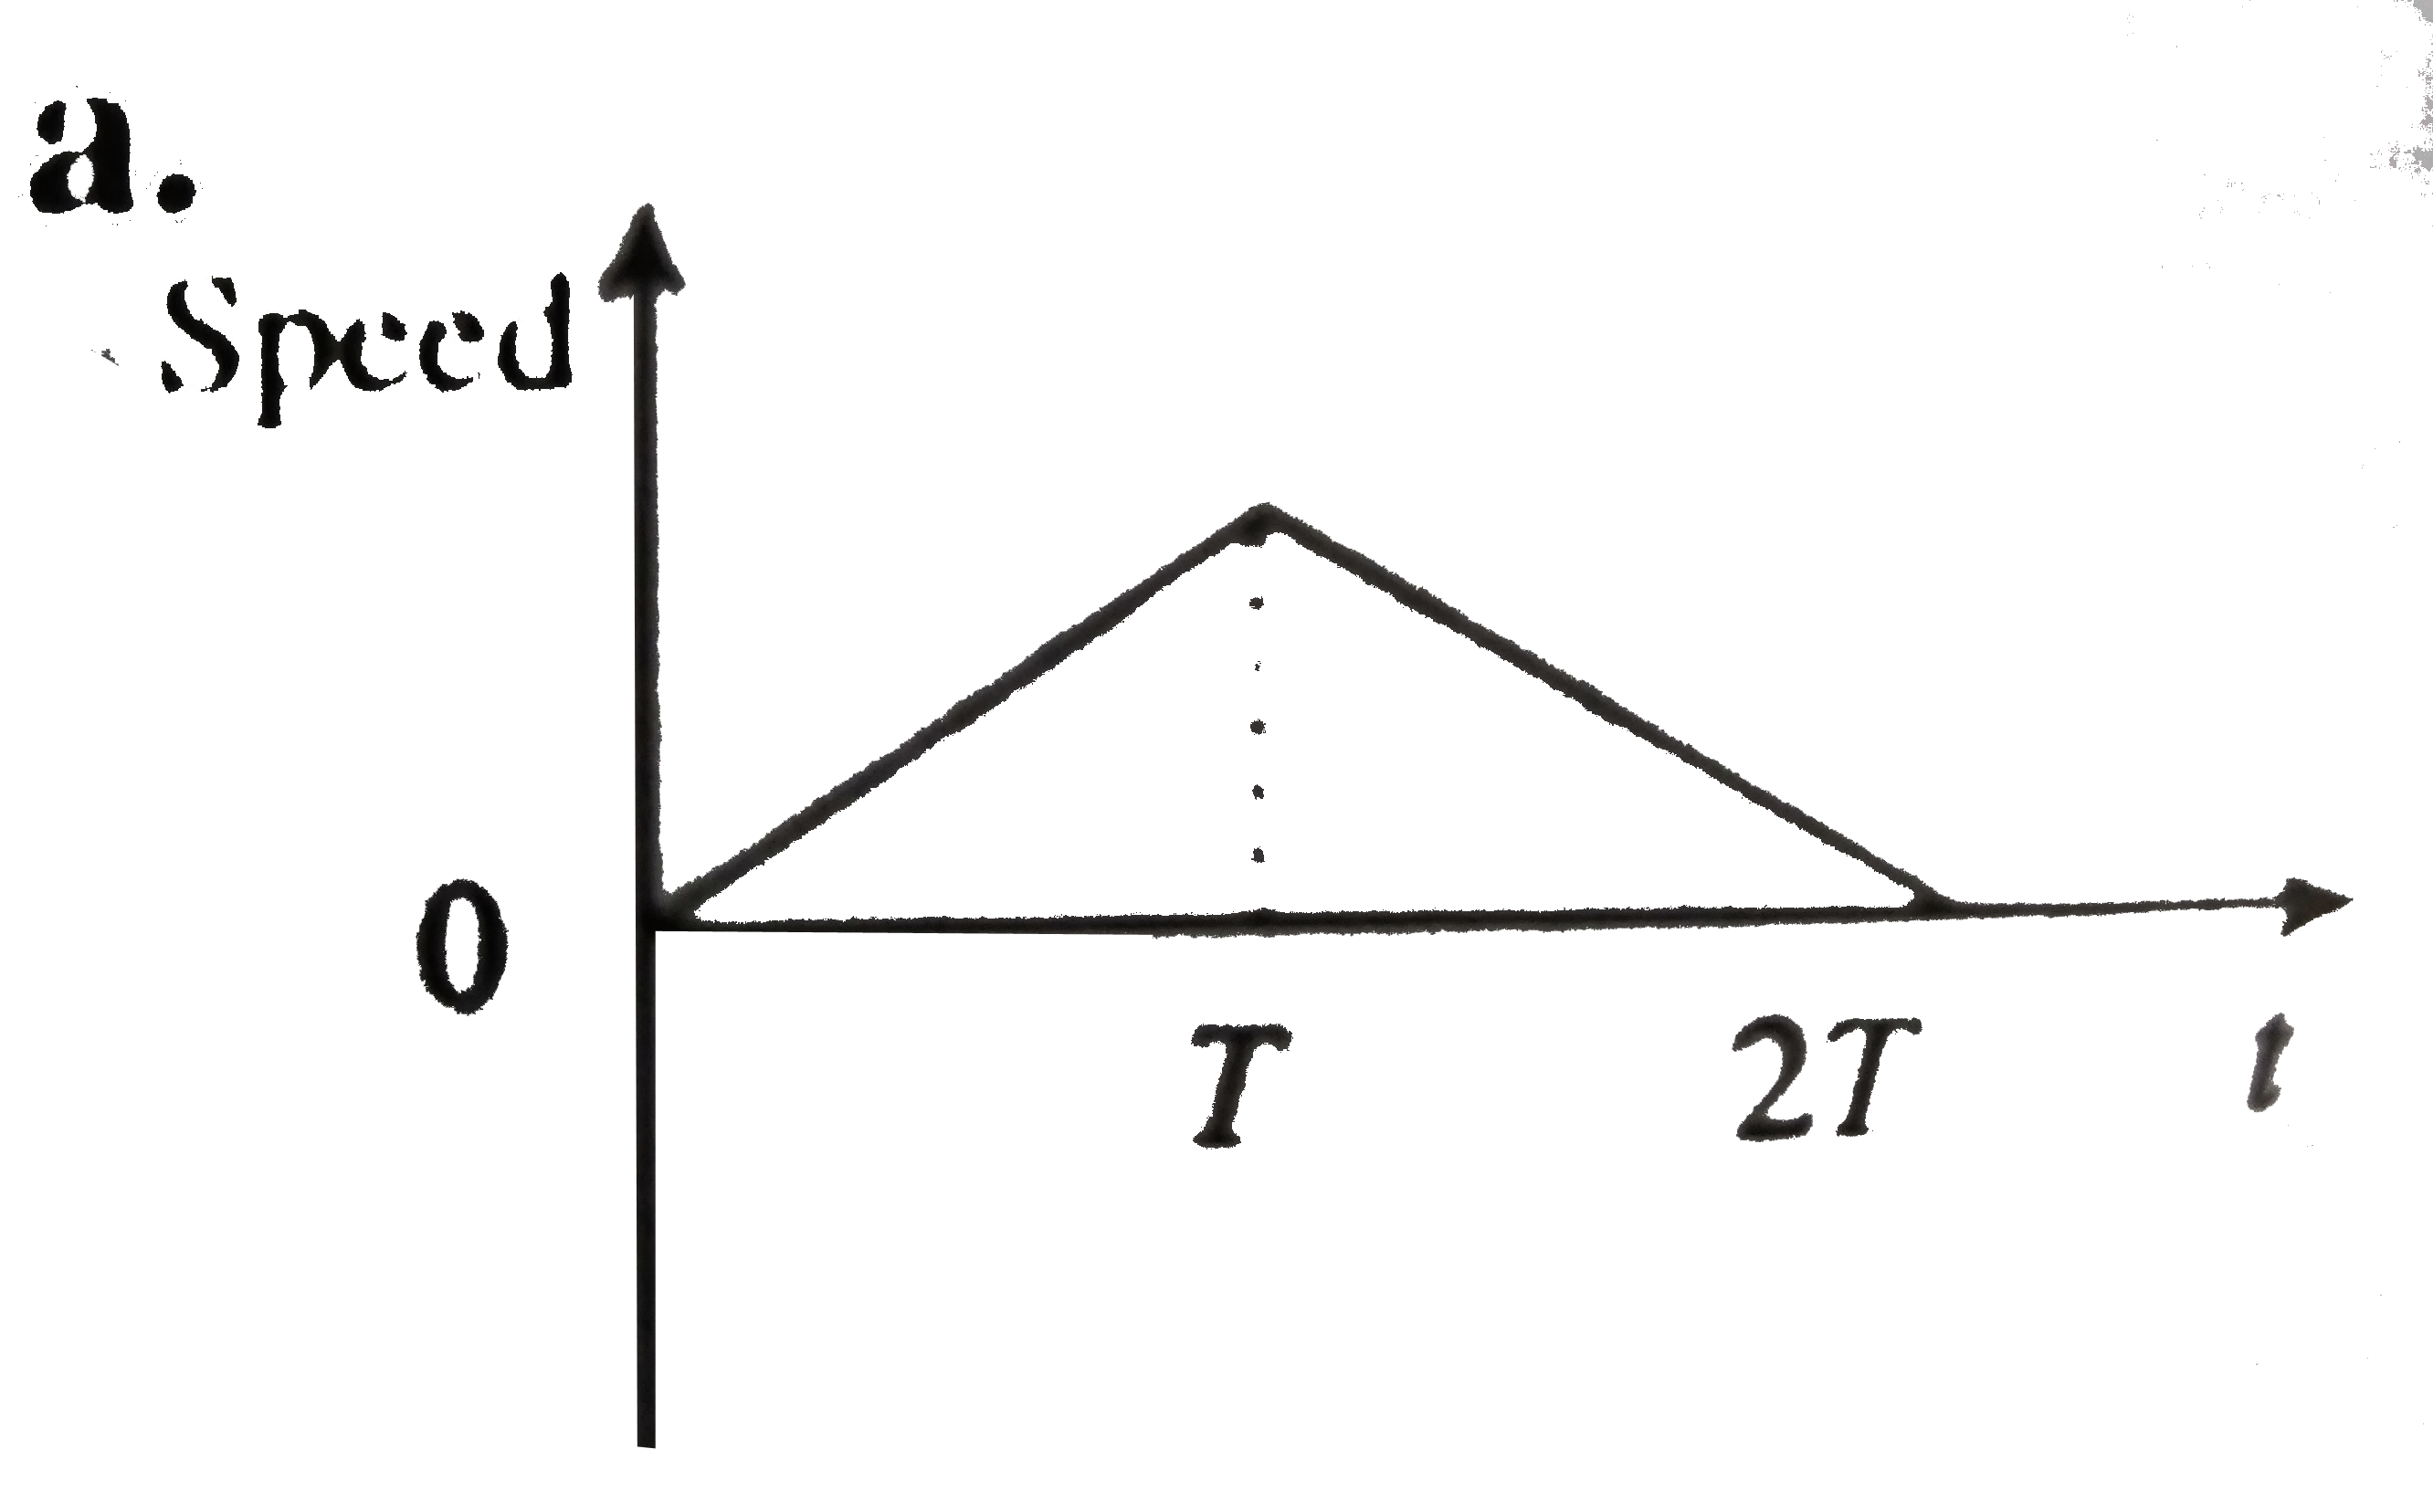 B
B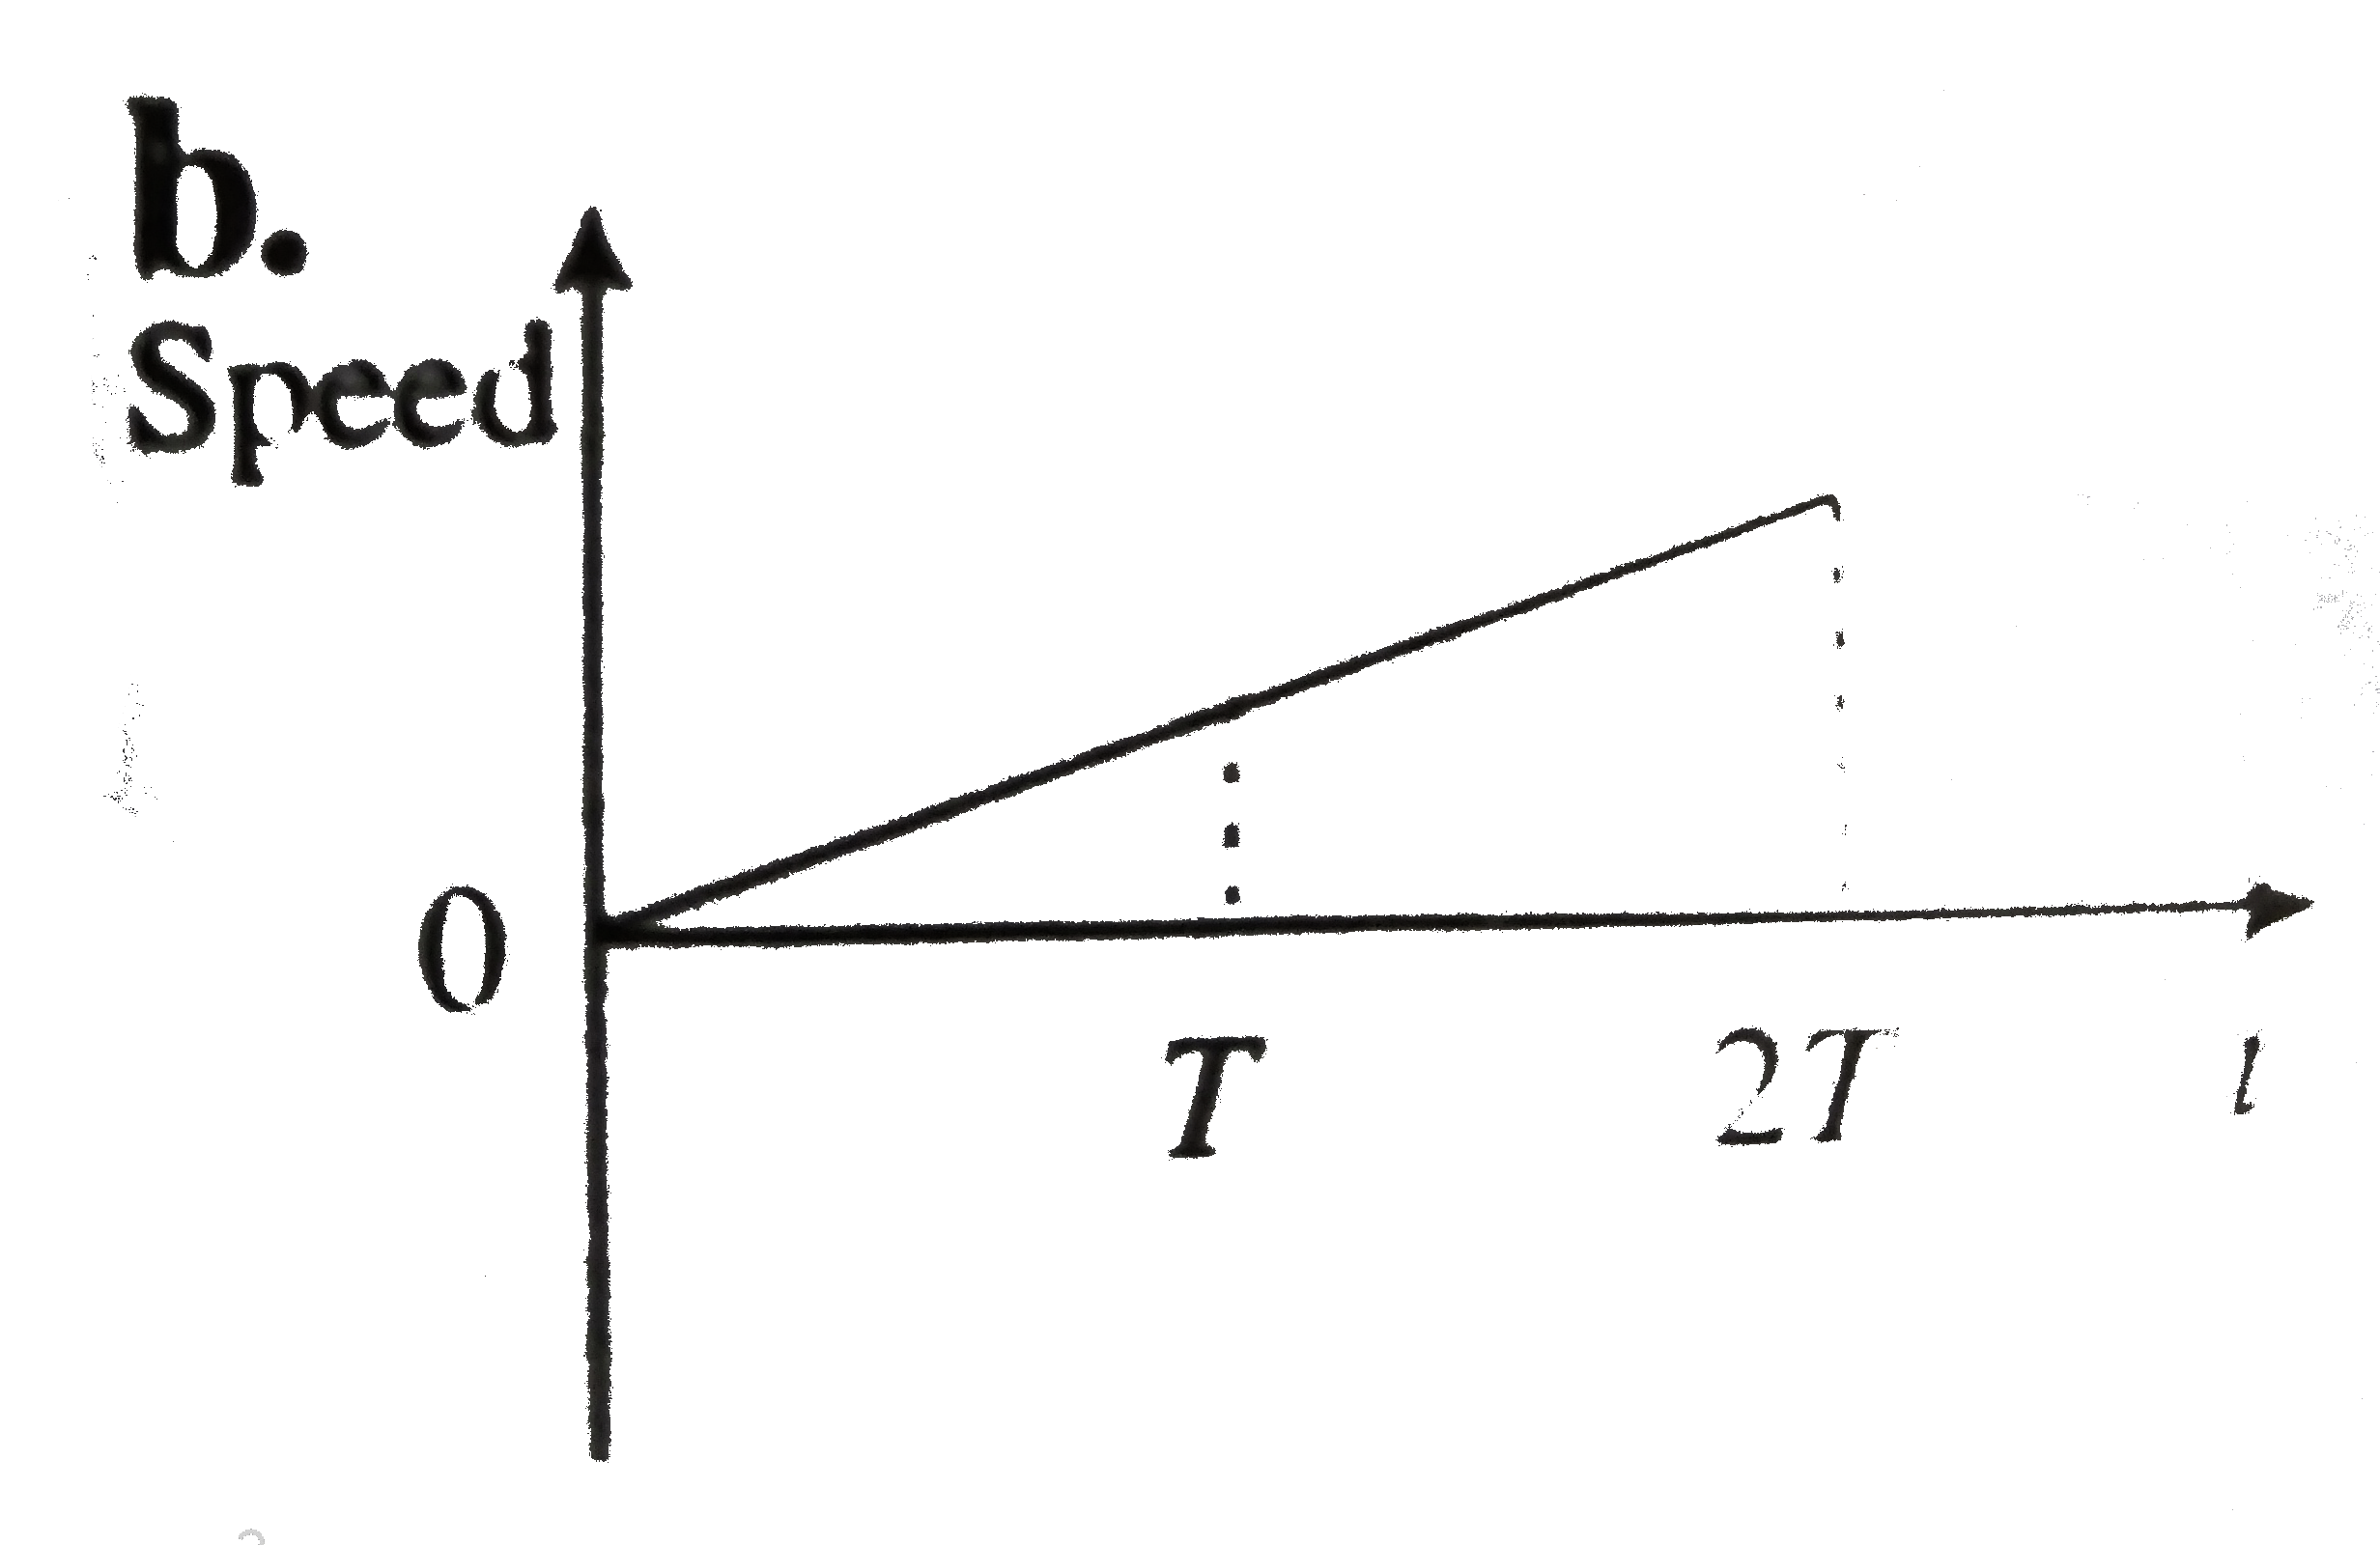 C
C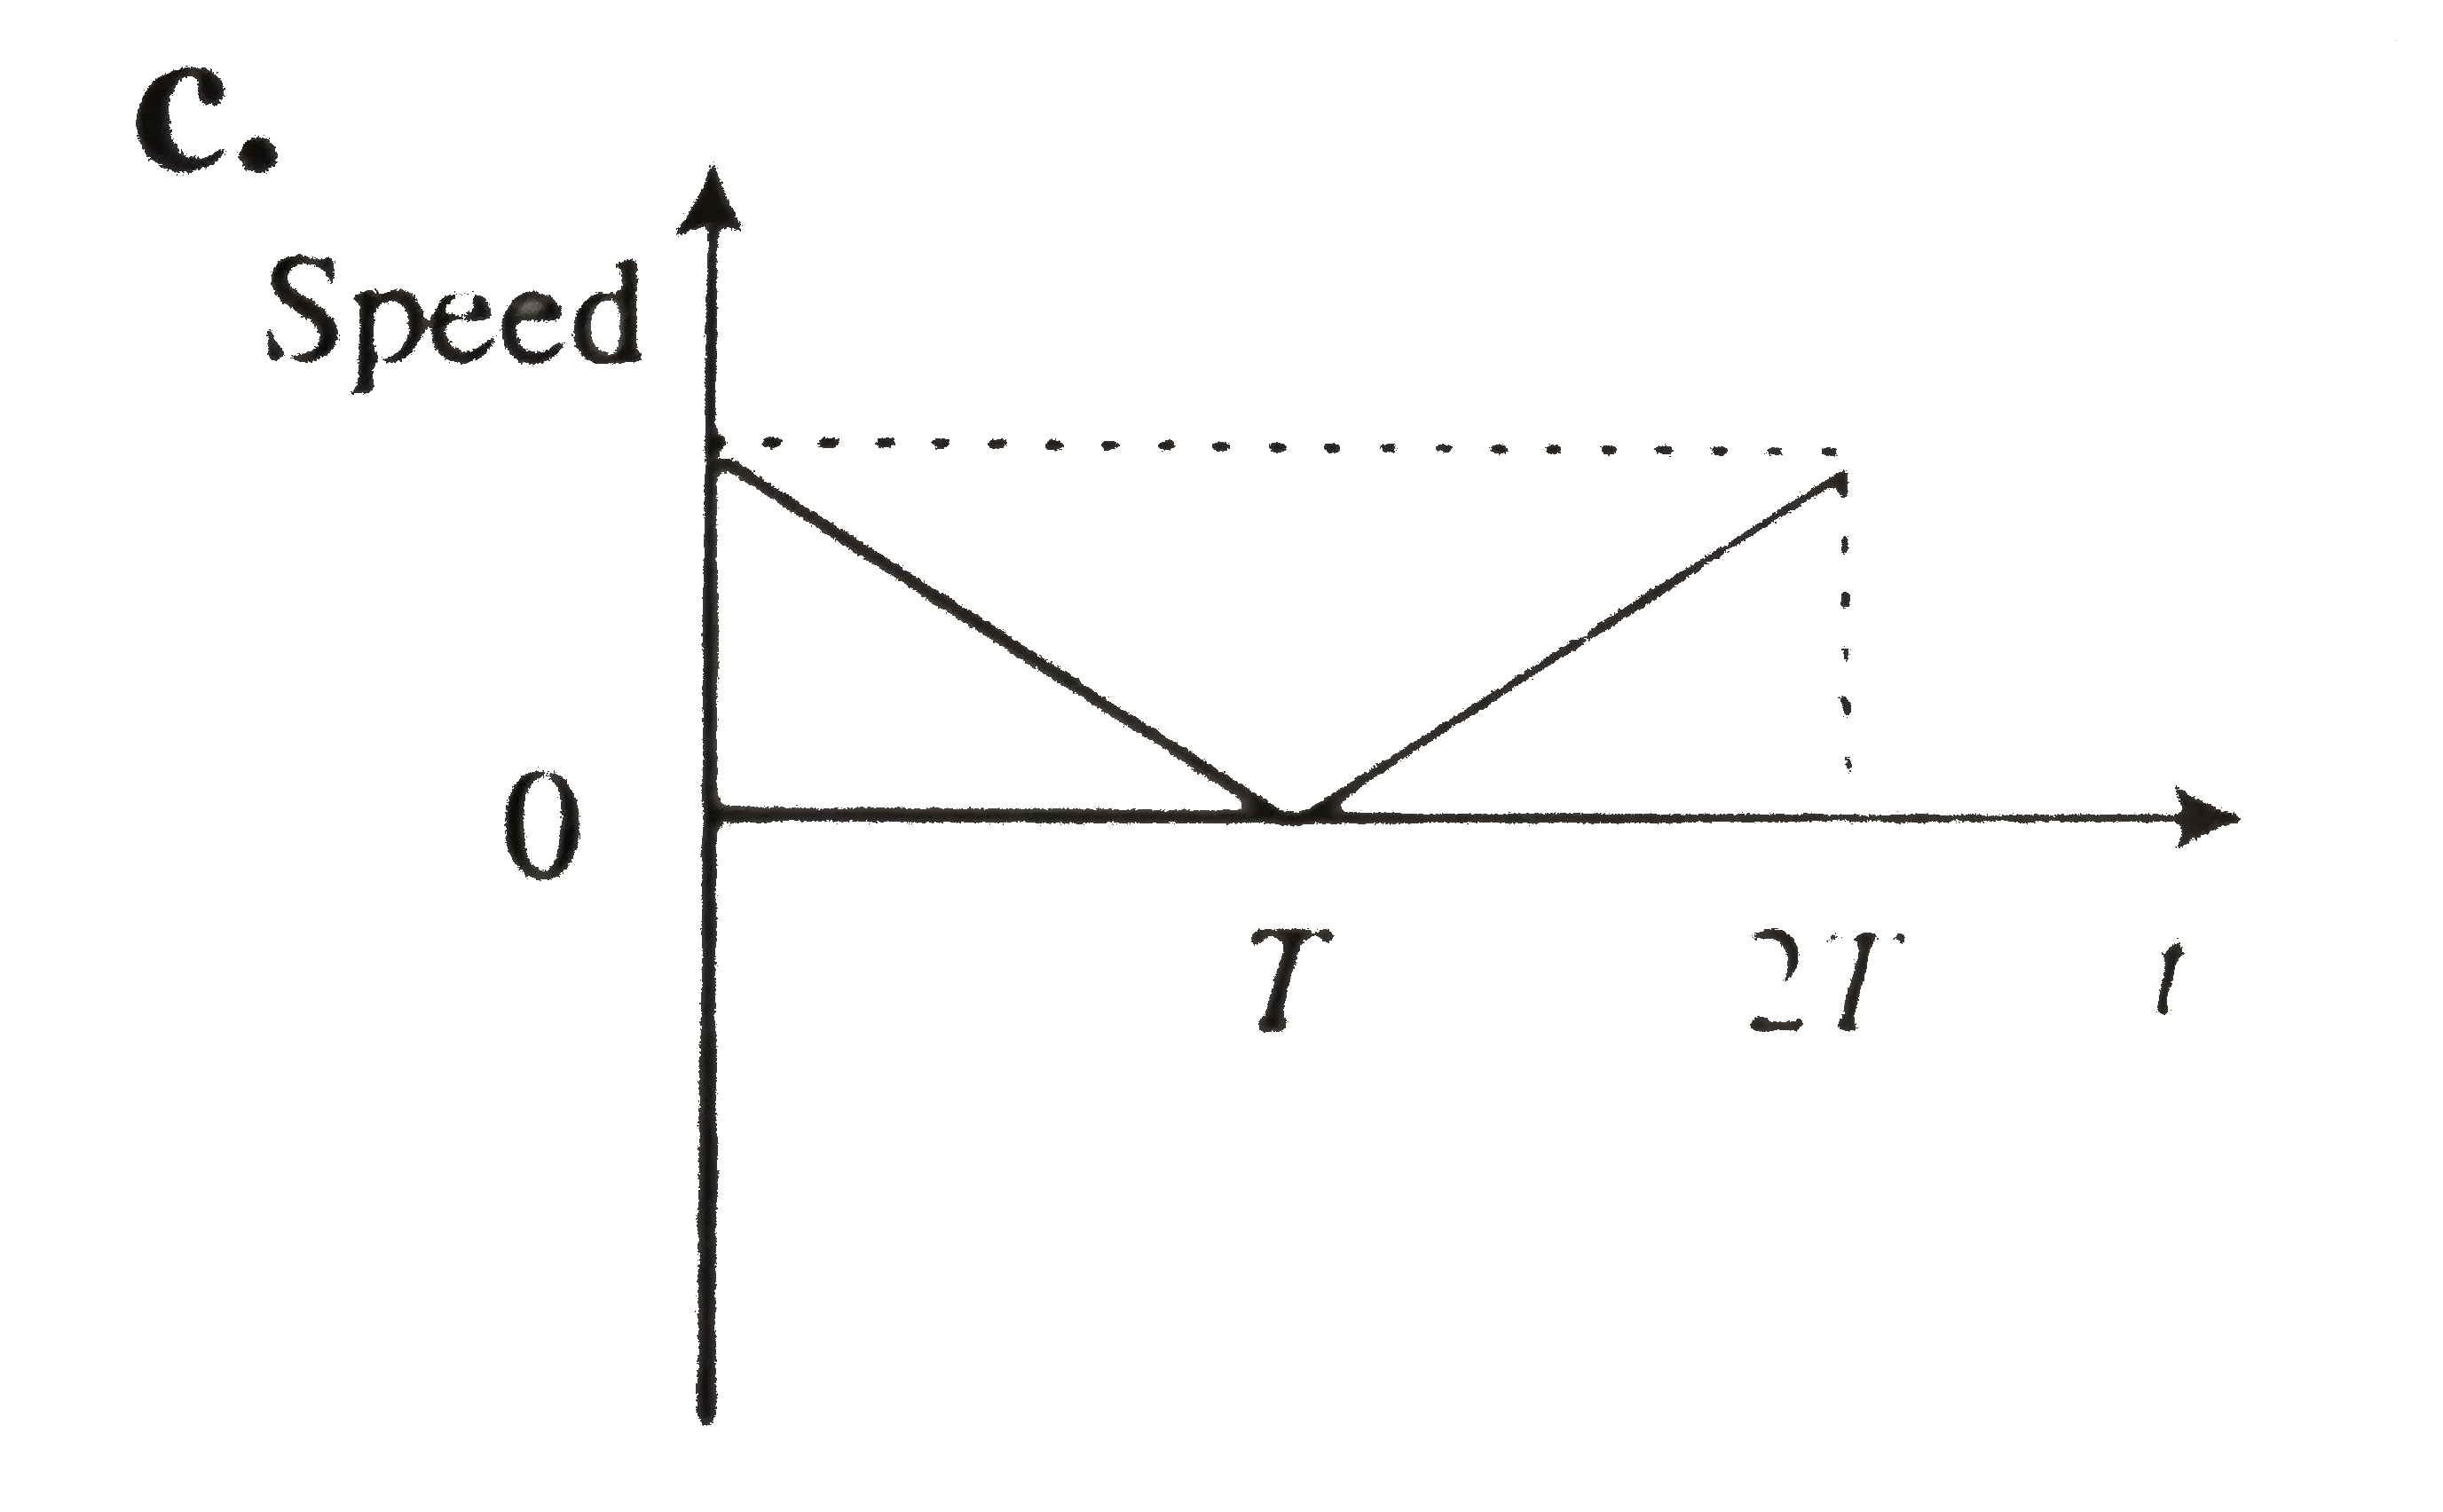 D
D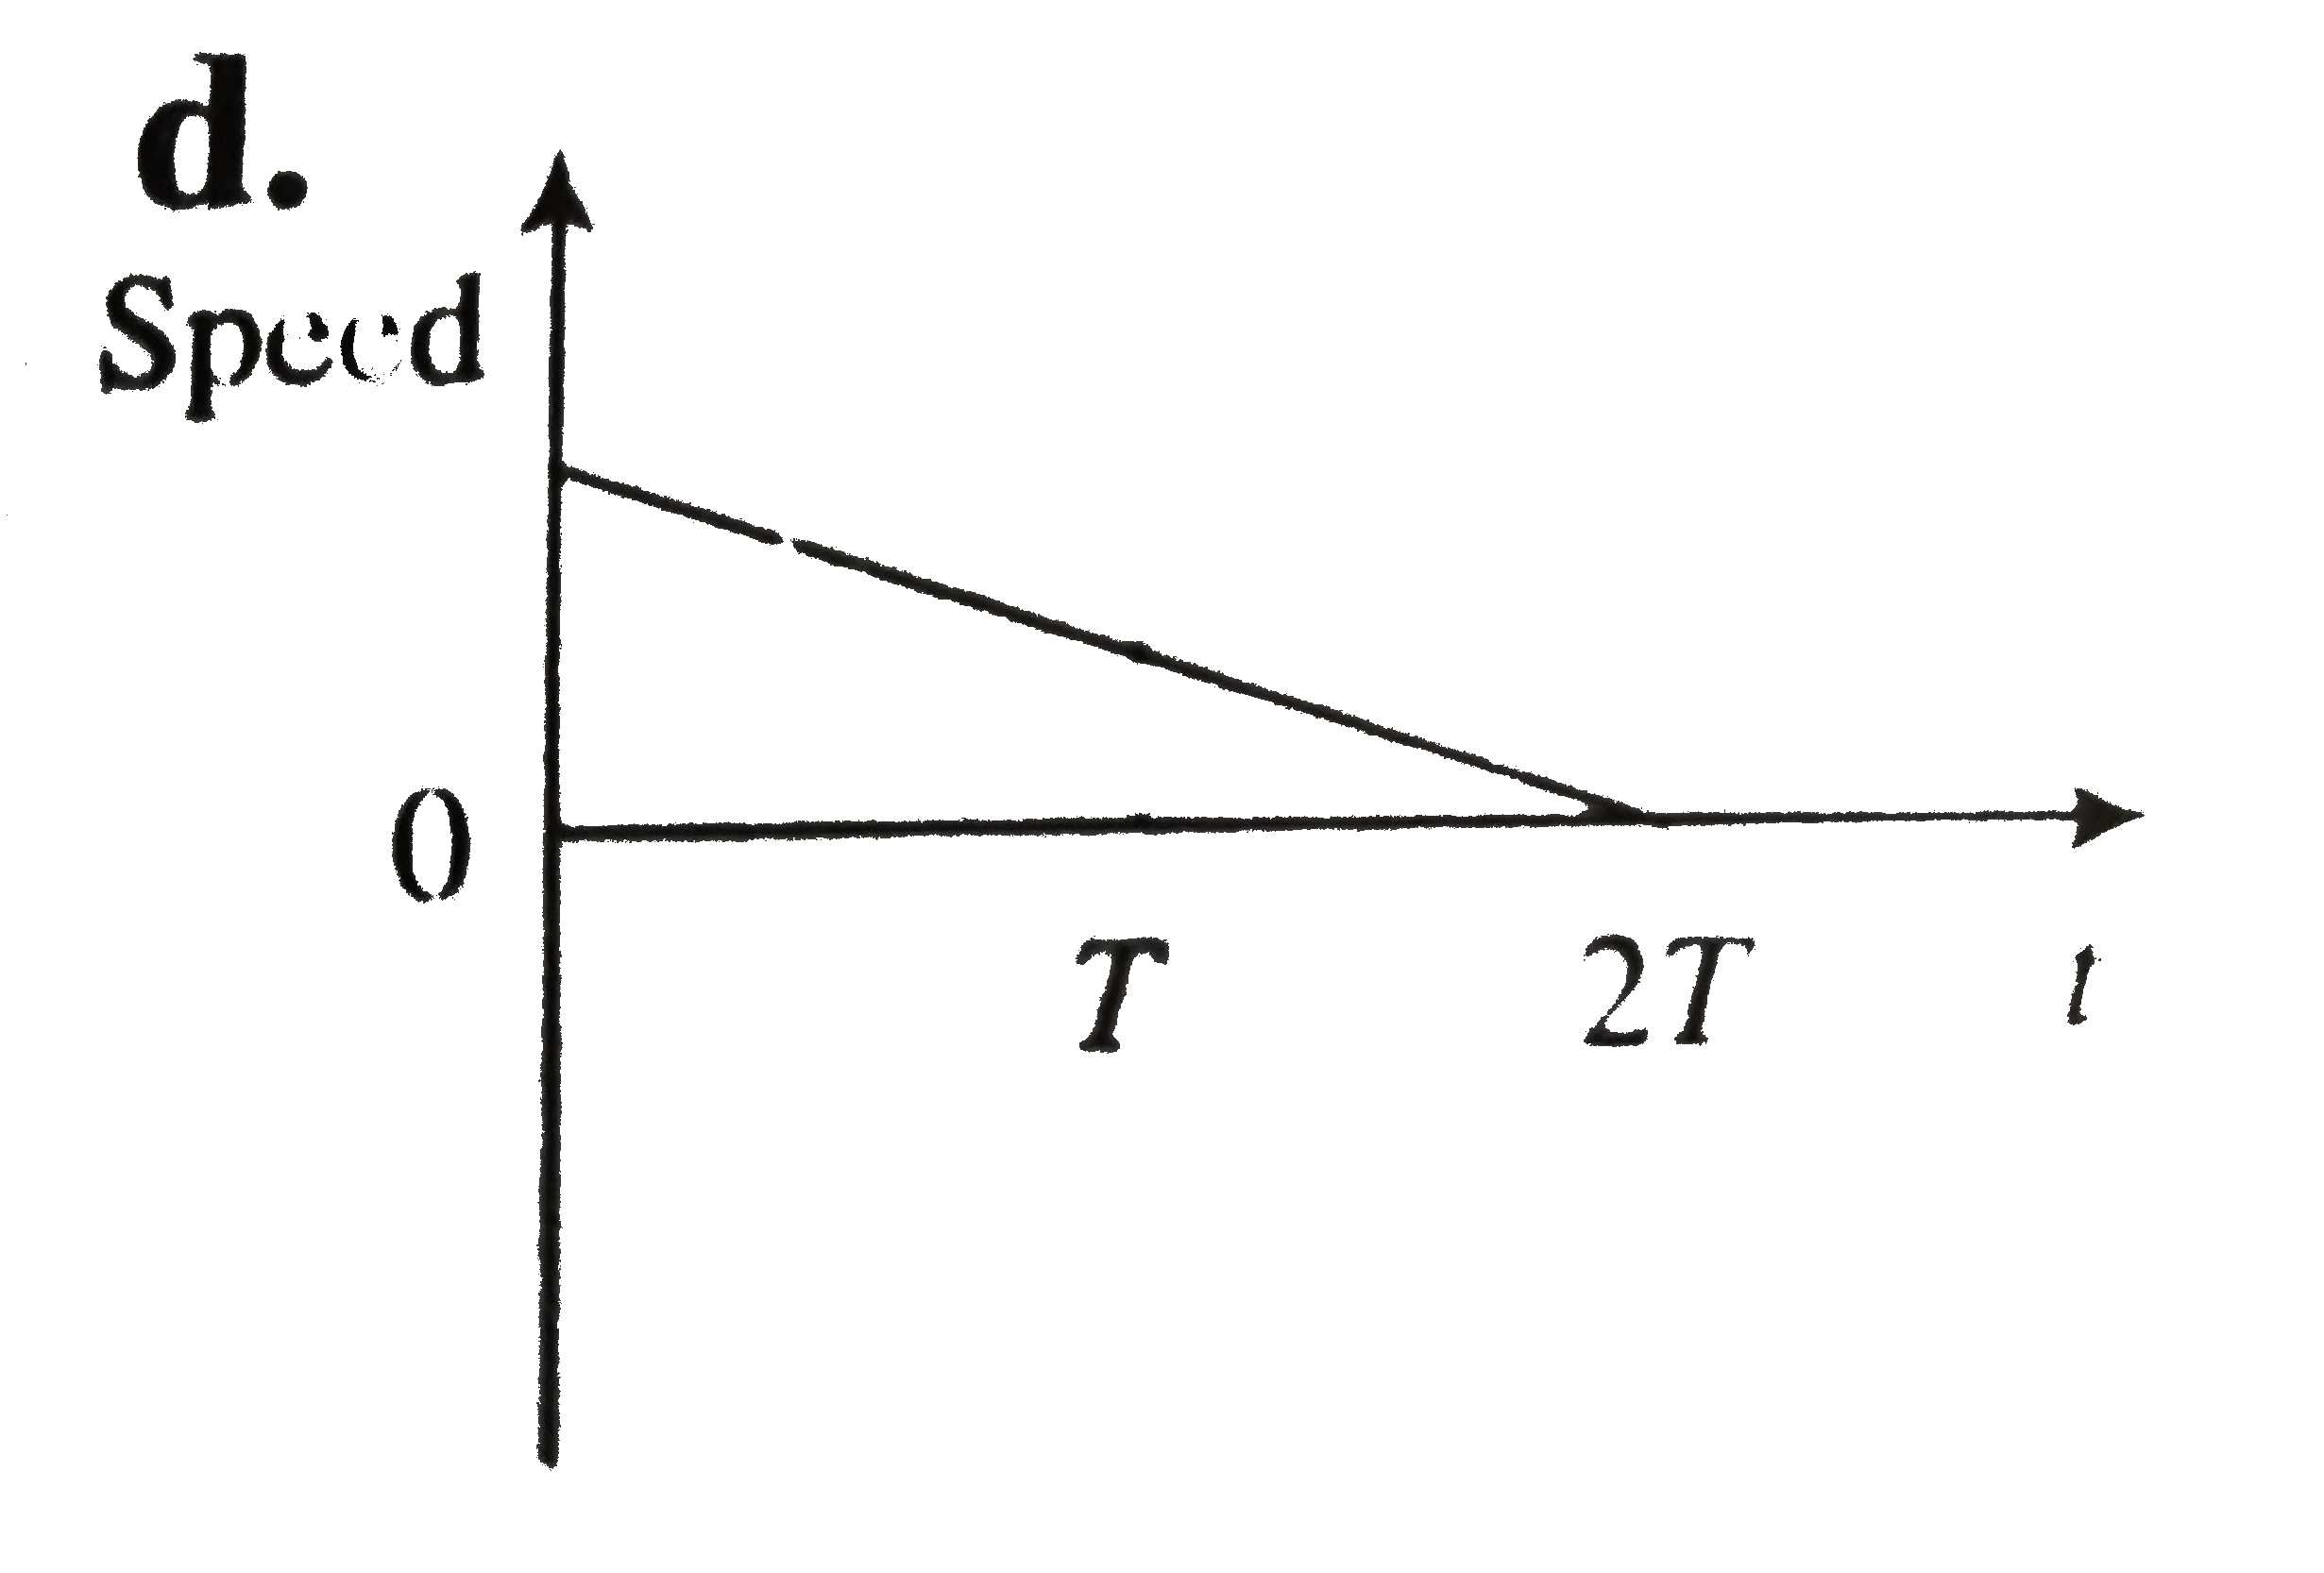
The x-t graph of a particle moving along a straight line is shown in figure

The v-t graph of the particle is correctly shown byA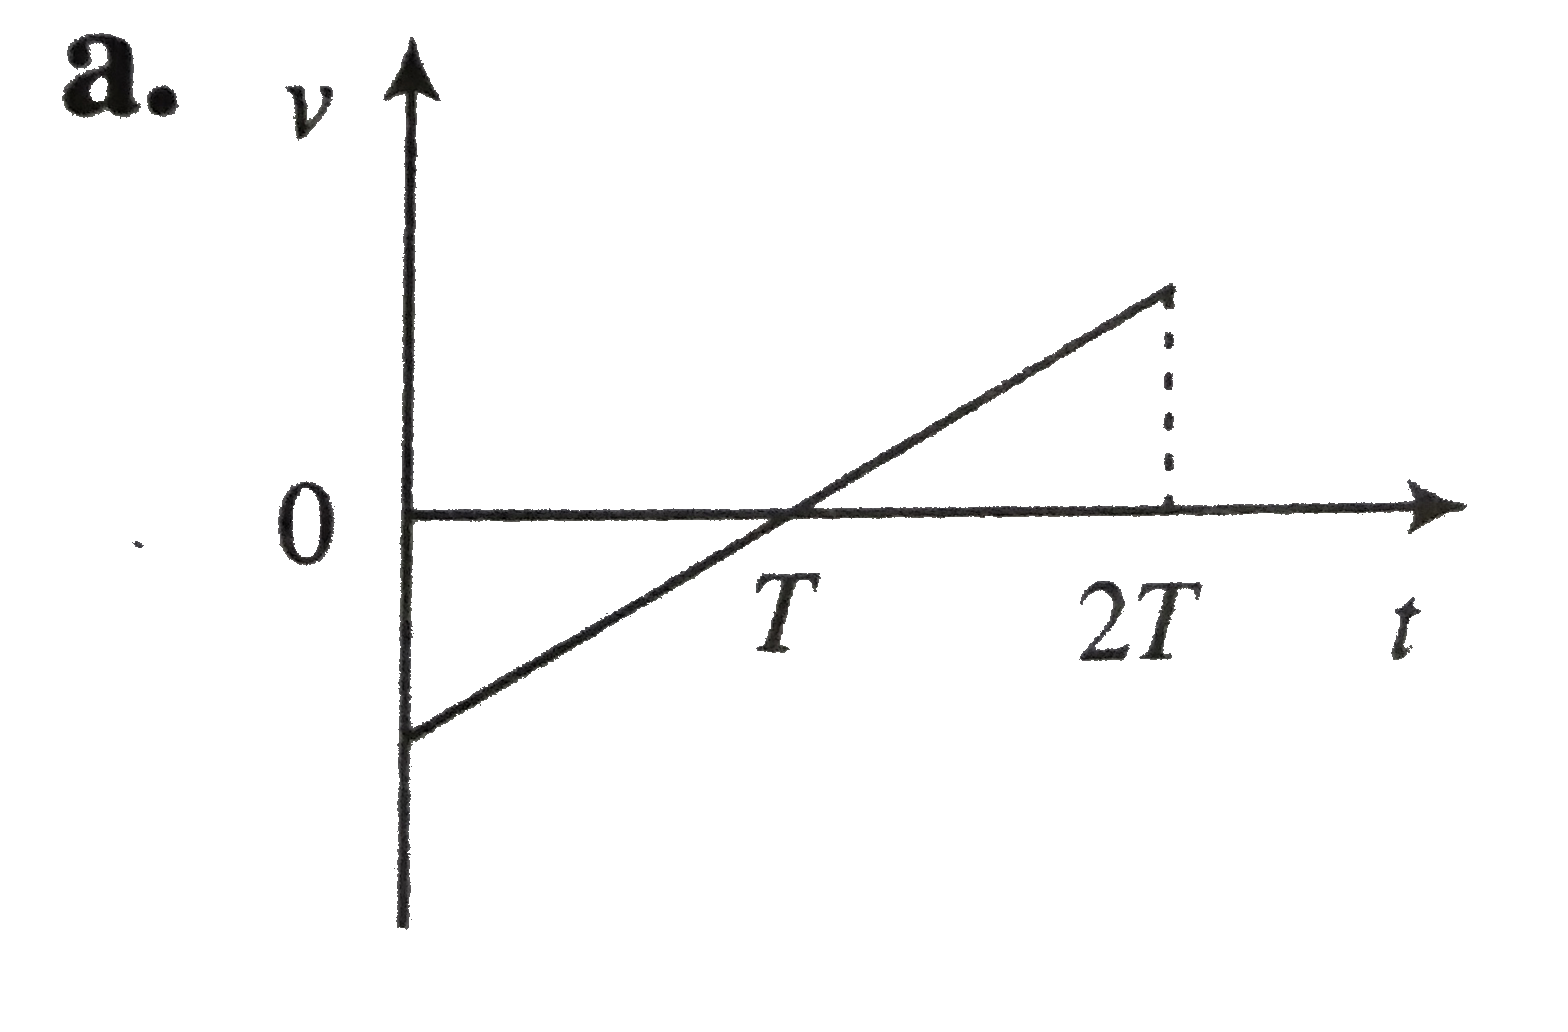 B
B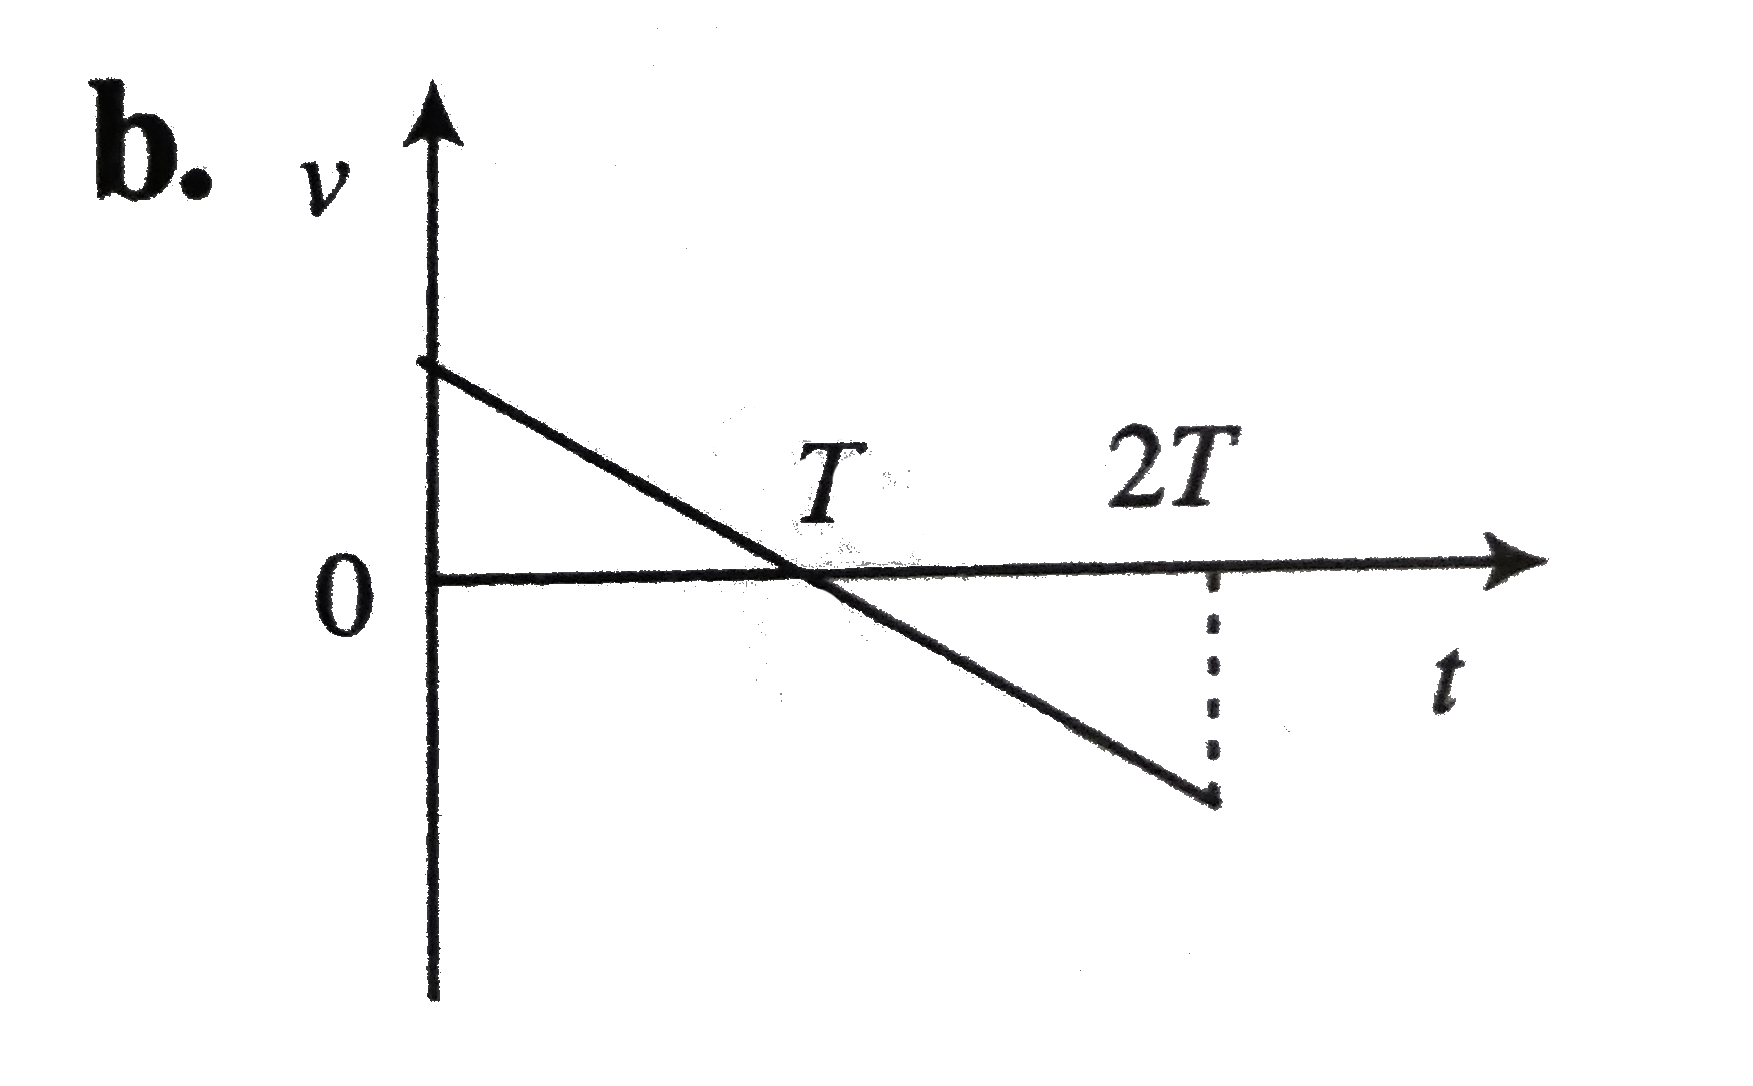 C
C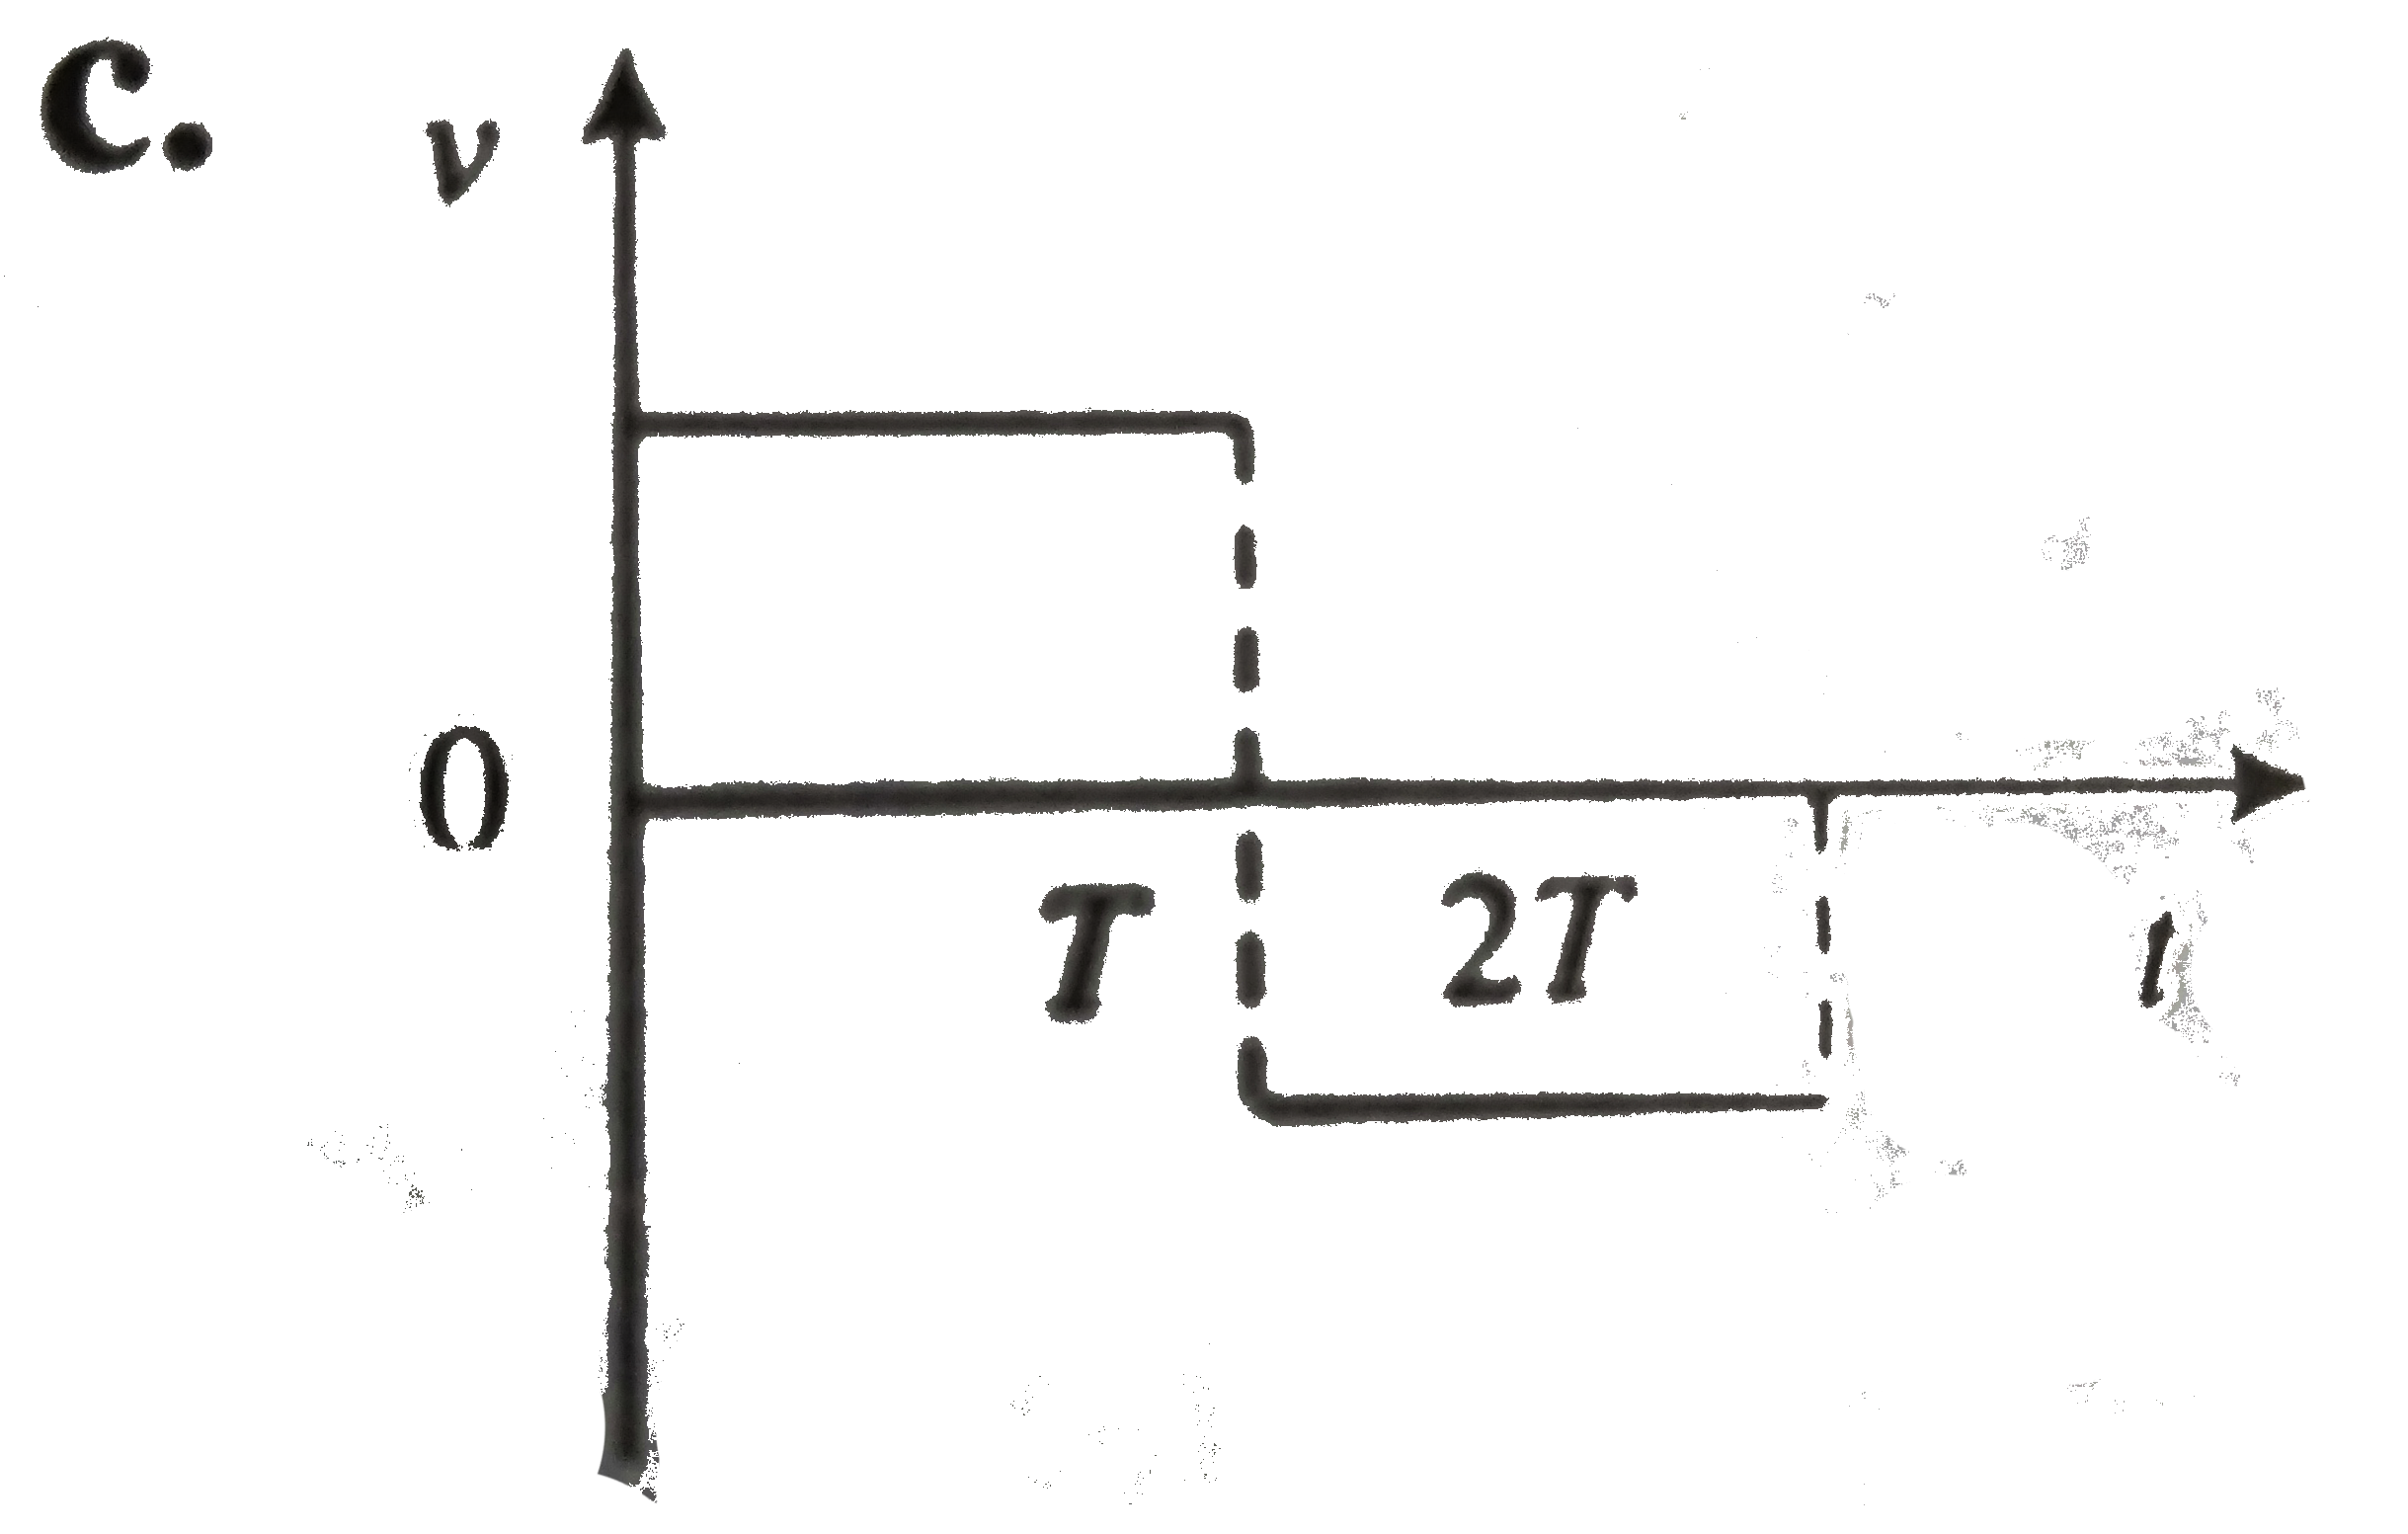 D
D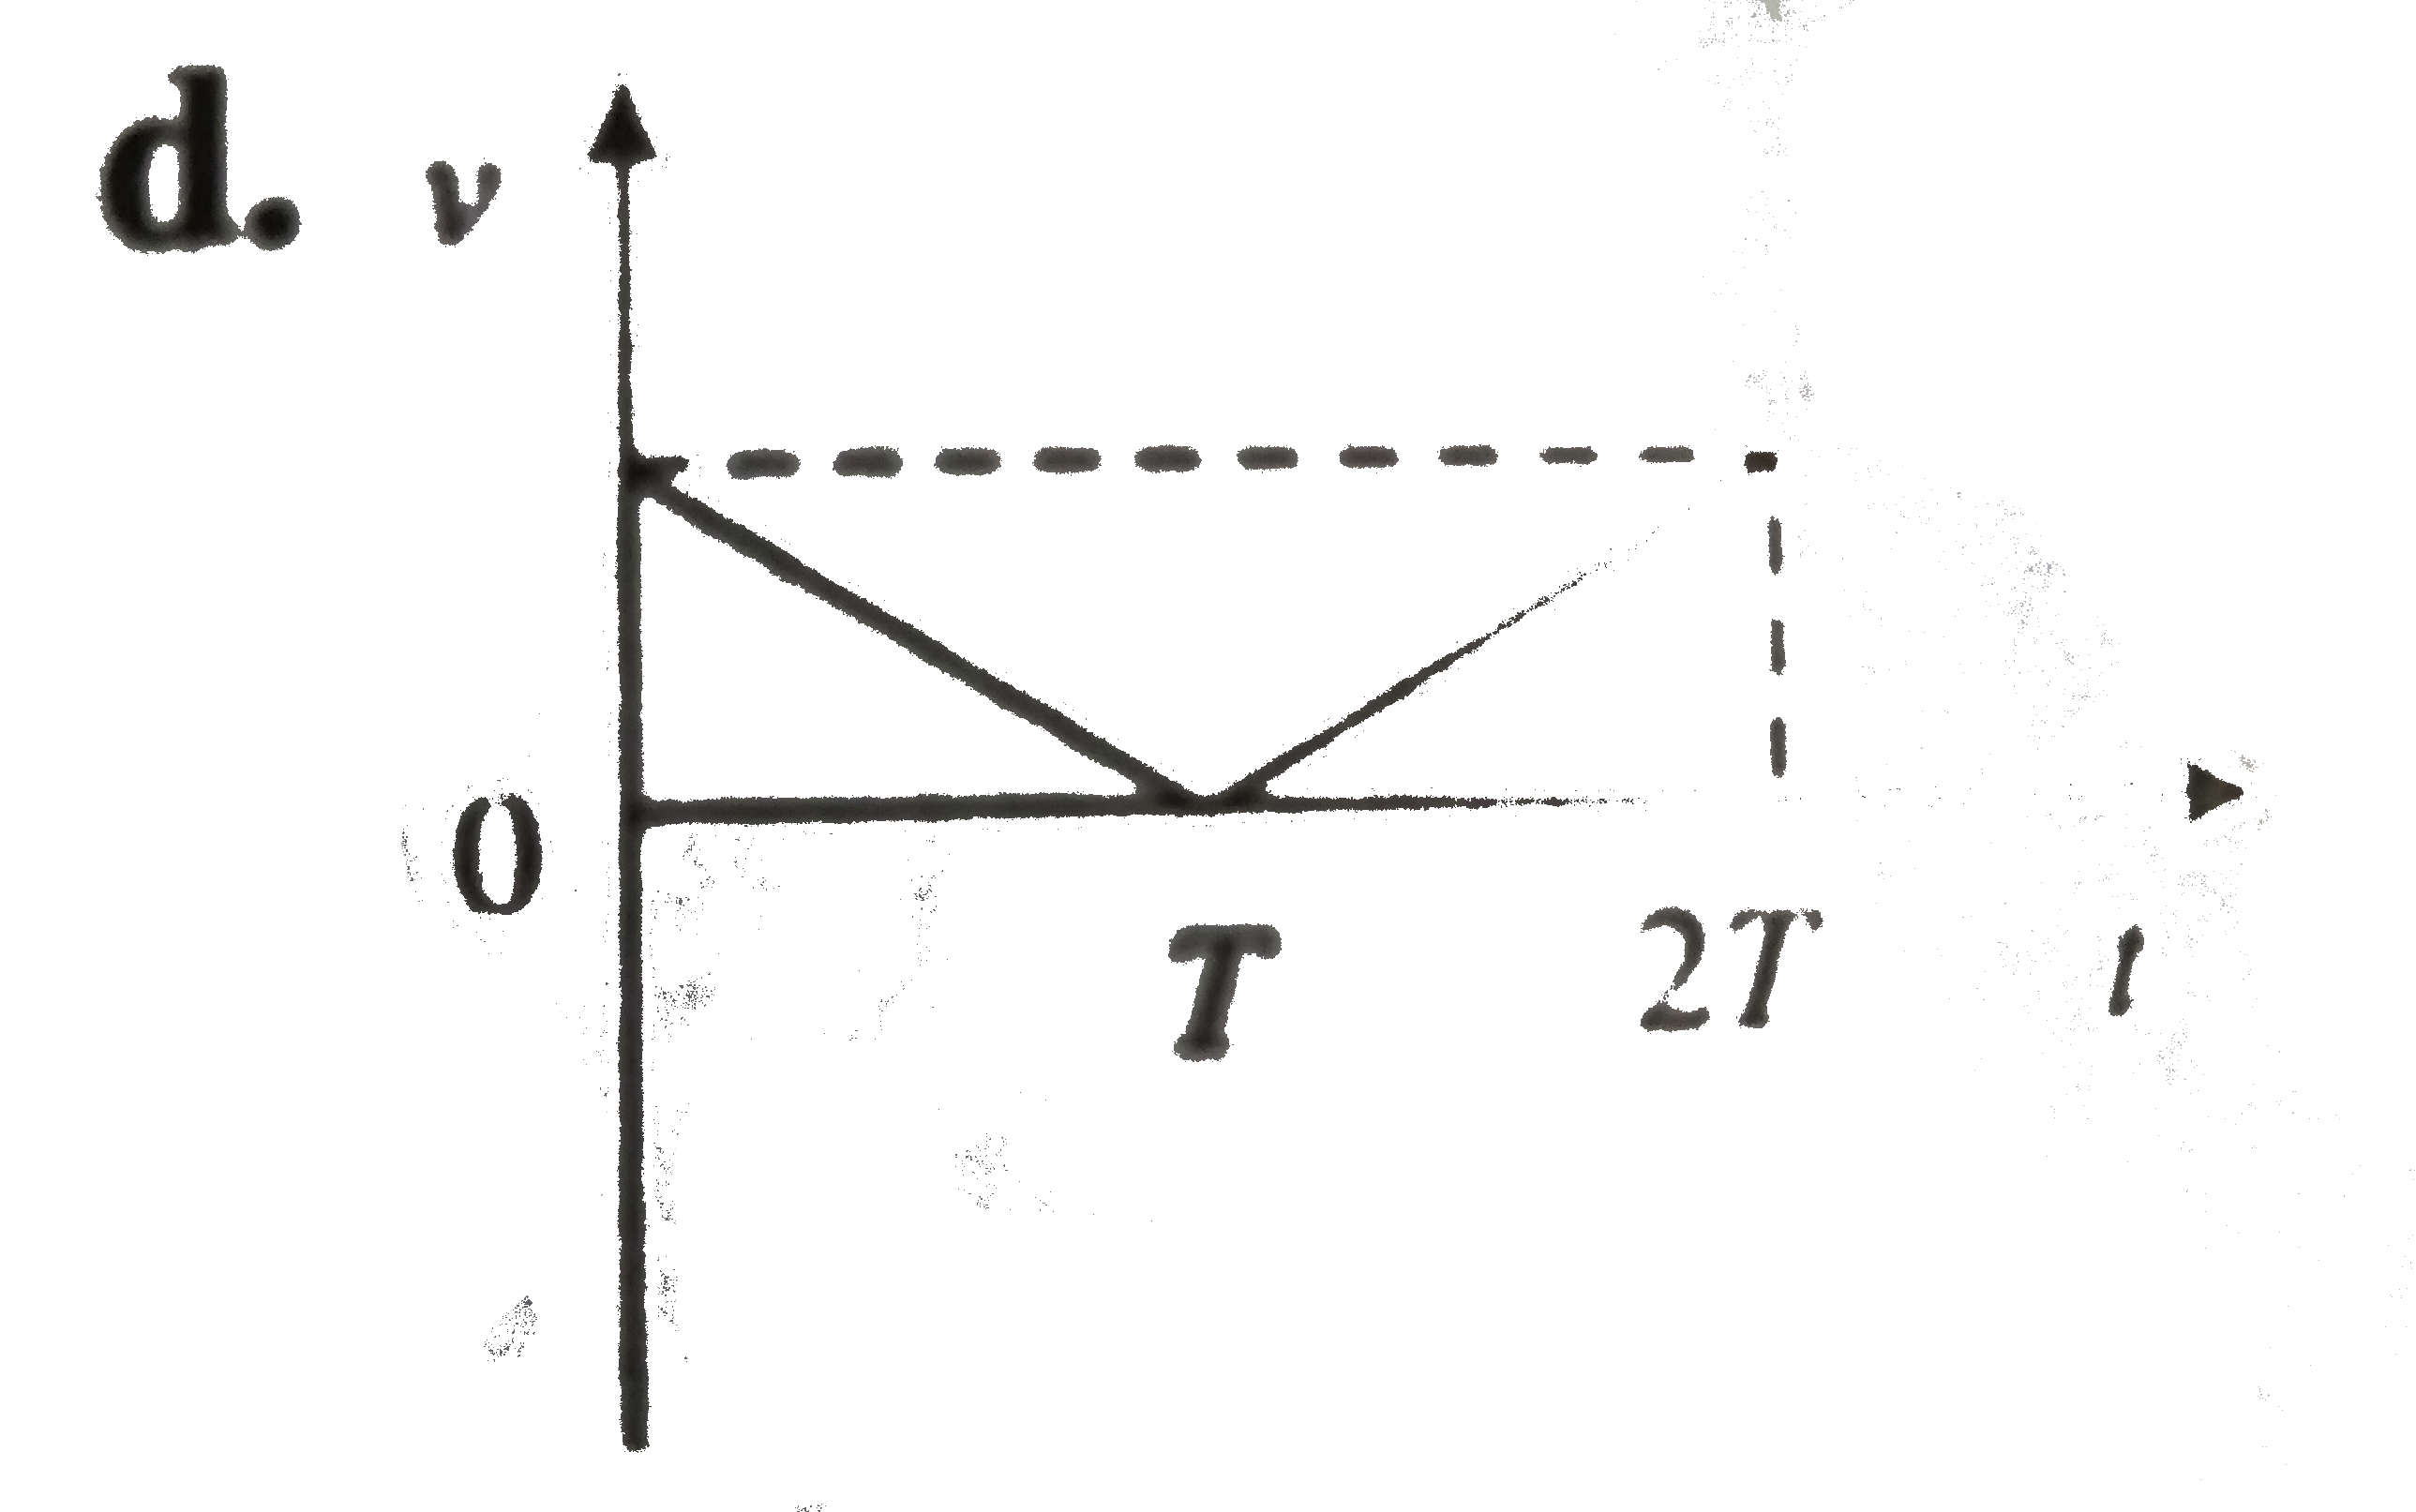
The x-t graph of a particle moving along a straight line is shown in figure

The v-t graph of the particle is correctly shown by
View SolutionDisplacement time graph of a particle moving in a straight line is a shown in figure.

View SolutionThe x−t graph of particle moving along a straight line is shown in figure
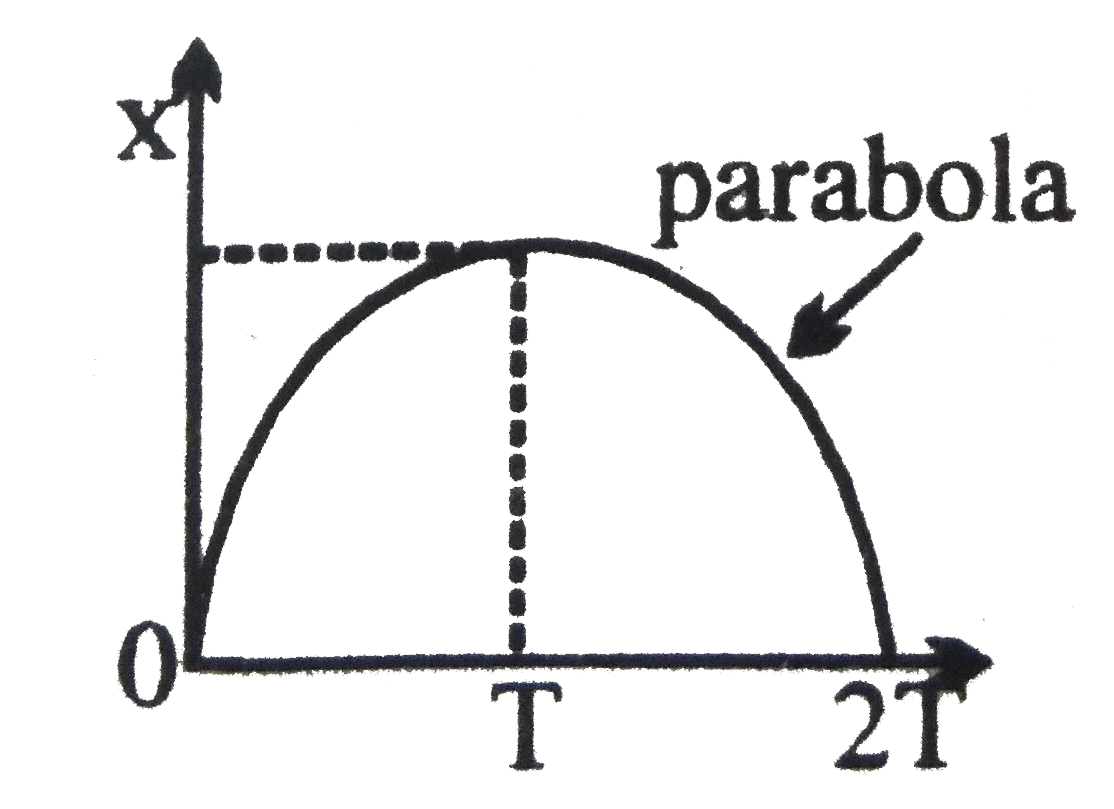
The speed-time graph of the particle si correctly shown by
View SolutionDisplacement time graph of a particle moving in a straight line is a shown in figure.

View SolutionThe x−t graph of particle moving along a straight line is shown in figure
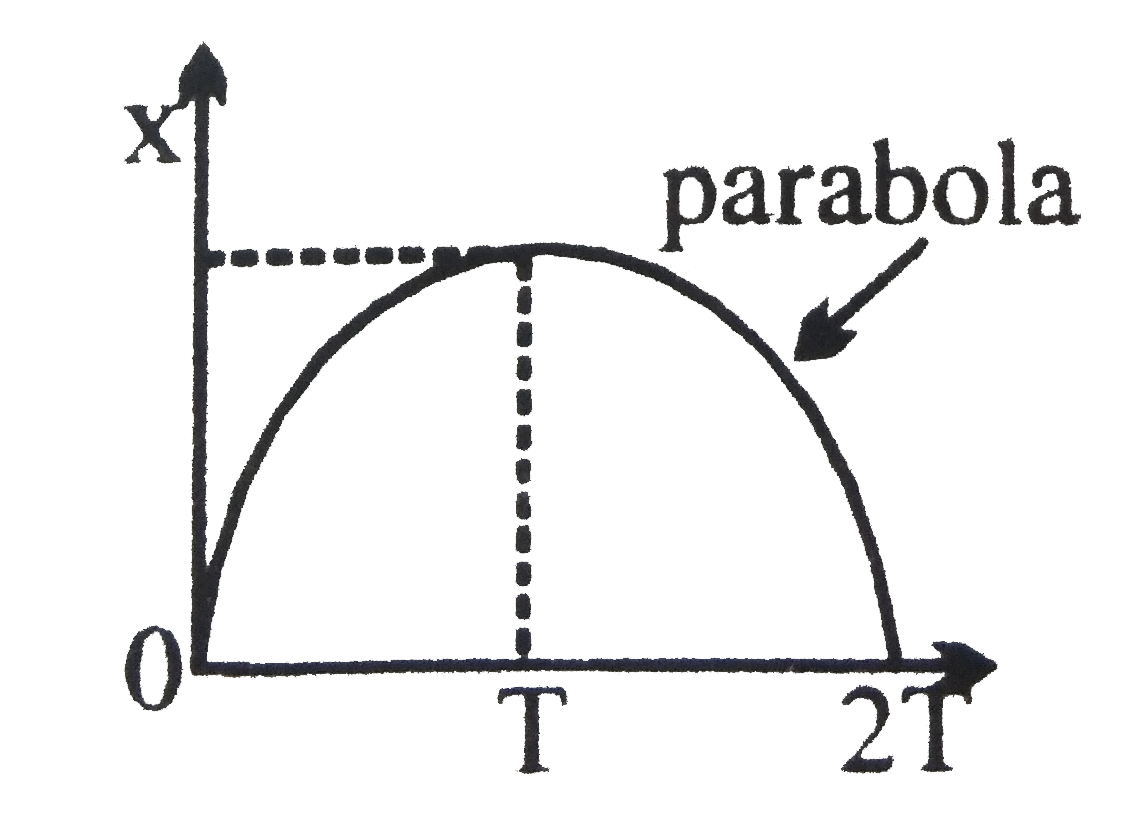
The v−t graph of the particles is correctly shown by
View Solution
