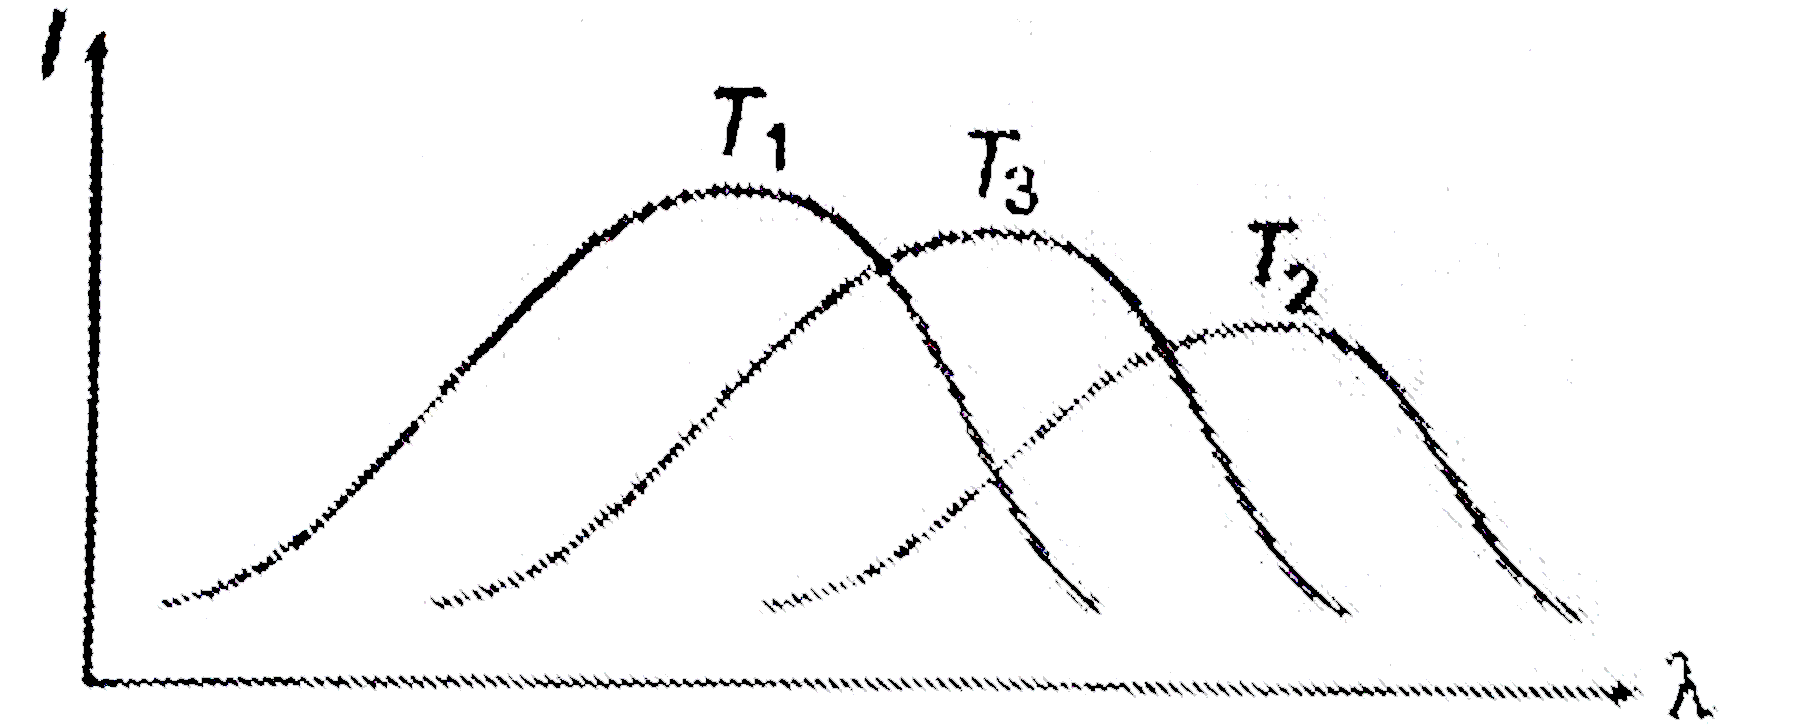
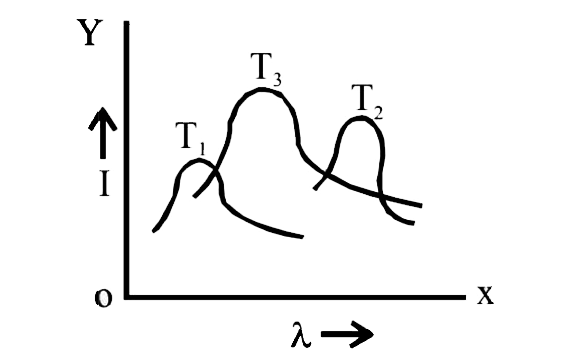
The plots of intensity of radiation versus wavelength of three black bodies at temperature T1,T2andT3 are shown. Then

T3>T2>T1
T1T2>T3
T2>T3>T1
T1>T3>T2
The correct Answer is:D
According to Wien.s law if λ is the wavelength at maximum intensity λT= constant
∴ Shorter the wavelength of the peak, greater the temperature for intensity vs λ graph.
(λmax is not maximum wavelength but λ at maximum intensity) T1>T3>T2
Topper's Solved these Questions
- PROPERTIES OF BULK MATTERBOOK - MTG GUIDECHAPTER - PROPERTIES OF BULK MATTEREXERCISE - Check Your Neet Vitals
22 Videos
- PROPERTIES OF BULK MATTERBOOK - MTG GUIDECHAPTER - PROPERTIES OF BULK MATTEREXERCISE - AIPMT/NEET (MCQs)
40 Videos
- PROPERTIES OF BULK MATTERBOOK - MTG GUIDECHAPTER - PROPERTIES OF BULK MATTEREXERCISE - AIPMT/NEET (MCQs)
40 Videos
- PHYSICAL WORLD AND MEASUREMENTBOOK - MTG GUIDECHAPTER - PHYSICAL WORLD AND MEASUREMENTEXERCISE - AIPMT / NEET MCQ
14 Videos
- THERMODYNAMICSBOOK - MTG GUIDECHAPTER - THERMODYNAMICSEXERCISE - AIPMT/NEET (MCQs)
26 Videos
Similar Questions
The plots of intensity of radiation versus wavelength of 3 black bodies of temperatures T1,T2 and T3 as shown in the figure, then
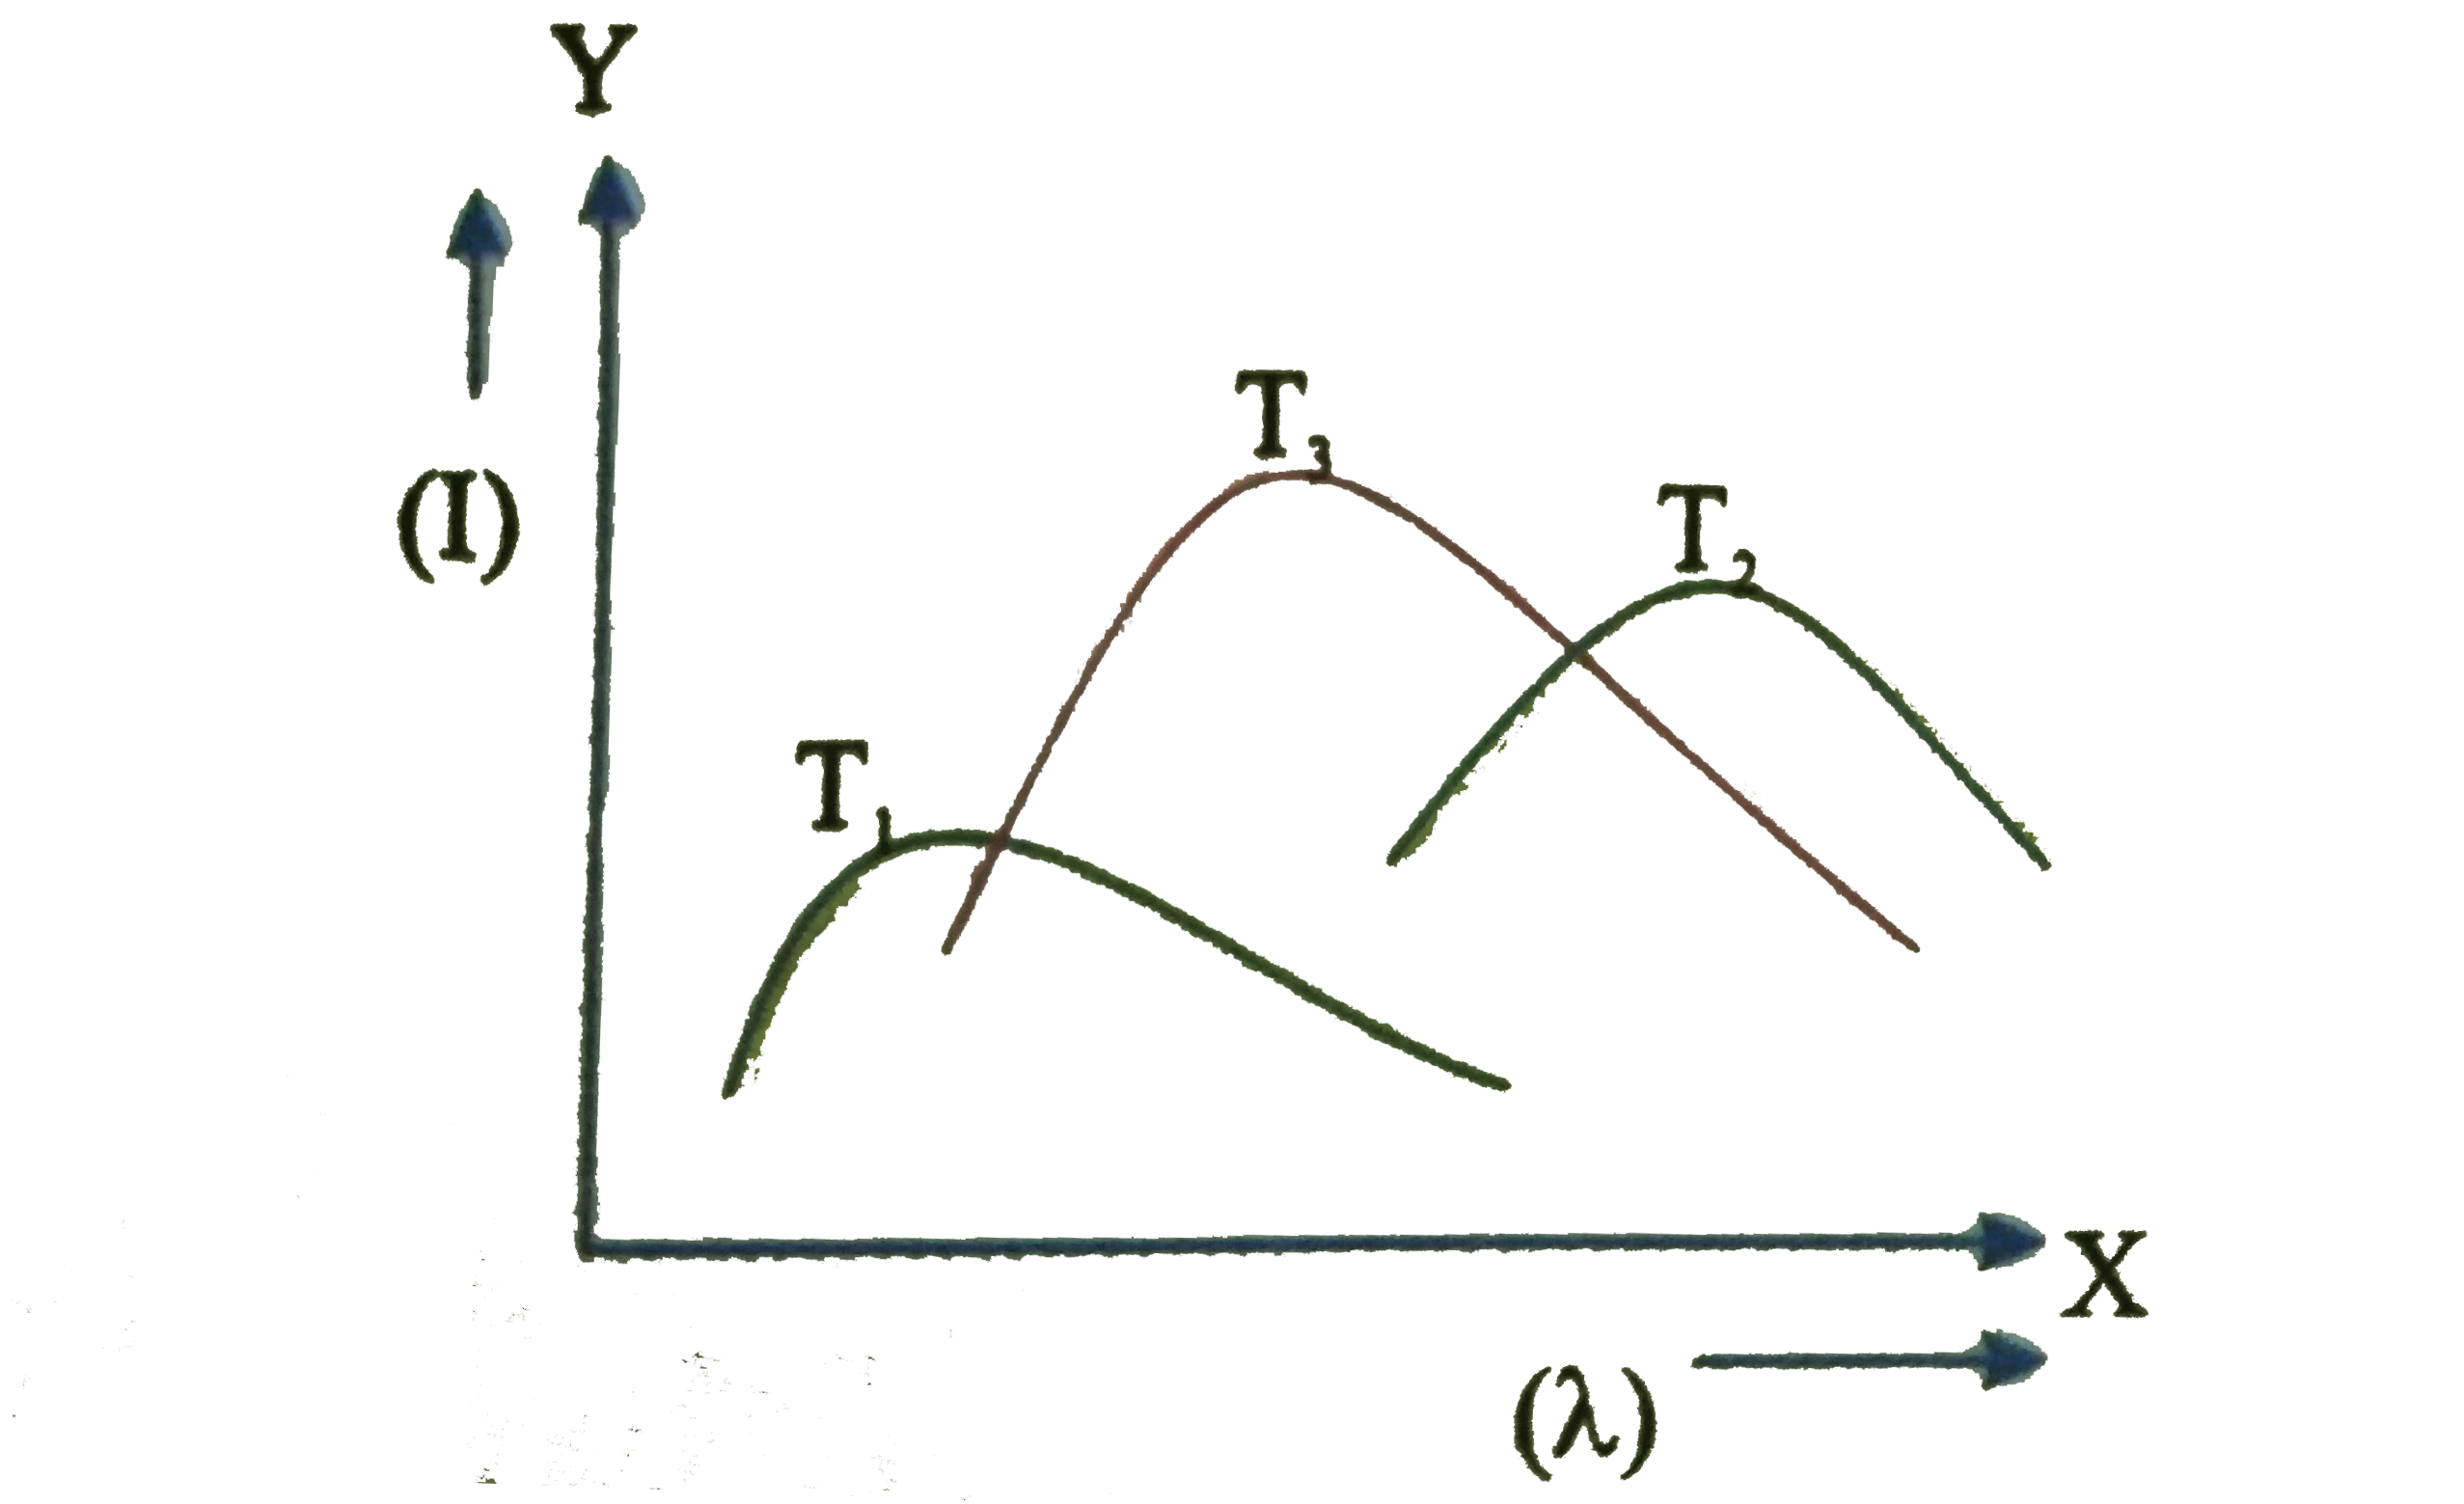
View SolutionThe plots of intensity versus wavelength for three black bodies at temperatures T1,T2 and T3 respectively are shown in Their temperatures are shown in How their temperatures are related ?
 .
.
View Solution
Knowledge Check
The plots of intensity (I) of radiation versus wavelength (γ) of thee black bodies at temperatures T1,T2 and T3 are shown in Fig.7(CF).25. Then,
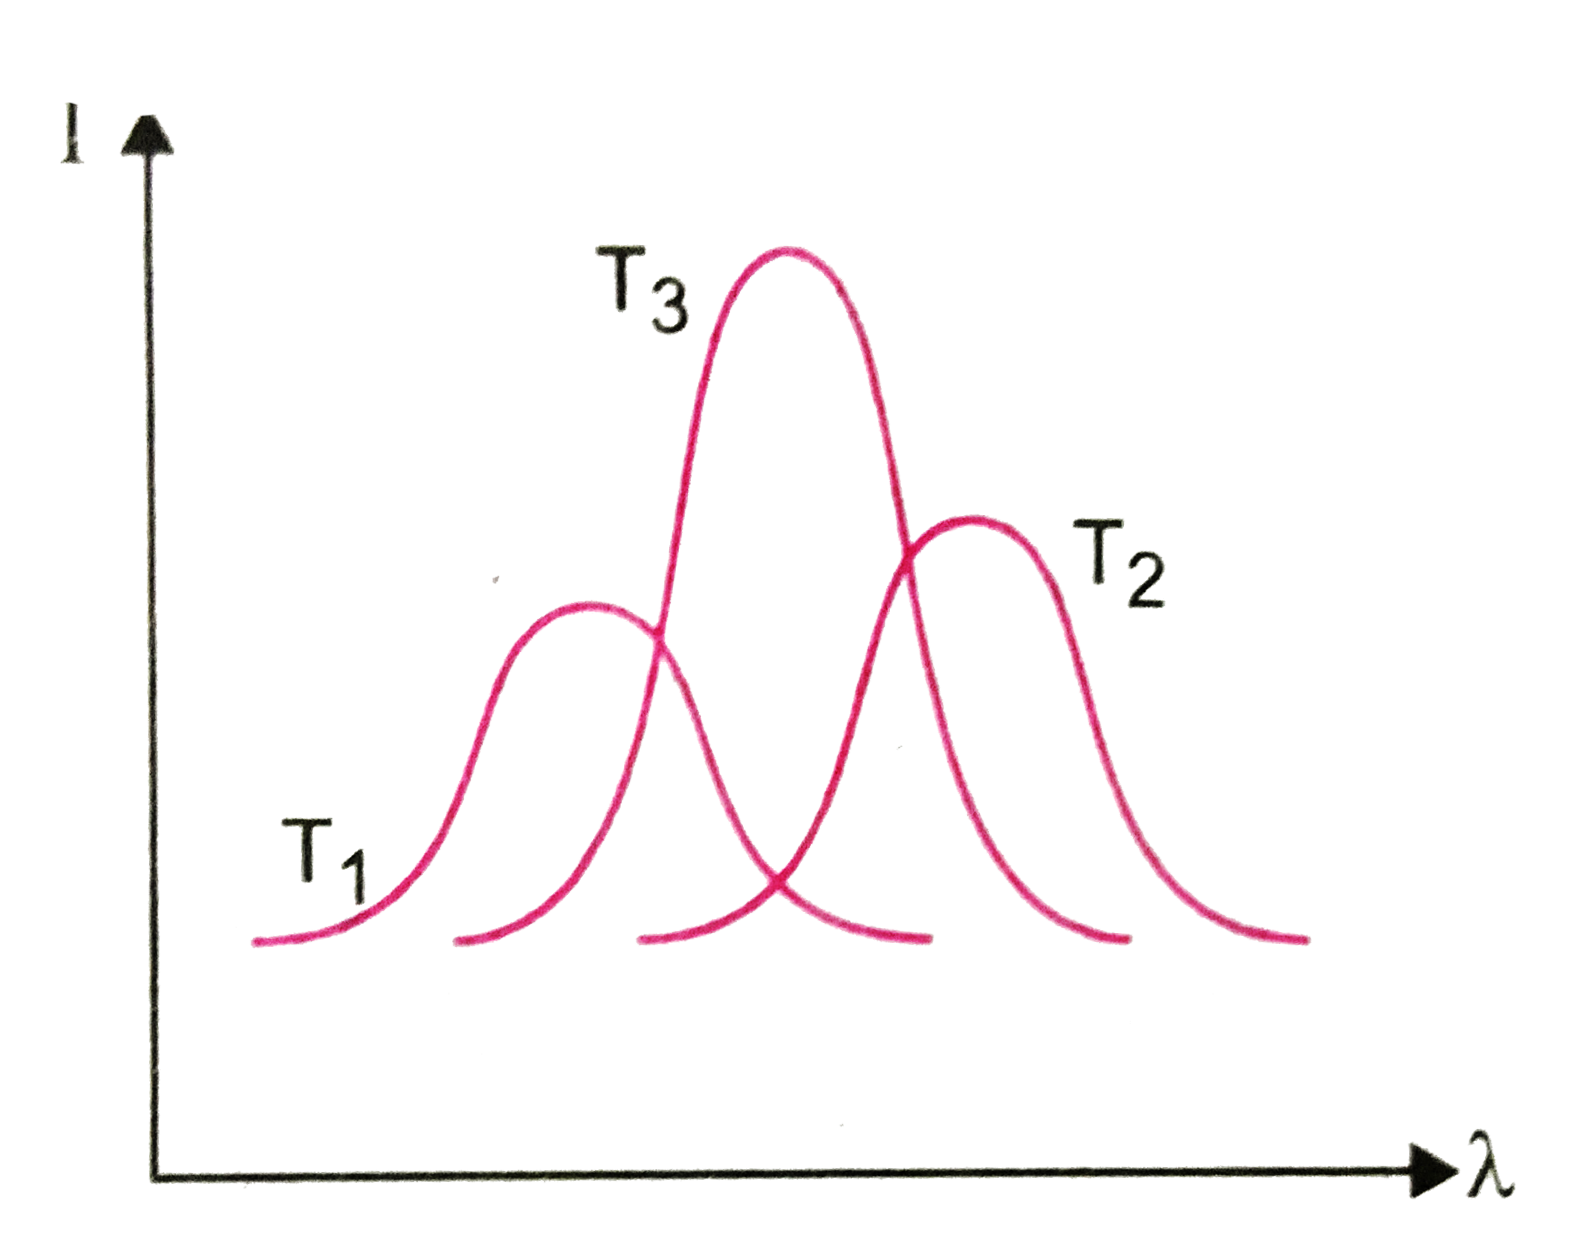 AT3>T2>T1BT1>T2>T3CT2>T3>T1DT1>T3>T2
The plots of intensity versus wavelength fro three black bodies at temperatures T1,T2 and T3 respectively and shown in Fig. 15.11.1. Their temperatures are such that
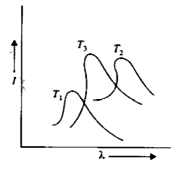 AT1>T2>T3BT1>T3>T2CT2>T3>T1DT3>T2>T1
The plots of intensity versus wavelength for three black bodies at temperature T1,T2andT3 respectively are as shown. Their temperatures are such that
 AT1>T2>T3BT1>T3>T2CT2>T3>T1DT3>T2>T1
The plots of intensity versus wavelength for three black bodies at temperatures T1,T2 and T3 respectively are shown in Their temperatures are shown in How their temperatures are related ?
 .
.
View SolutionThe plots of intensity versus wavelength for three black bodies at temperature T1,T2andT3 respectively are as shown. Their temperatures are such that

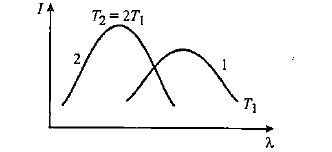
View SolutionThe plots of intensity vs wavelength for two black bodies at temperature T1 and T2 such that T2=2T1, respectively are as shown. Let the energy radiated per second by body I and body 2 be E1 and E2 respectively. Pick up the correct statement(s).
View SolutionThe plots of intensity v/s wavelength for three at temperatures T1,T2 & T3 respectively. Their temperatures are such that (Decreasing order)

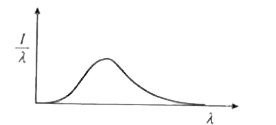
View SolutionThe graph shows the variation in radiation intensity per unit wavelength versus wavelength for a perfect black- body at temperature T. Complete the following statement: As the blackbody temperature is increased, the peak in intensity of this curve
View Solution
