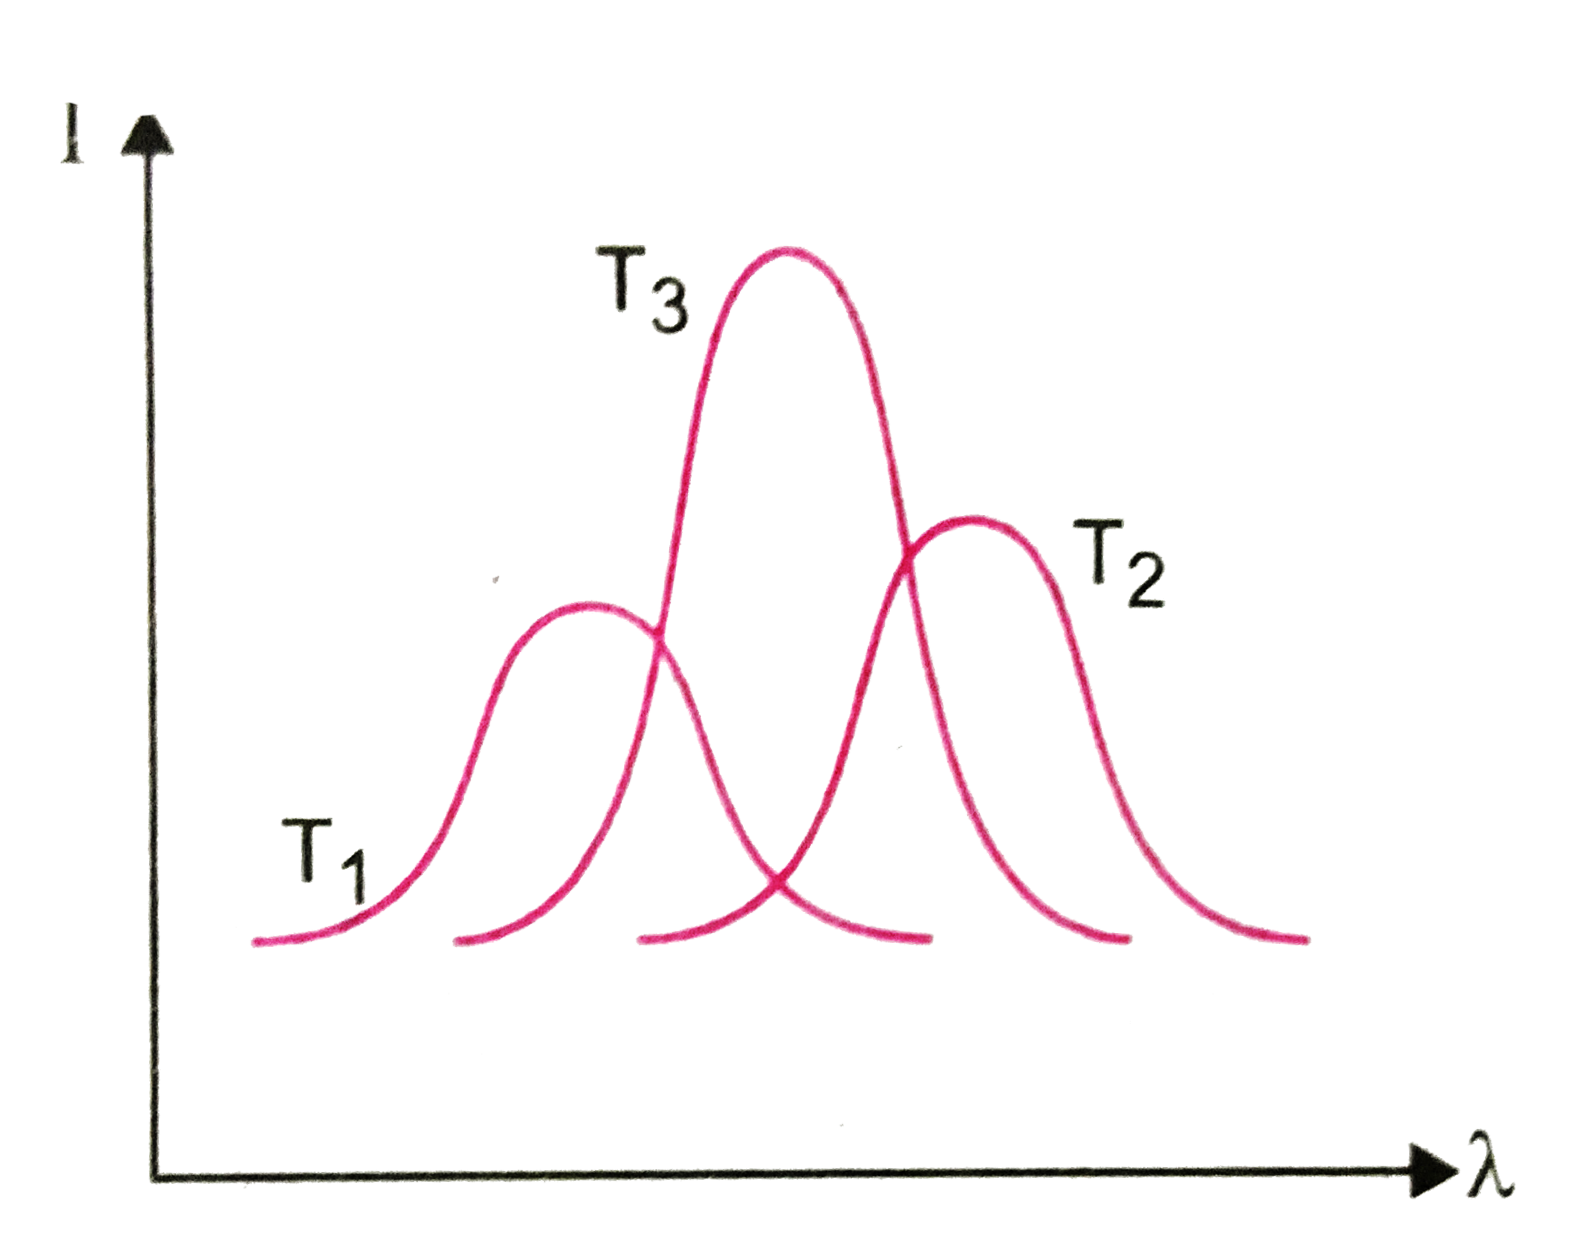
The plots of intensity versus wavelength for three black bodies at temperatures T1,T2 and T3 respectively are shown in Their temperatures are shown in How their temperatures are related ?
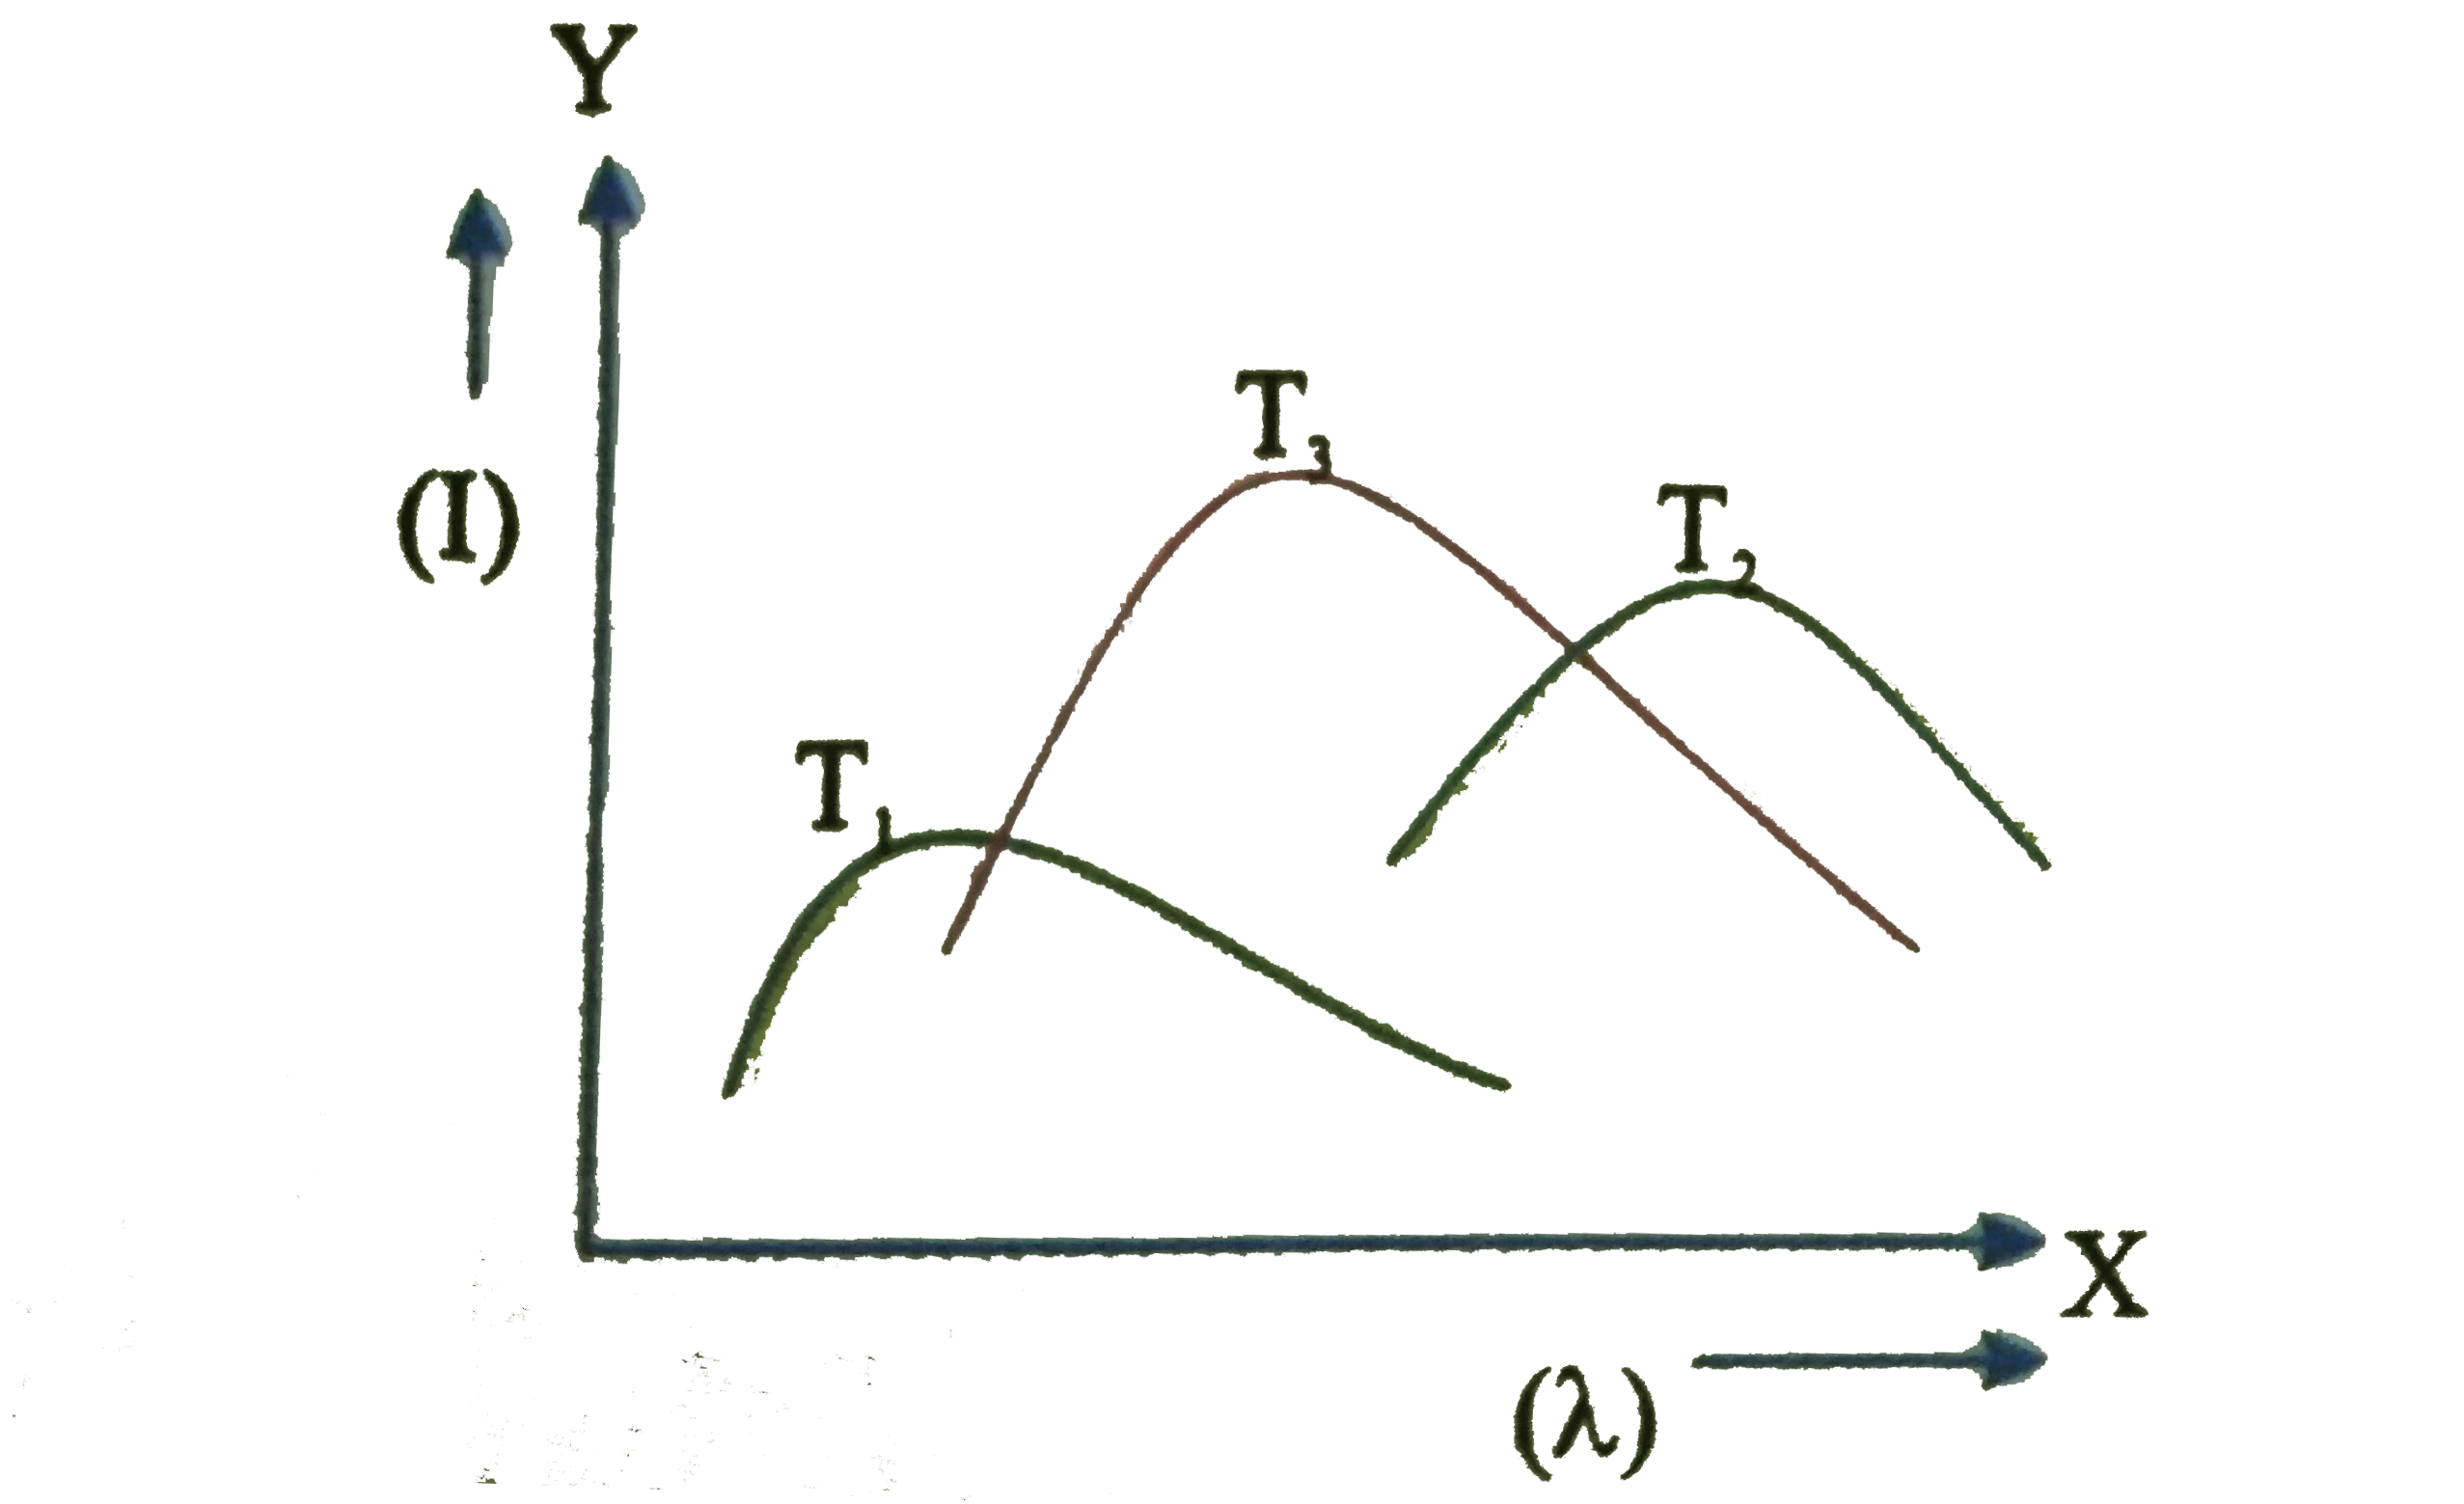 .
.
T1>T2>T3
T1>T3>T2
T2>T3>T1
T3>T2>T1
Step by step video & image solution for The plots of intensity versus wavelength for three black bodies at temperatures T_(1),T_(2) and T_(3) respectively are shown in Their temperatures are shown in How their temperatures are related ? . by Physics experts to help you in doubts & scoring excellent marks in Class 11 exams.
Updated on:21/07/2023Topper's Solved these Questions
Similar Questions
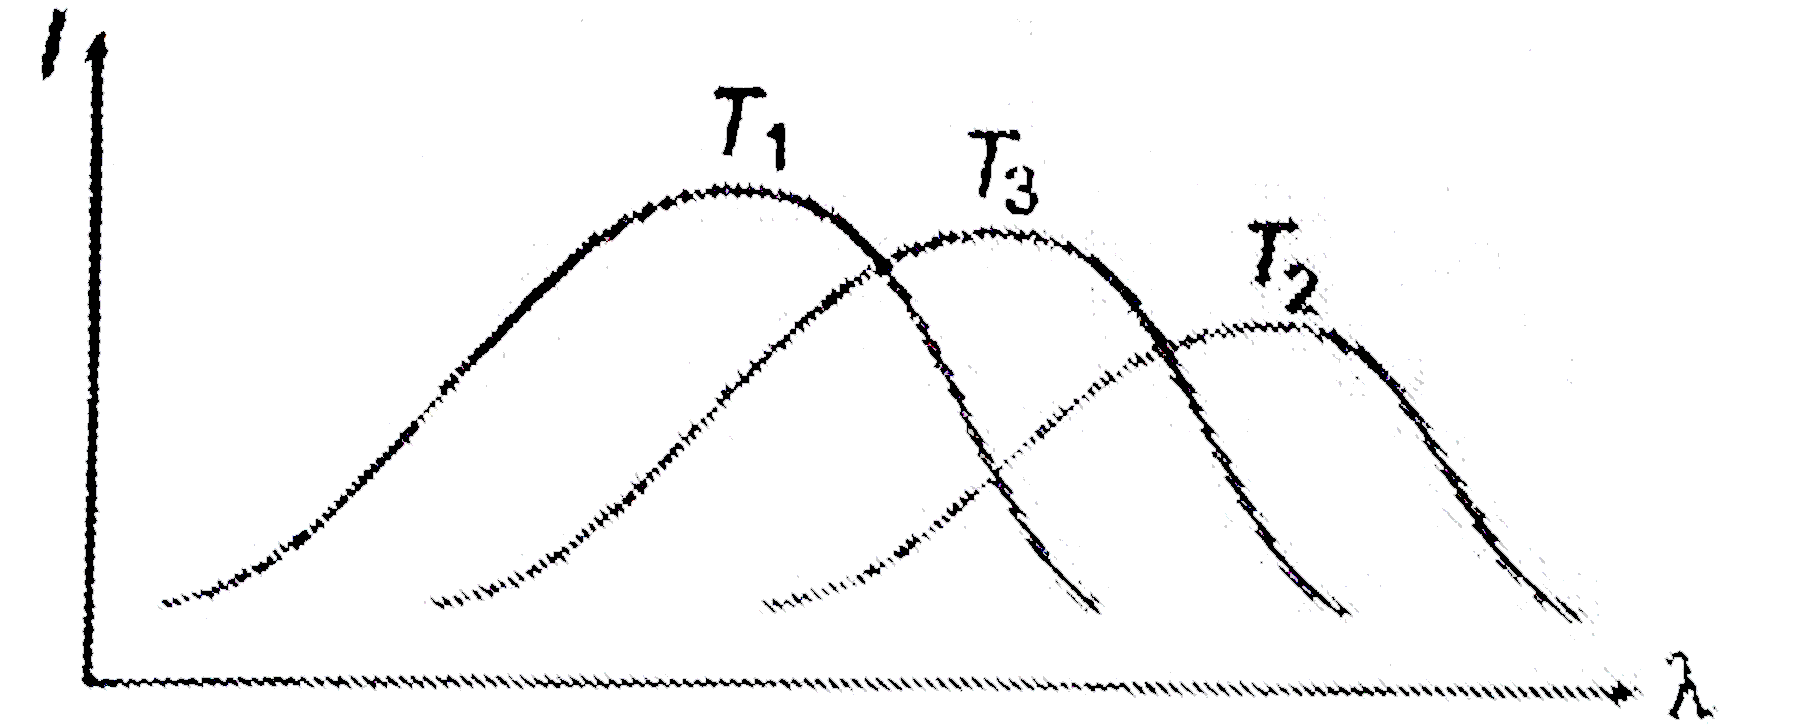
The plots of intensity of radiation versus wavelength of 3 black bodies of temperatures T1,T2 and T3 as shown in the figure, then
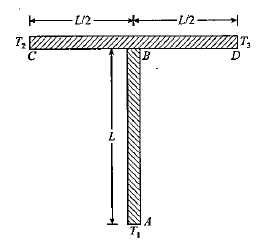
View SolutionTwo identical rods AB and CD, each of length L are connected as shown in figure-4.22. Their cross-sectional area is A and their thermal conductivity is k. Ends A, C and D are maintained at temperatures T1,T2andT3 respectively. Neglecting heat loss to the surroundings, find the temperature at B.
View Solution
Knowledge Check
The plots of intensity versus wavelength for three black bodies at temperature T1,T2andT3 respectively are as shown. Their temperatures are such that
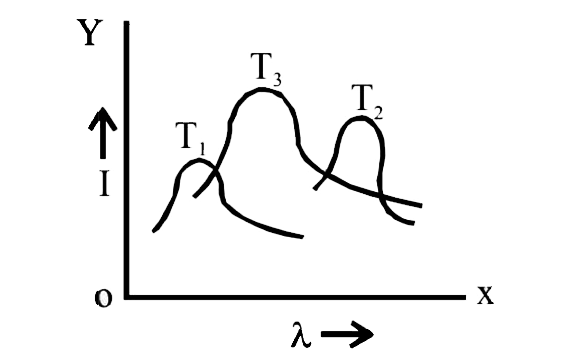 AT1>T2>T3BT1>T3>T2CT2>T3>T1DT3>T2>T1
The plots of intensity v/s wavelength for three at temperatures T1,T2 & T3 respectively. Their temperatures are such that (Decreasing order)
 AT1,T2,T3BT3,T1,T2CT2,T1,T3DT3,T2,T1
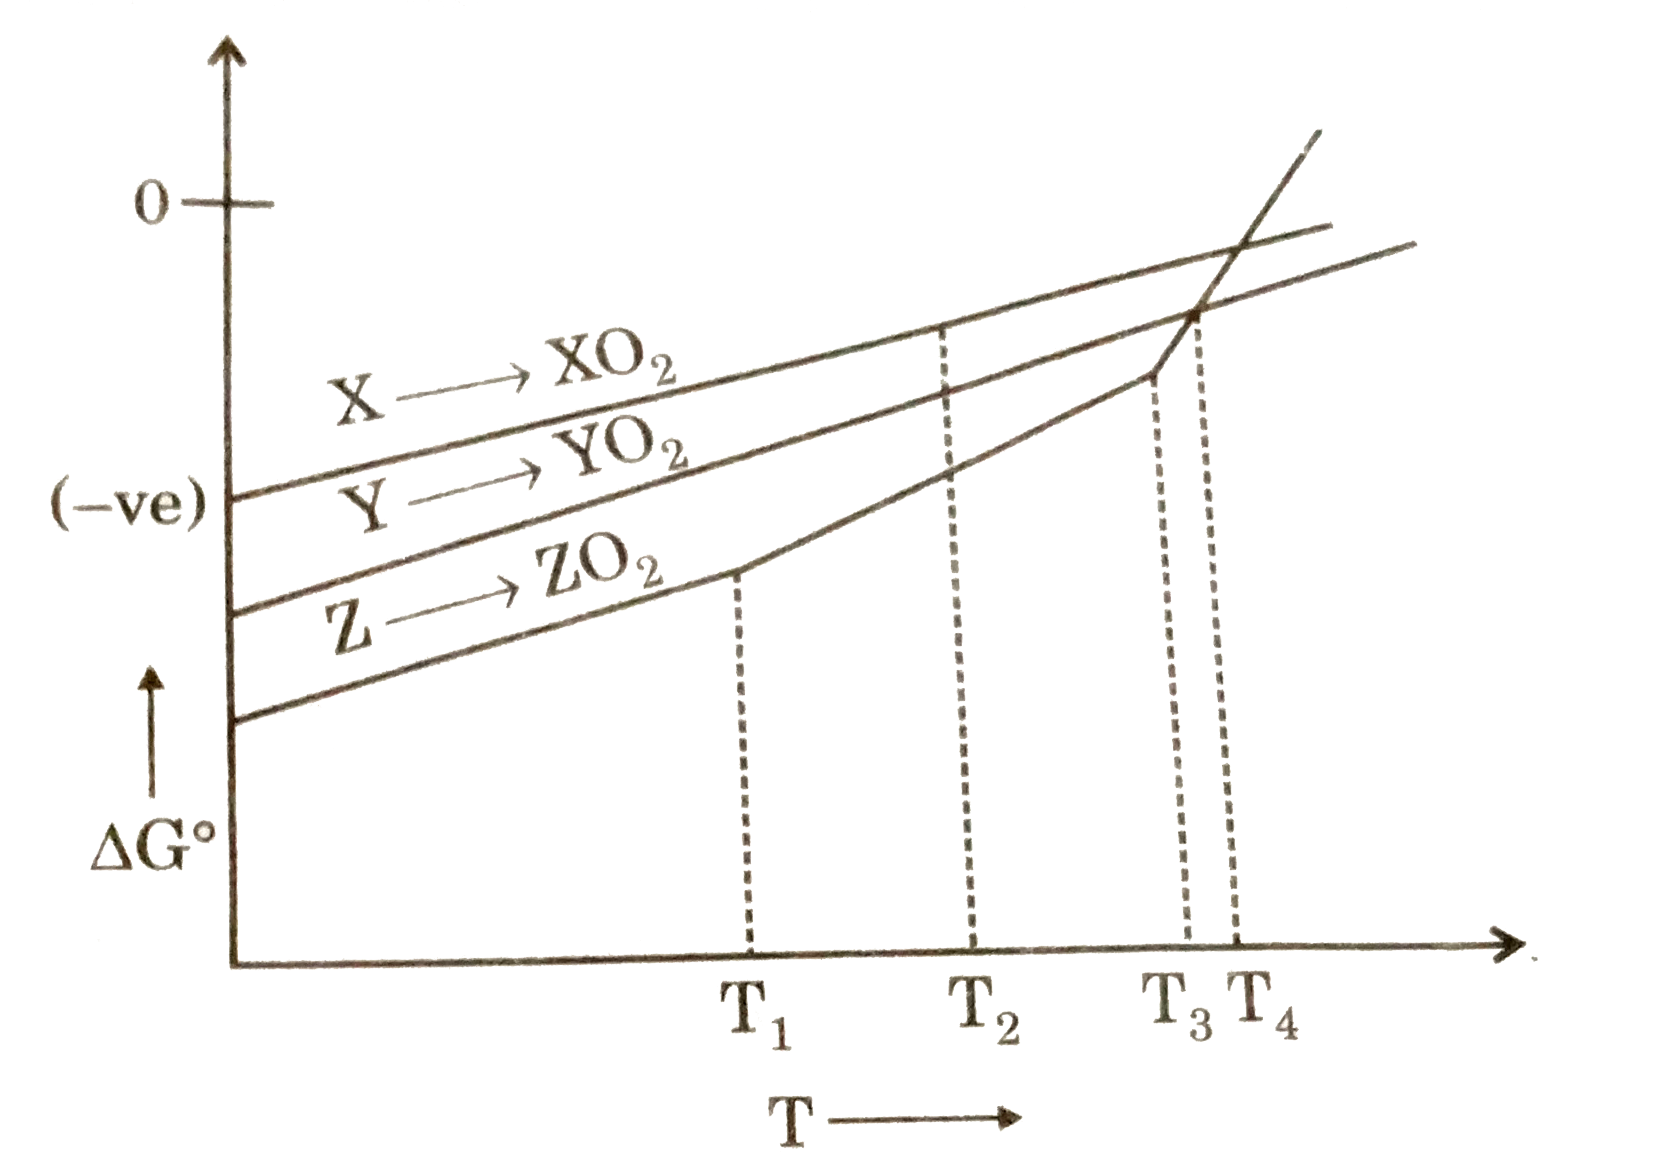
Temperature T1andT3 represents respectively:Amelting point and boiling point of ZBmelting point and boiling point of ZO2Cmelting point of Z and ZO2Dboiling point of Z and ZO2
The plots of intensity (I) of radiation versus wavelength (γ) of thee black bodies at temperatures T1,T2 and T3 are shown in Fig.7(CF).25. Then,
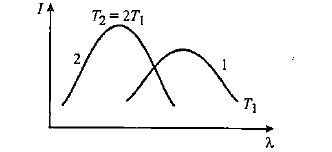
View SolutionThe plots of intensity vs wavelength for two black bodies at temperature T1 and T2 such that T2=2T1, respectively are as shown. Let the energy radiated per second by body I and body 2 be E1 and E2 respectively. Pick up the correct statement(s).
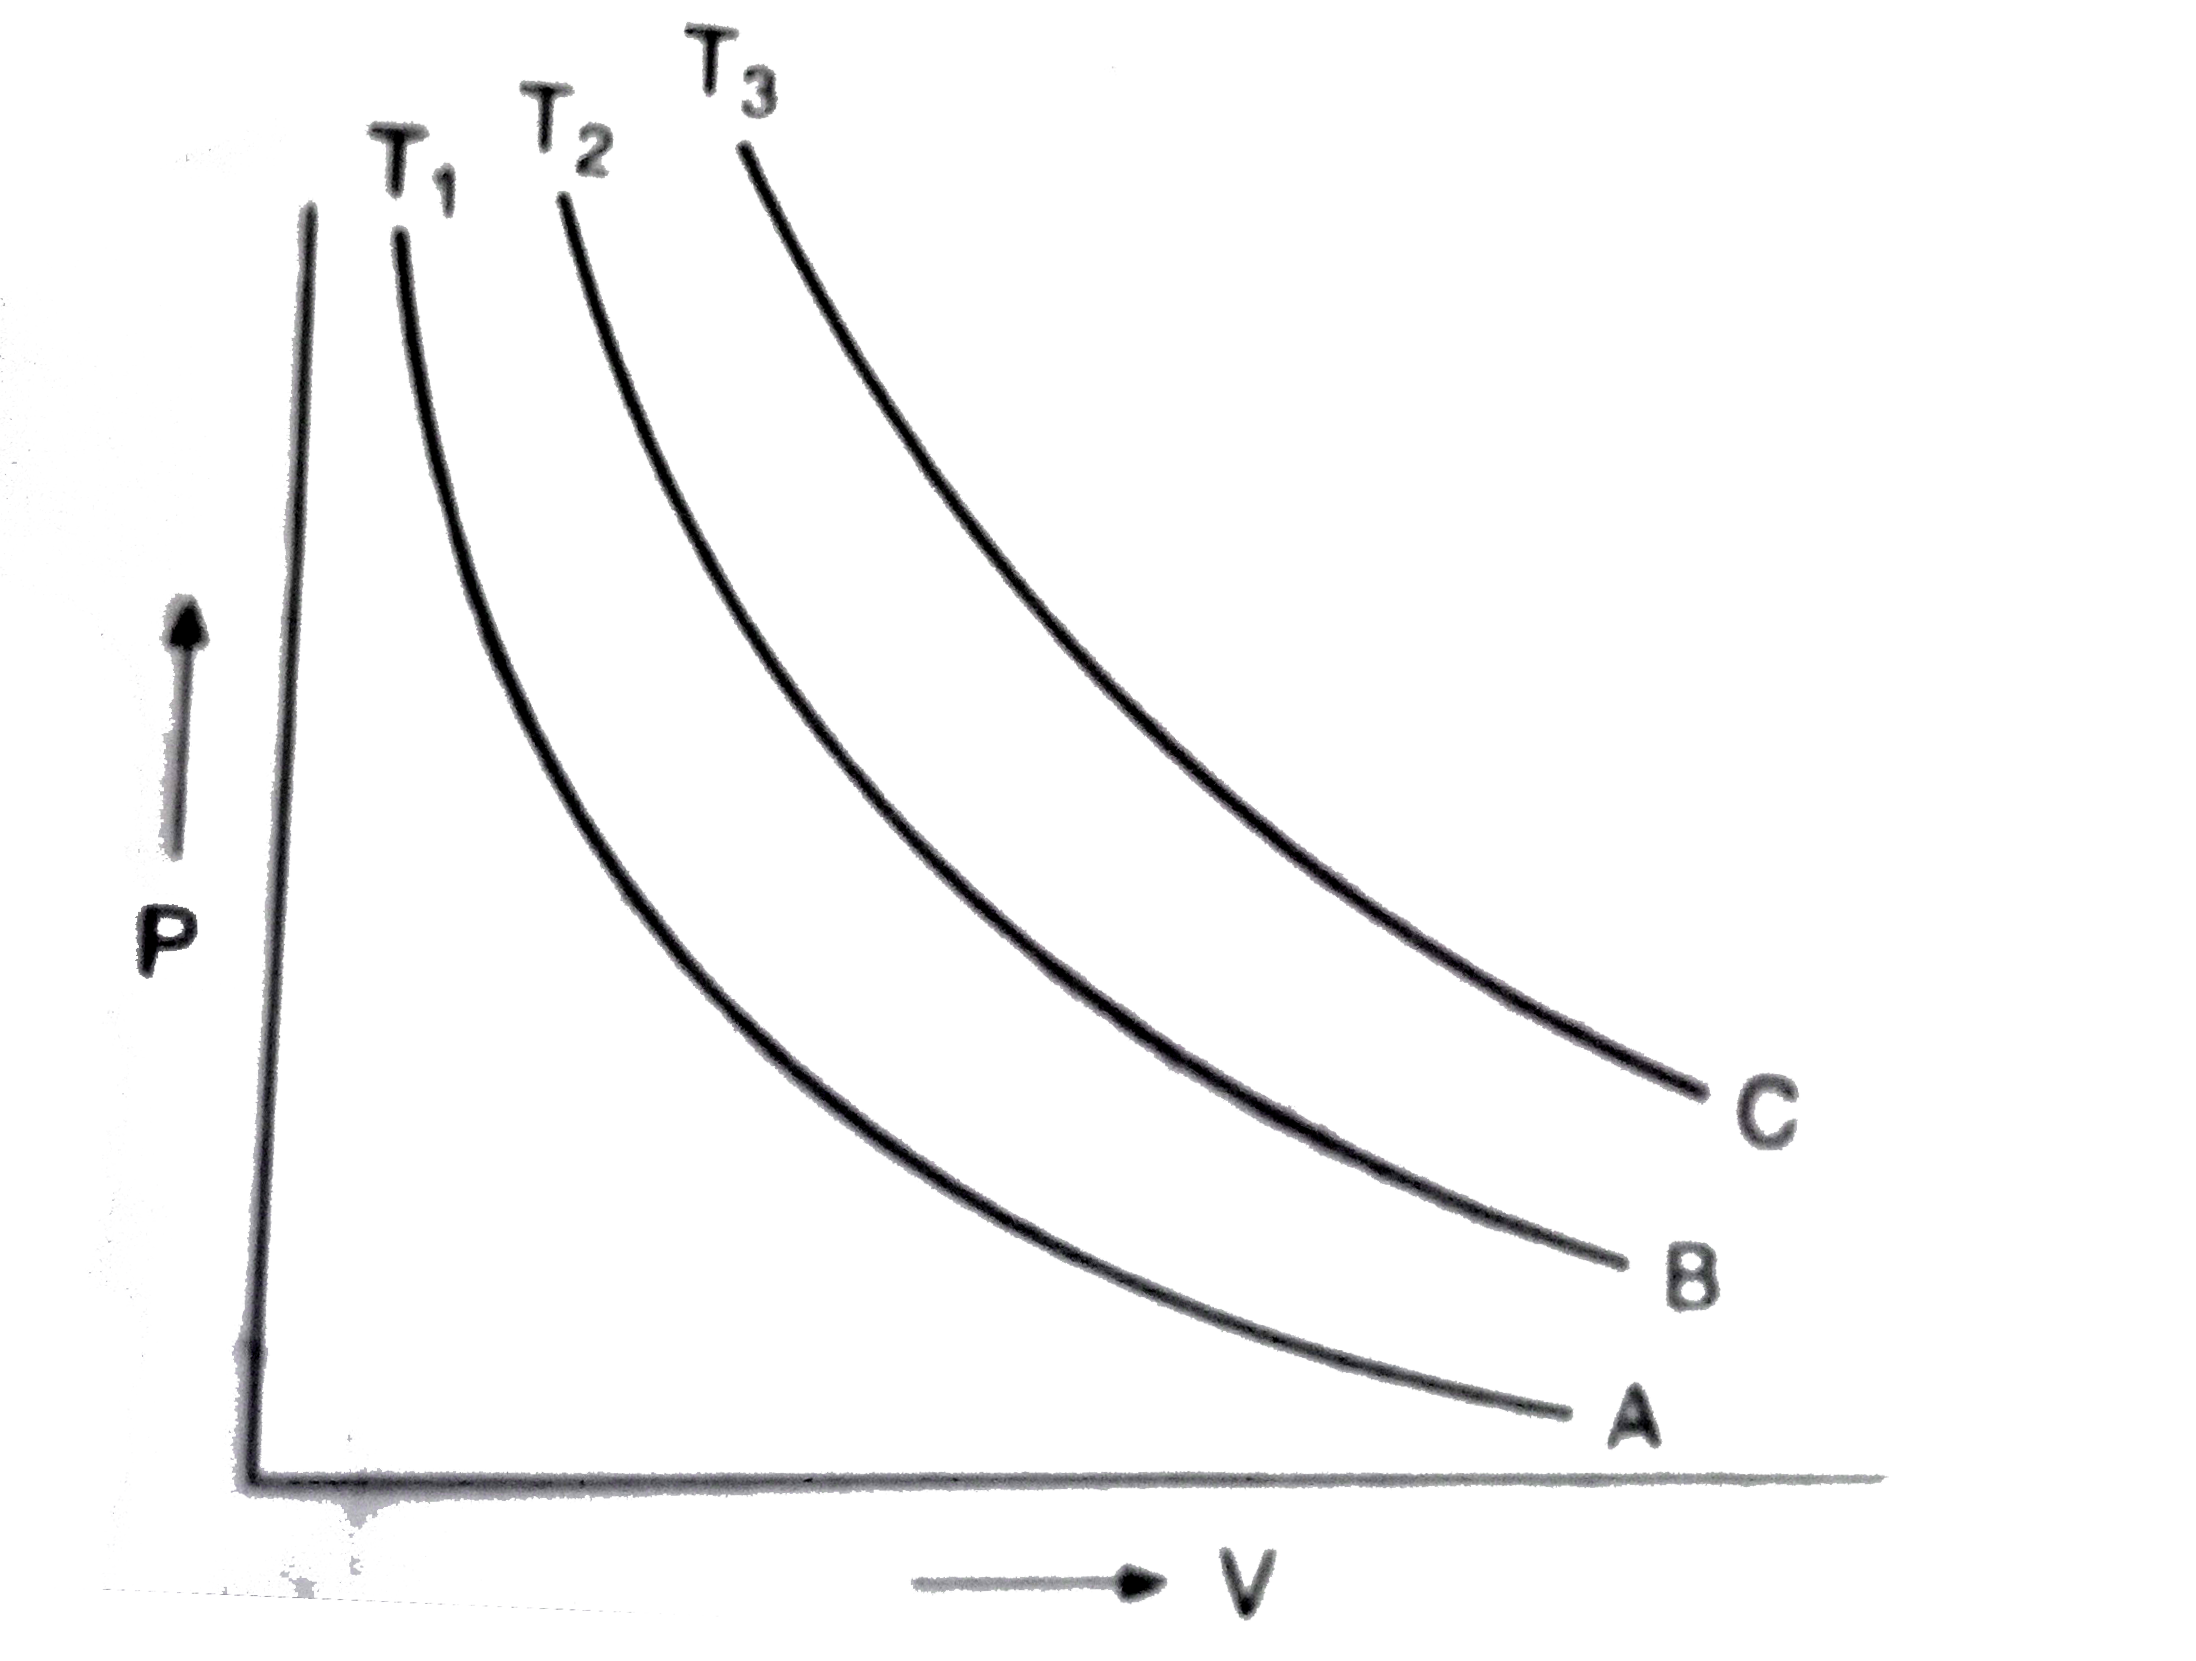
View SolutionThree isothermal plots (P versus V) A, B and C are plotted at three temperature T1,T2andT3 respectively
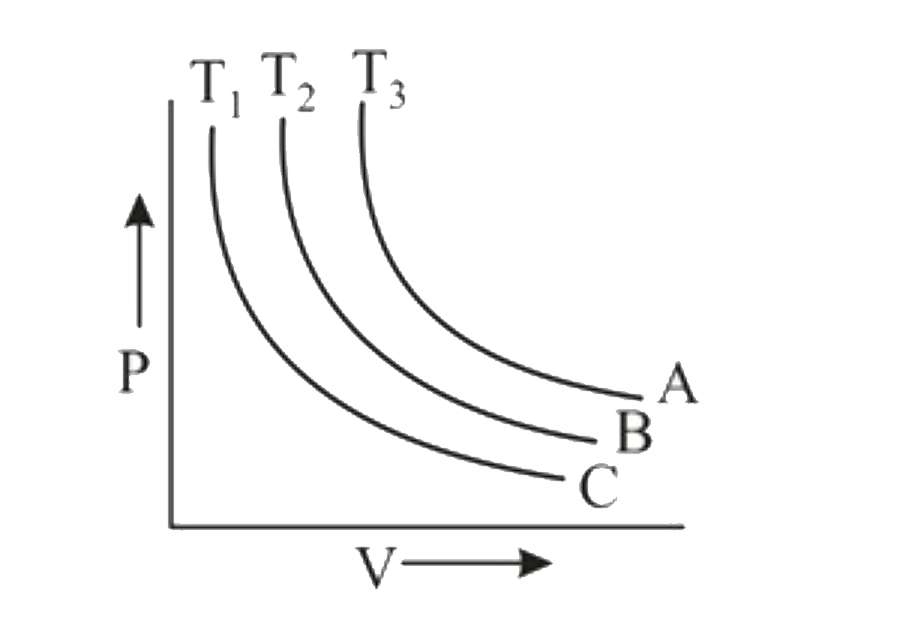
The correct order of the temperature will be
View SolutionIn following isothermal graphs A, B and C at temperatures T1,T2 and T3, the correct order of temperatures will be :
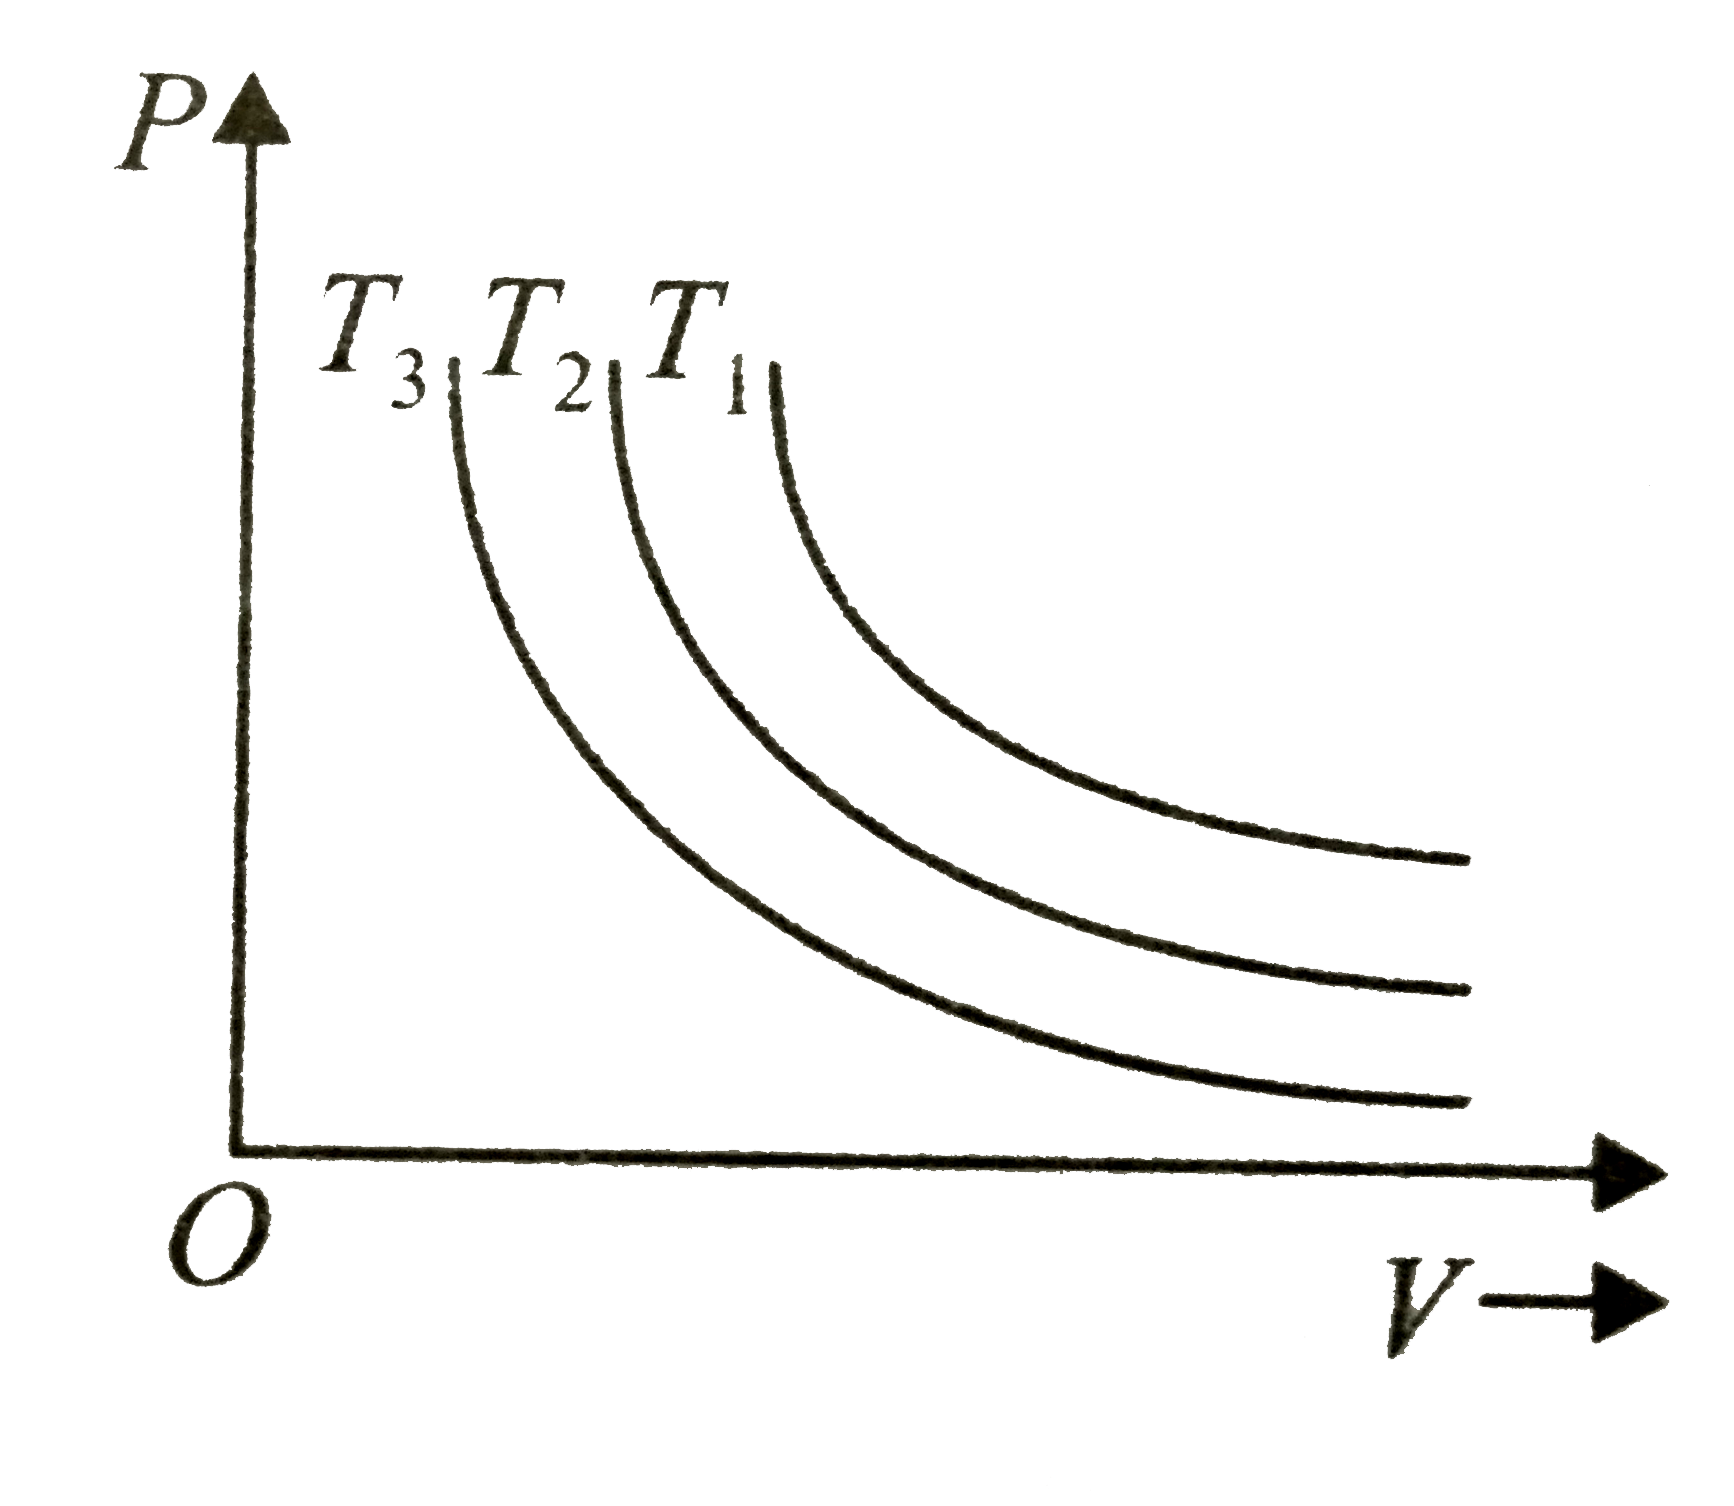
View SolutionThe isothermal diagram of a gas at three different temperatures T1,T2and_(3), is show in the given figure .Then
View Solution