A block of steel heated to 100∘C is left in a room to cool Which of the curves shown in the represents the correct behaviour
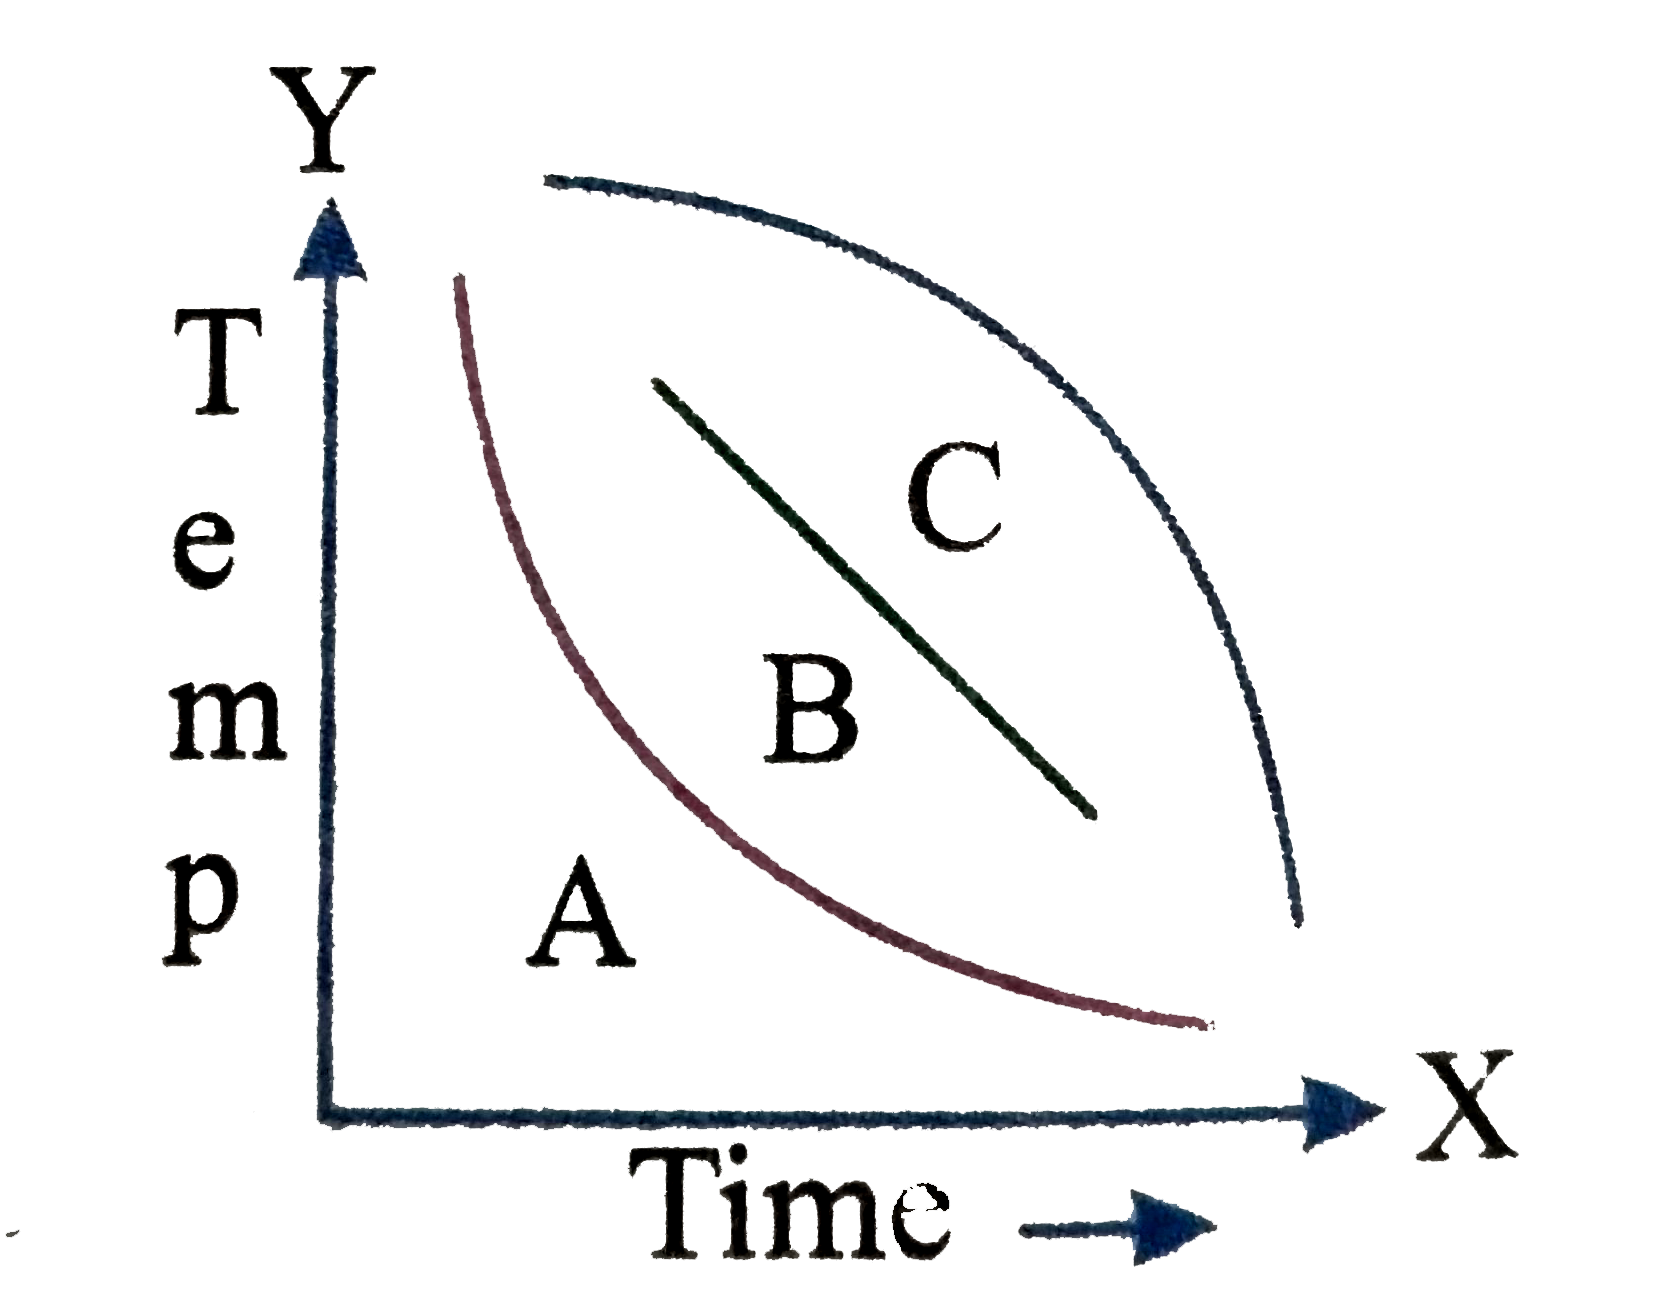 .
.
A
B
C
none of these
Step by step video & image solution for A block of steel heated to 100^(@)C is left in a room to cool Which of the curves shown in the represents the correct behaviour . by Physics experts to help you in doubts & scoring excellent marks in Class 11 exams.
Topper's Solved these Questions
Similar Questions
Which among the curve shown in cannot posibly represent electrostatic field lines?
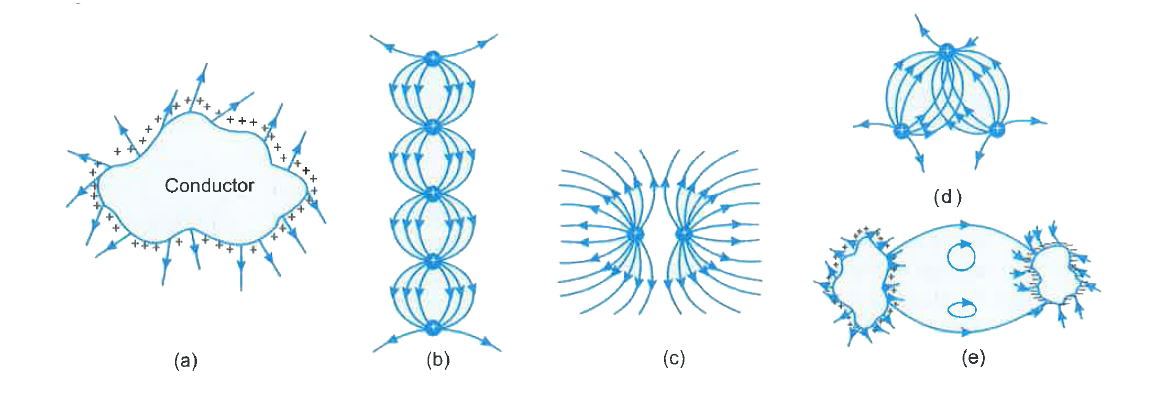 View Solution
A graph was plotted taking the temperature in .∘C along the X-axis and the corresponding temperature in Kelvin along the Y-axis. Which of the curves in Fig, 6.1 most correctly represents this behaviour?
View Solution
Knowledge Check
- Question 1 - Select One
A block of ice at −12∘C is slowly heated and converted into steam at 100∘C. Which of the following curves best represents the event ?
A B
B C
C D
D
- Question 2 - Select One
A block of ice at −10∘C is slowly heated and converted to steam at 100∘C. Which of the following curves represents the phenomenon qualitatively?
A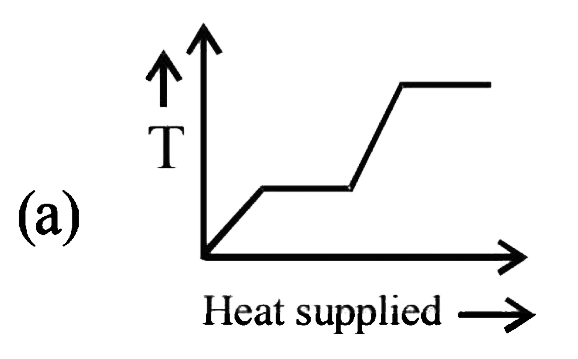 B
B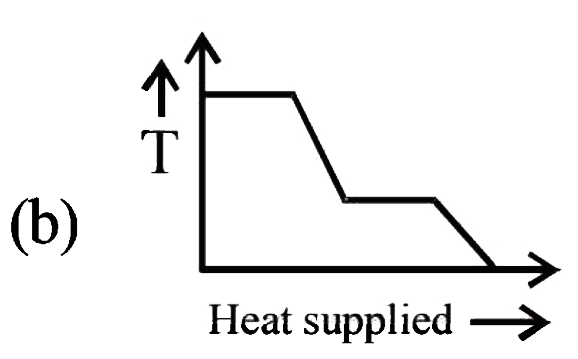 C
C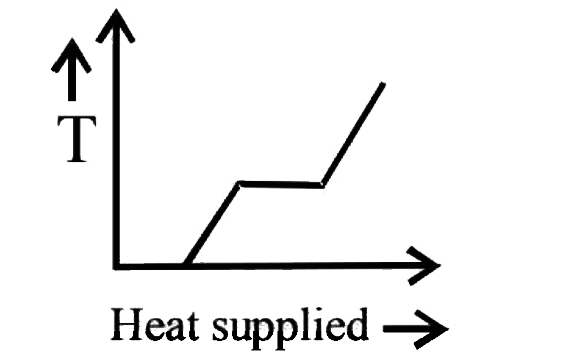 D\
D\ - Question 3 - Select One
A block of ice −10∘C is slowly heated and converted to steam at 100∘C. Which of the following curves represent the phenomenon qualitatively?
A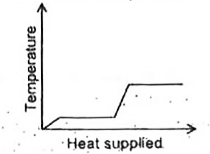 B
B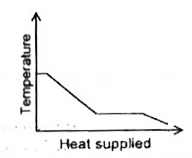 C
C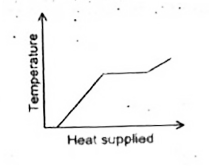 D
D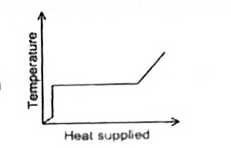
A block of metal is heated to a temperature much higher than the room temperature and allowed to cool in a room free from air currents. Which of the following curves correctly represents the rate of cooling
View SolutionA circular plate, a cube and a sphere, all made up of same material and having the same mass, are heated to 300∘C and left in a room. Which of them will have the slowest rate of cooling?
View SolutionA block of ice at 0∘C is converted to steam at 100∘C. Which process will require the most amount of heat?
View SolutionA process is shown in the diagram. Which of the following curves may represent the same process?
 View Solution
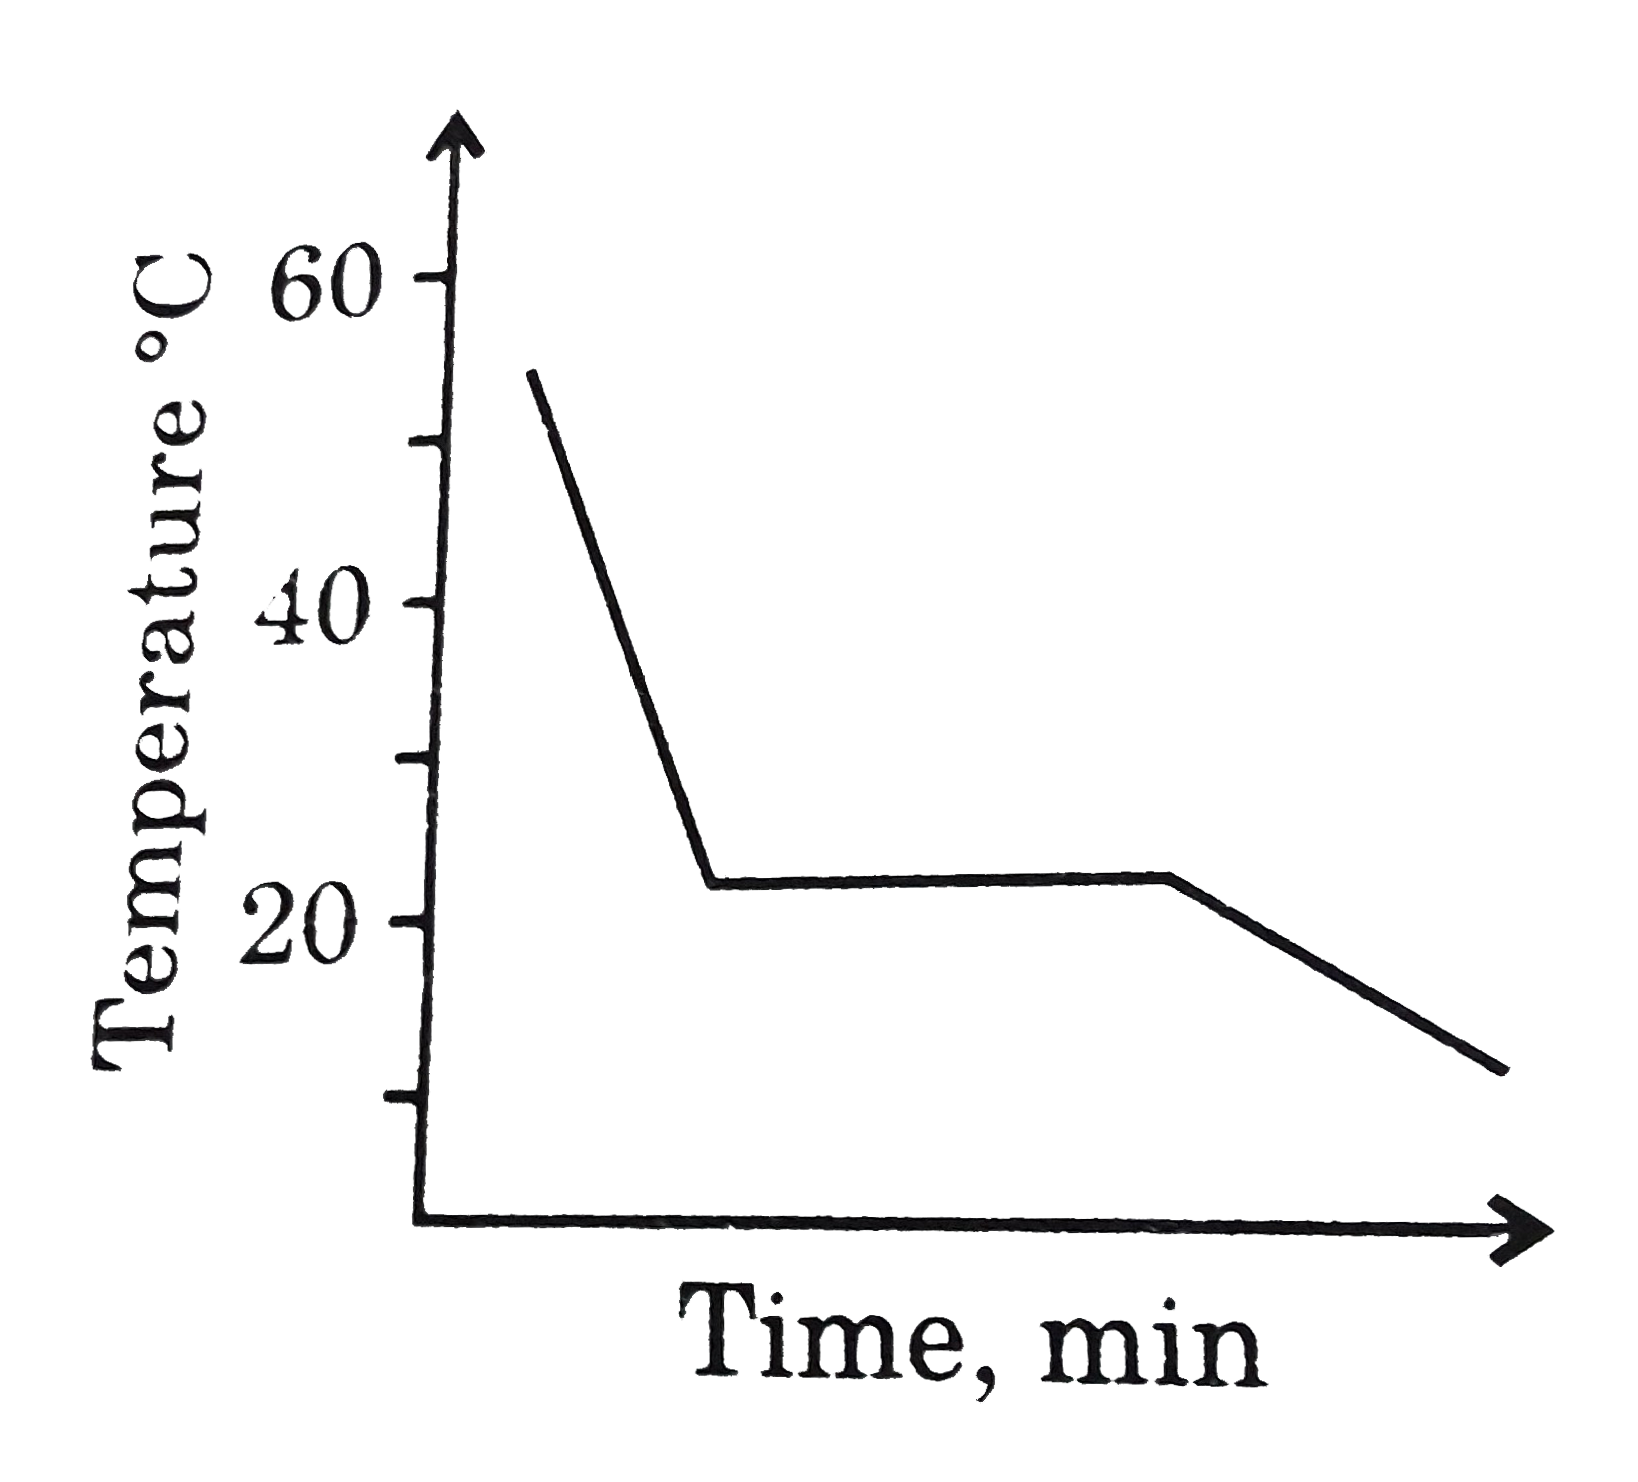
This diagram represents the behaviour of a pure solvent upon cooling. Which of the diagrams below best represents the cooling curve of a solution in that solvent upon cooling ? (Assume that all diagrams are drawn to the same scale.)
 View Solution

