The point on stress-strain graph at which the plastic flow starts is known as
elastic limit
neck formation
yield point
breaking point
The correct Answer is:C
Step by step video, text & image solution for The point on stress-strain graph at which the plastic flow starts is known as by Physics experts to help you in doubts & scoring excellent marks in Class 12 exams.
Updated on:21/07/2023Topper's Solved these Questions
- ELASTICITYBOOK - TARGET PUBLICATIONCHAPTER - ELASTICITYEXERCISE - Critical Thinking
54 Videos
- ELASTICITYBOOK - TARGET PUBLICATIONCHAPTER - ELASTICITYEXERCISE - Competitive Thinking
69 Videos
- CURRENT ELECTRICITY BOOK - TARGET PUBLICATIONCHAPTER - CURRENT ELECTRICITY EXERCISE - Evaluation Test
6 Videos
- ELECTROMAGNETIC INDUCTIONBOOK - TARGET PUBLICATIONCHAPTER - ELECTROMAGNETIC INDUCTIONEXERCISE - EVALUATION TEST
8 Videos
Similar Questions
The shape of stress vs strain graph within elastic limit is :
View SolutionThe stress strain graph for a metal wire is shown in the fig. Upto the point E, the wire returns to its original state O along the curve EPO, when it is gradually unloaded. Point B corresponds to the fracture of the wire. (a) Upto what point on the curve is Hooke's law obeyed? (this point some times called proportional limits).
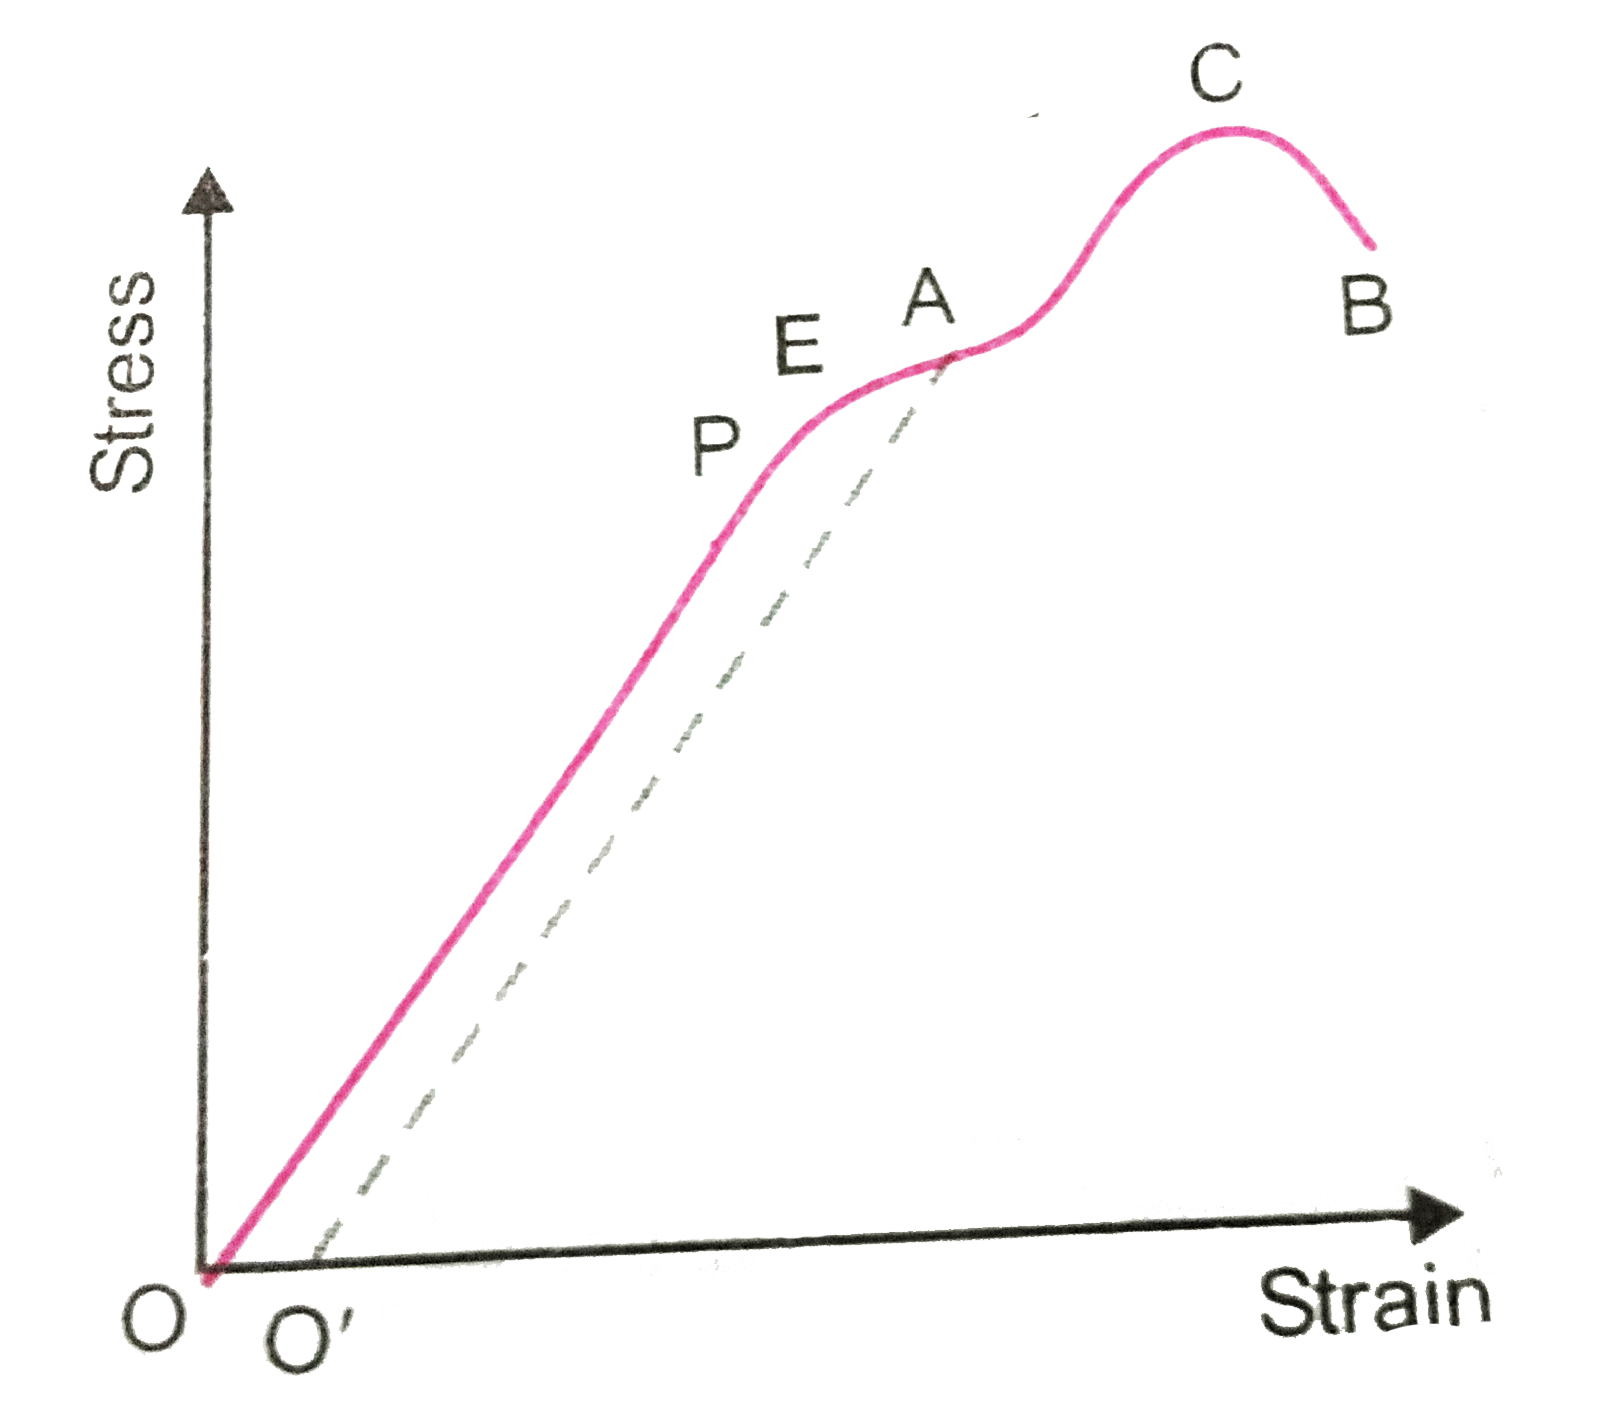
(b) Which point on the curve corresponding to elastic limet or yield point of the wire?
(c ) Indicate teh elastice and plastic regions of the stree-strain graph.
(d) Describe what happens when the wire is loaded upto a stress corresponding to the point A on the graph and then unloaded gradulally. In particular explain the dotted curve.
(e) Wht is peculiar about the protion of the stree- strain graph from C to B? Upto what stress can the wire be subjected with out causing fracture?
View Solution
Knowledge Check
The point on the stress-strain curve at which the strain begins to increase even without any increase in the stress is
Aelastic limit pointBbreaking pointCplasticity limit pointDyield pointThe ratio of stress to strain is called
AFrictional coefficient,BElastic constant,CCoefficient of viscosity,DSurface tension.The ratio of stress and strain is called
Asurface tensionBmodulus of elasticity,Ccoefficient of friction,Dcoefficient of viscosity.
The graph given is a stress-strain curve for

View SolutionThe stress-strain graph for a metallic wire is shown at two different temperature, T1 and T2 which temperature is high T1 or T2 ?
View SolutionThe graph between stress and strain represents the
View SolutionFigure shows the relationship between tensile stress and strain for a typical material. Below proportional point A, stress is directly proportional to strain which means Young's moudulus (Y) is a constant. In this region the material obeys Hooke's law.
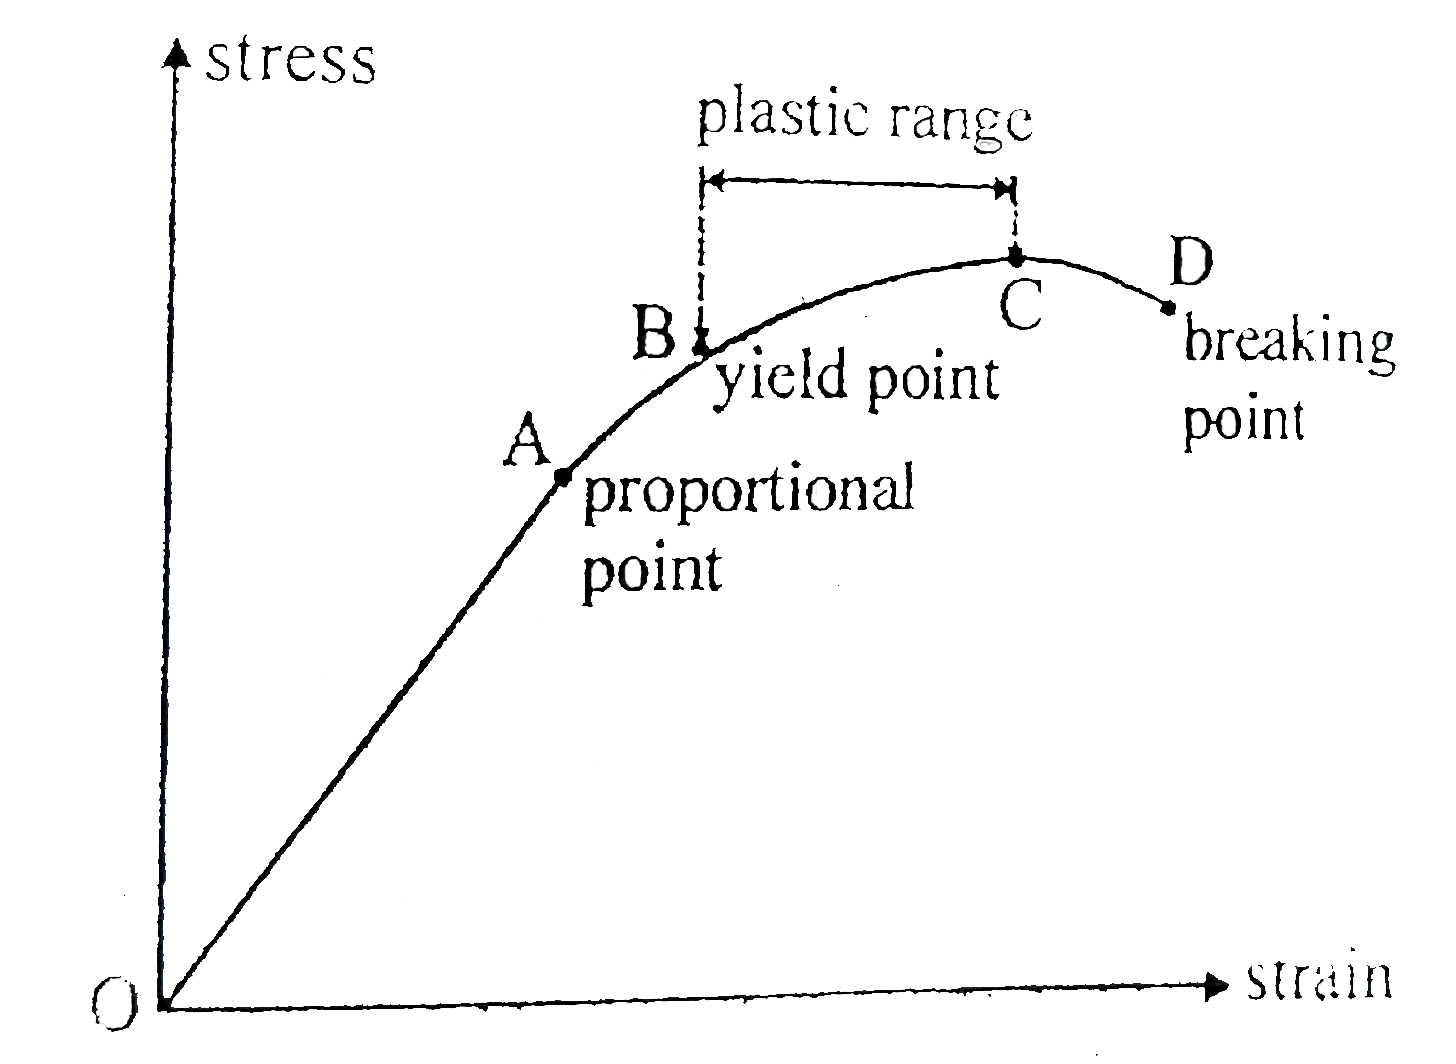
Provided the strain is below the yield point 'B' the material returns to its original shape and size when the force is removed. Beyond the yield point, the material retains a permancnt deformation after the stress is removed. For stresses beyond the yeld point, the material exhibit plastic flow, which means that it continues to elongate for little increases in the stress. Beyond C a local constriction occurs. The material fractures at D (i.e. breaking point). The graph below shows the stress-strain curve for 4 different materials.
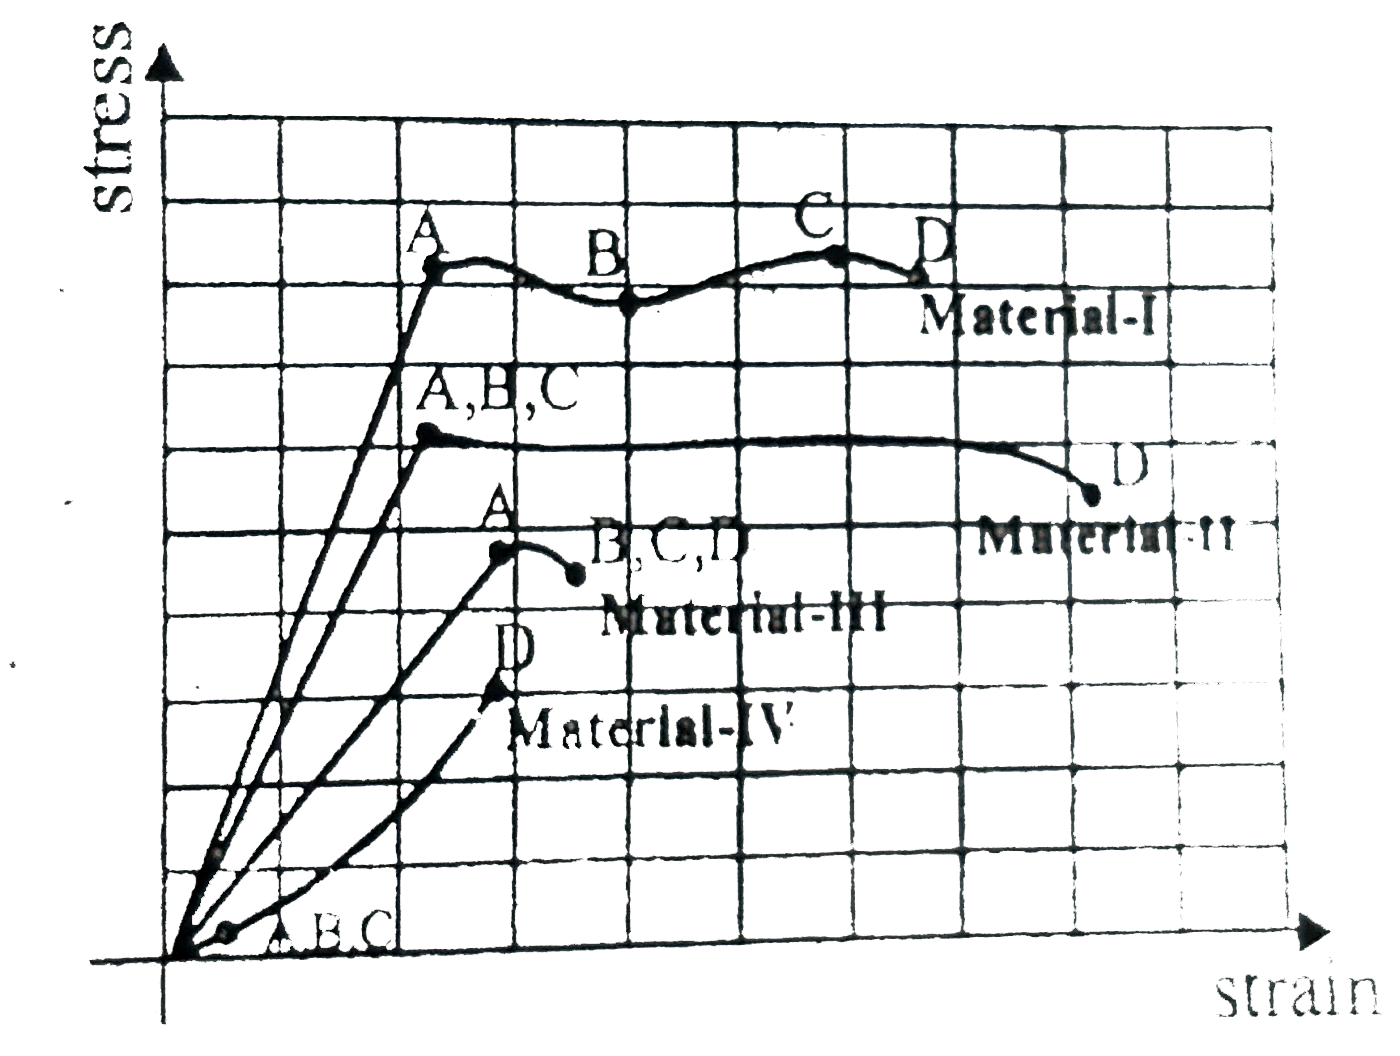
Material which is good for making wires by stretching is
View SolutionFigure shows the relationship between tensile stress and strain for a typical material. Below proportional point A, stress is directly proportional to strain which means Young's moudulus (Y) is a constant. In this region the material obeys Hooke's law.
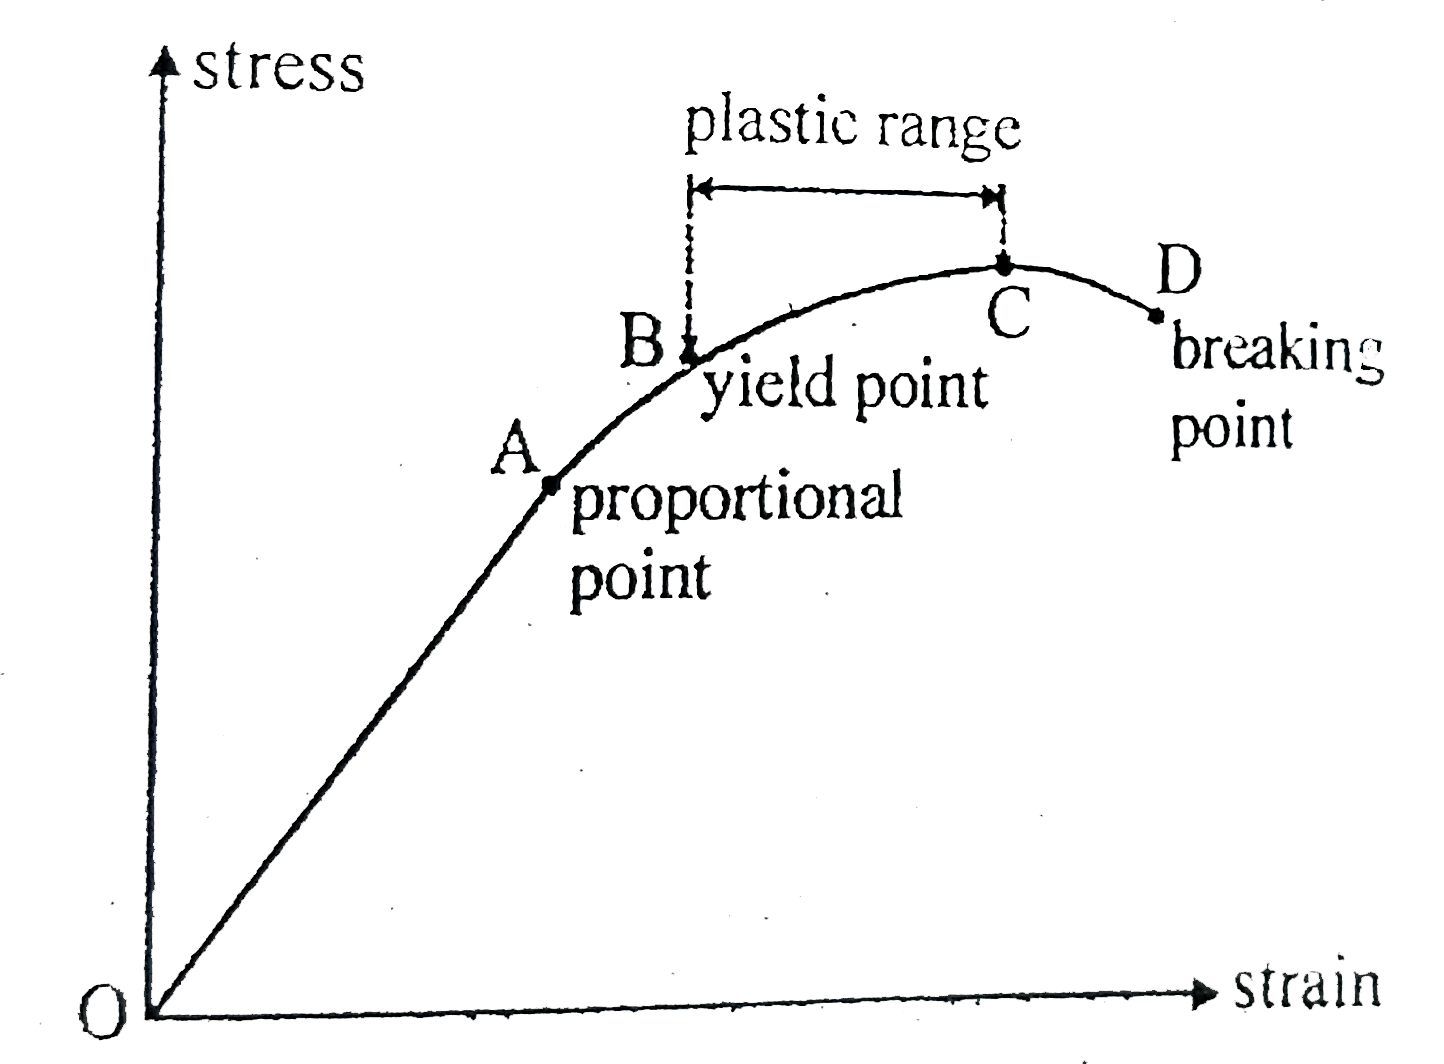
Provided the strain is below the yield point 'B' the material returns to its original shape and size when the force is removed. Beyond the yield point, the material retains a permancnt deformation after the stress is removed. For stresses beyond the yeld point, the material exhibit plastic flow, which means that it continues to elongate for little increases in the stress. Beyond C a local constriction occurs. The material fractures at D (i.e. breaking point). The graph below shows the stress-strain curve for 4 different materials.
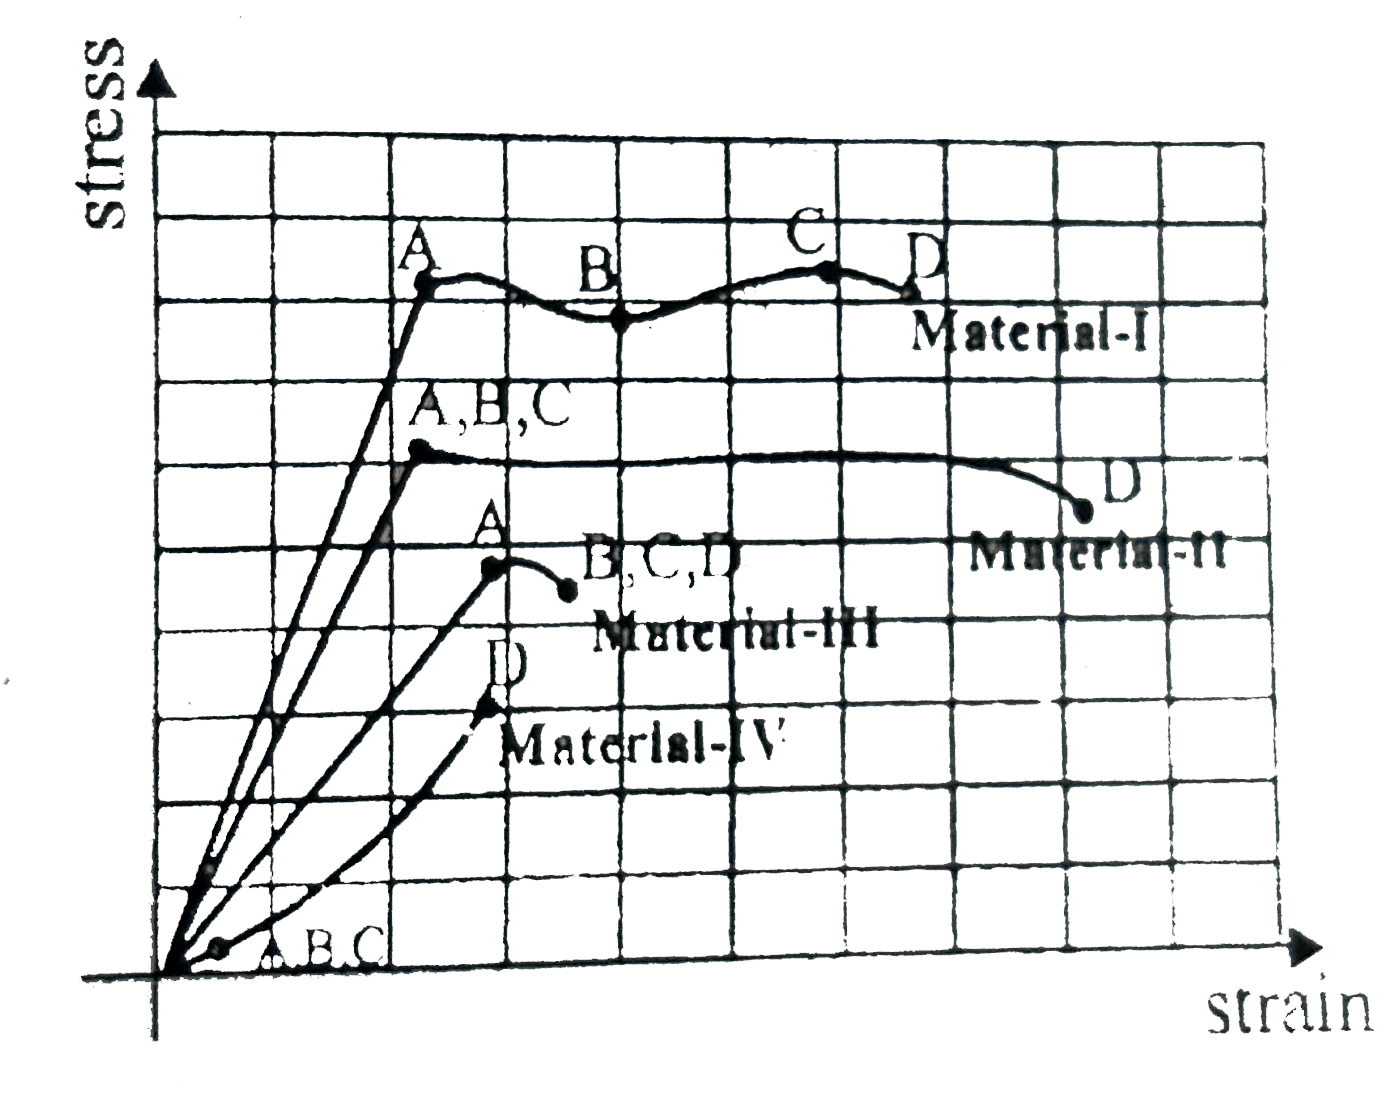
Material which is most brittle is
View Solution
