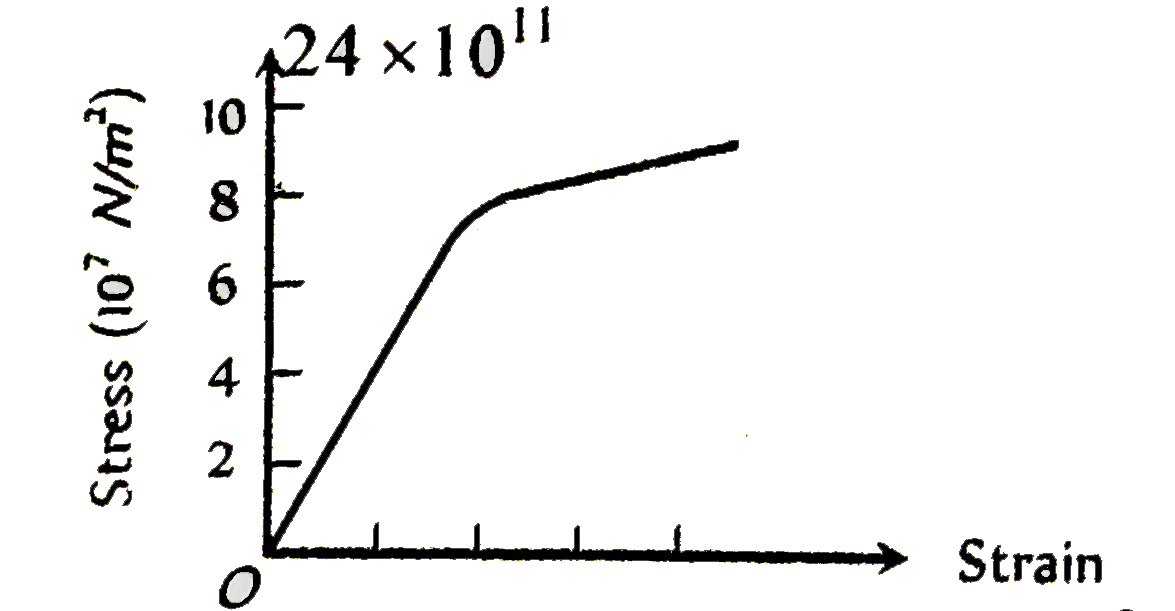
The graph given is a stress-strain curve for

A
elastic objects
B
plastics
C
elastomers
D
None of these
Video Solution
|
Answer
Step by step video & image solution for The graph given is a stress-strain curve for by Physics experts to help you in doubts & scoring excellent marks in Class 11 exams.
Updated on:21/07/2023
Topper's Solved these Questions
Similar Questions
Knowledge Check
- Question 1 - Select One
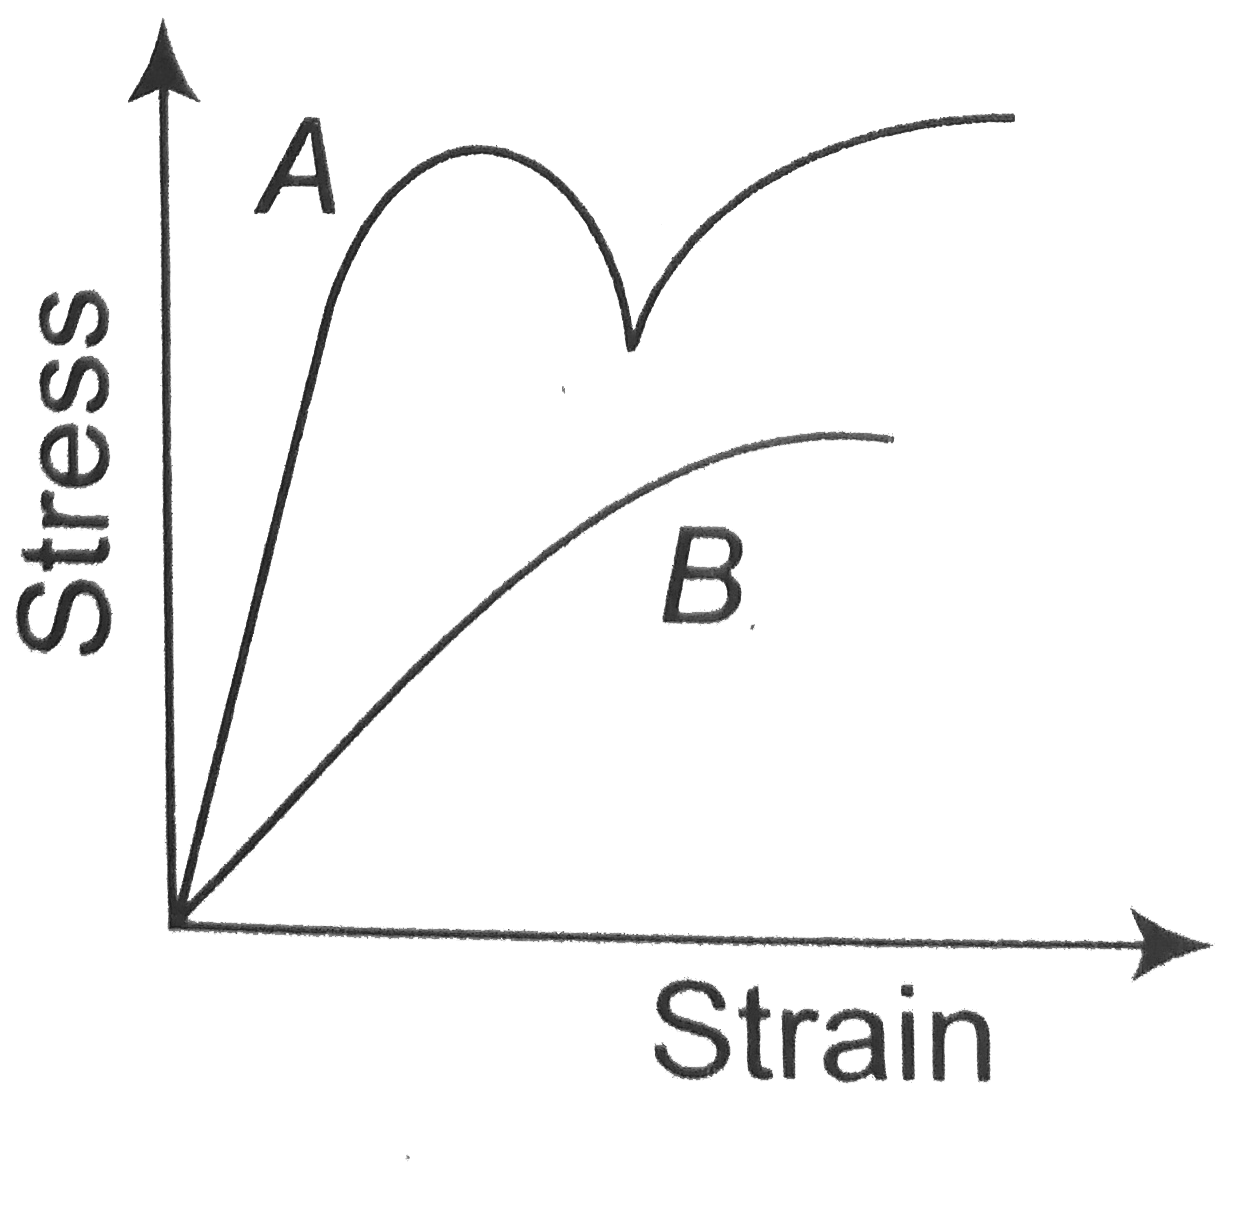
The diagram shoes stress v/s strain curve for the materials A and B. From the curves we infer thatAA is brittle but B is ductileBA is ductile and B is brittleCBoth A and B are ductileDBoth A and B are brittle - Question 2 - Select One
The diagram shows stress v/s strain curve for the materials A and B. From the curves we infer that
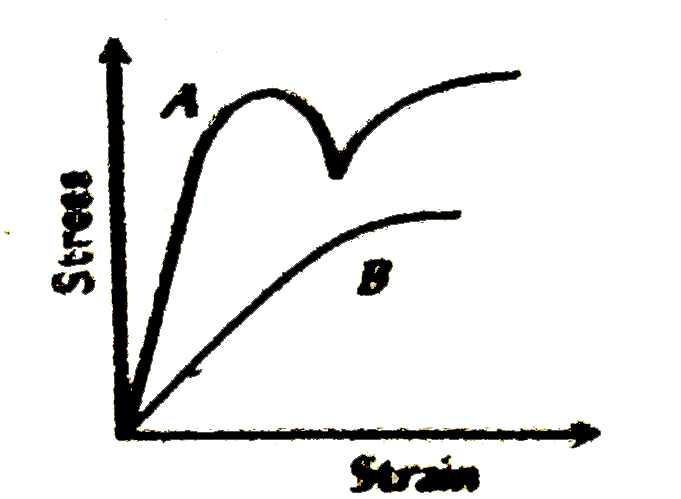 AA is brittle but B is ductileBA is ductile and B is brittleCBoth A and B are ductileDBoth A and B are brittle
 - Question 3 - Select One
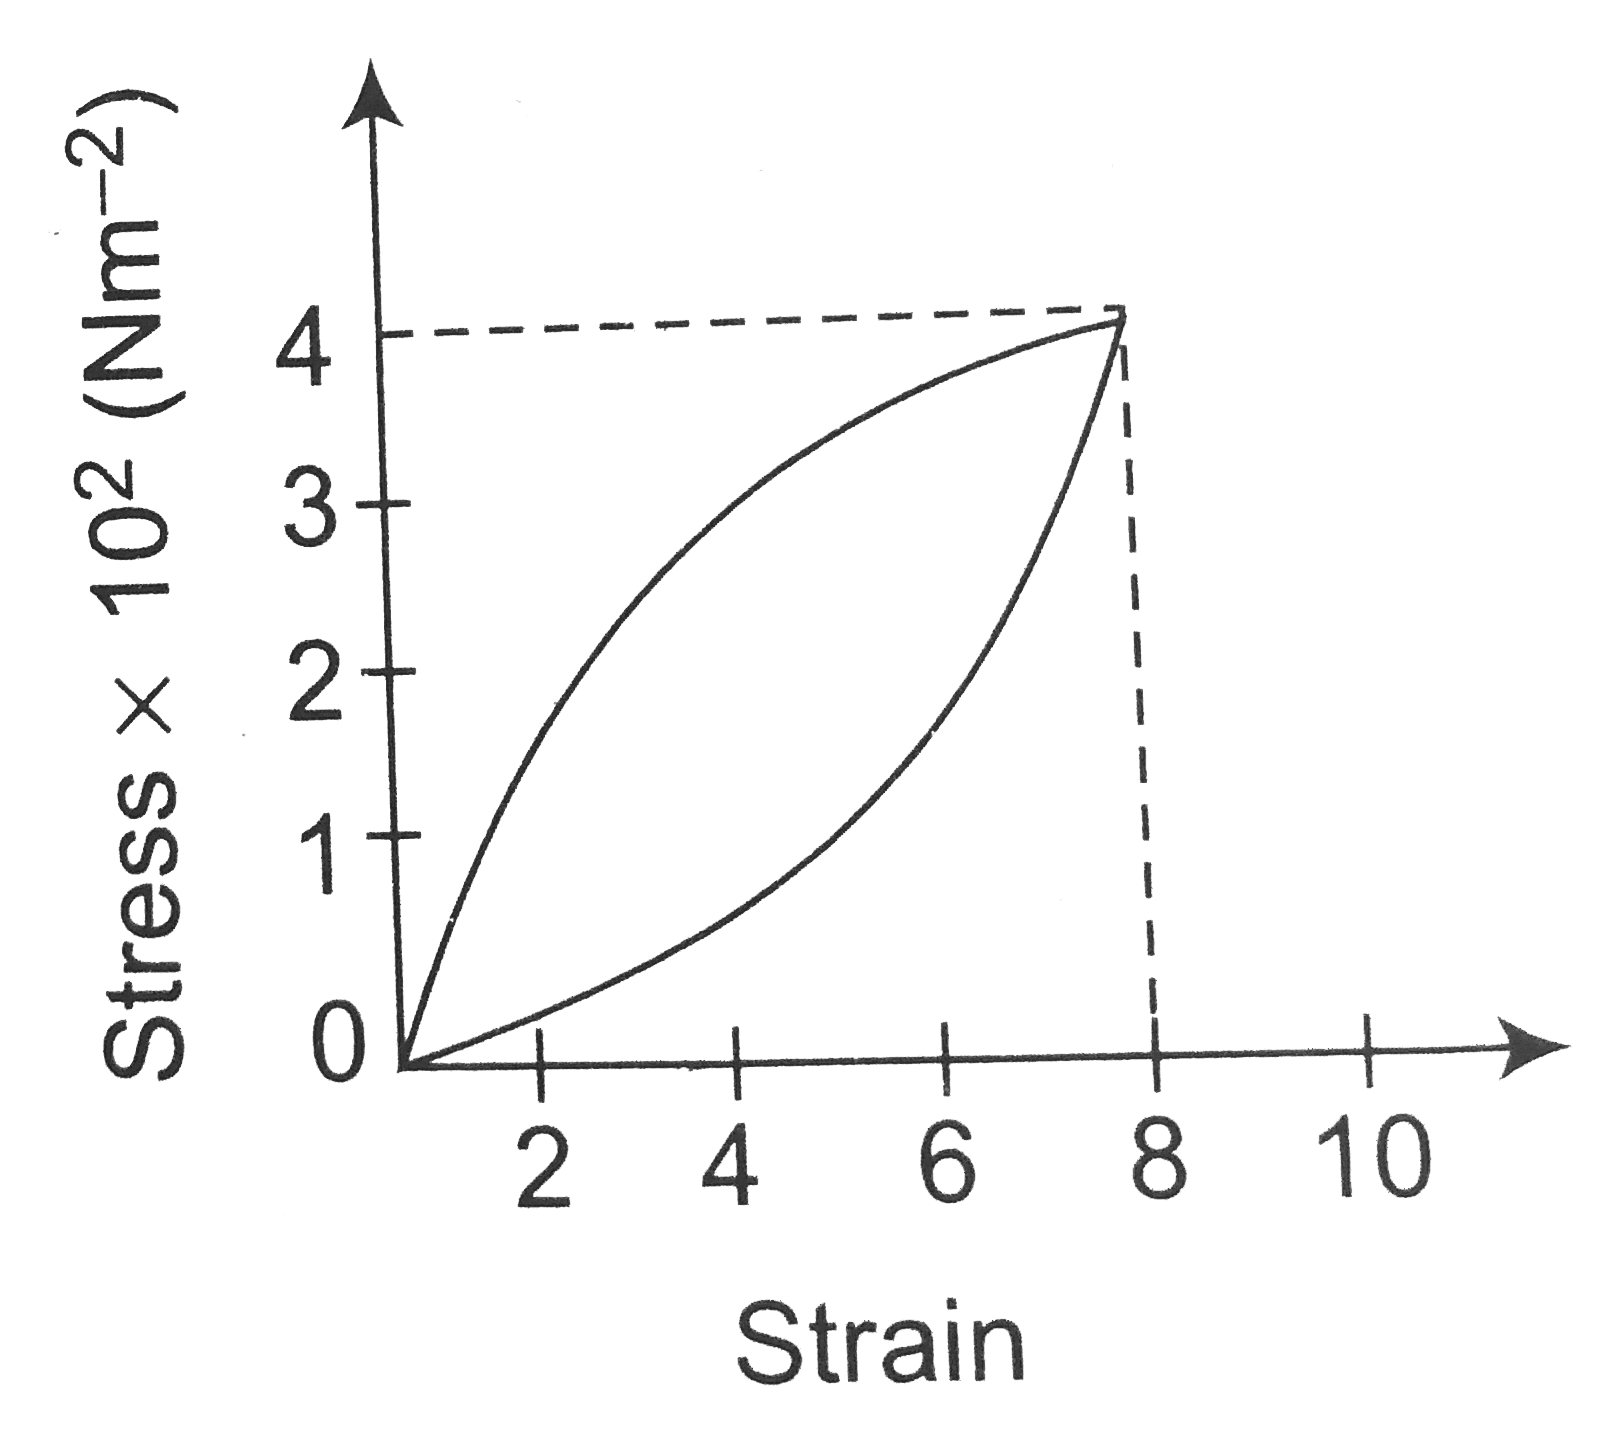
A rubber of volume 2000 cc is alternately subjected to tension and released. The figure shown the stress-strain curve of rubber. Each curve is a quadrant of an ellipse. The amount of energy lost as heat per cycle per unit volume will beA(π2−1)×16×102JB(π4−1)×8×102JC(π4−1)×32×102JD(π2−1)×32×102J
The point on the stress-strain curve at which the strain begins to increase even without any increase in the stress is
View SolutionWhich of the following is the graph showing stress-strain variation for elastomers ?
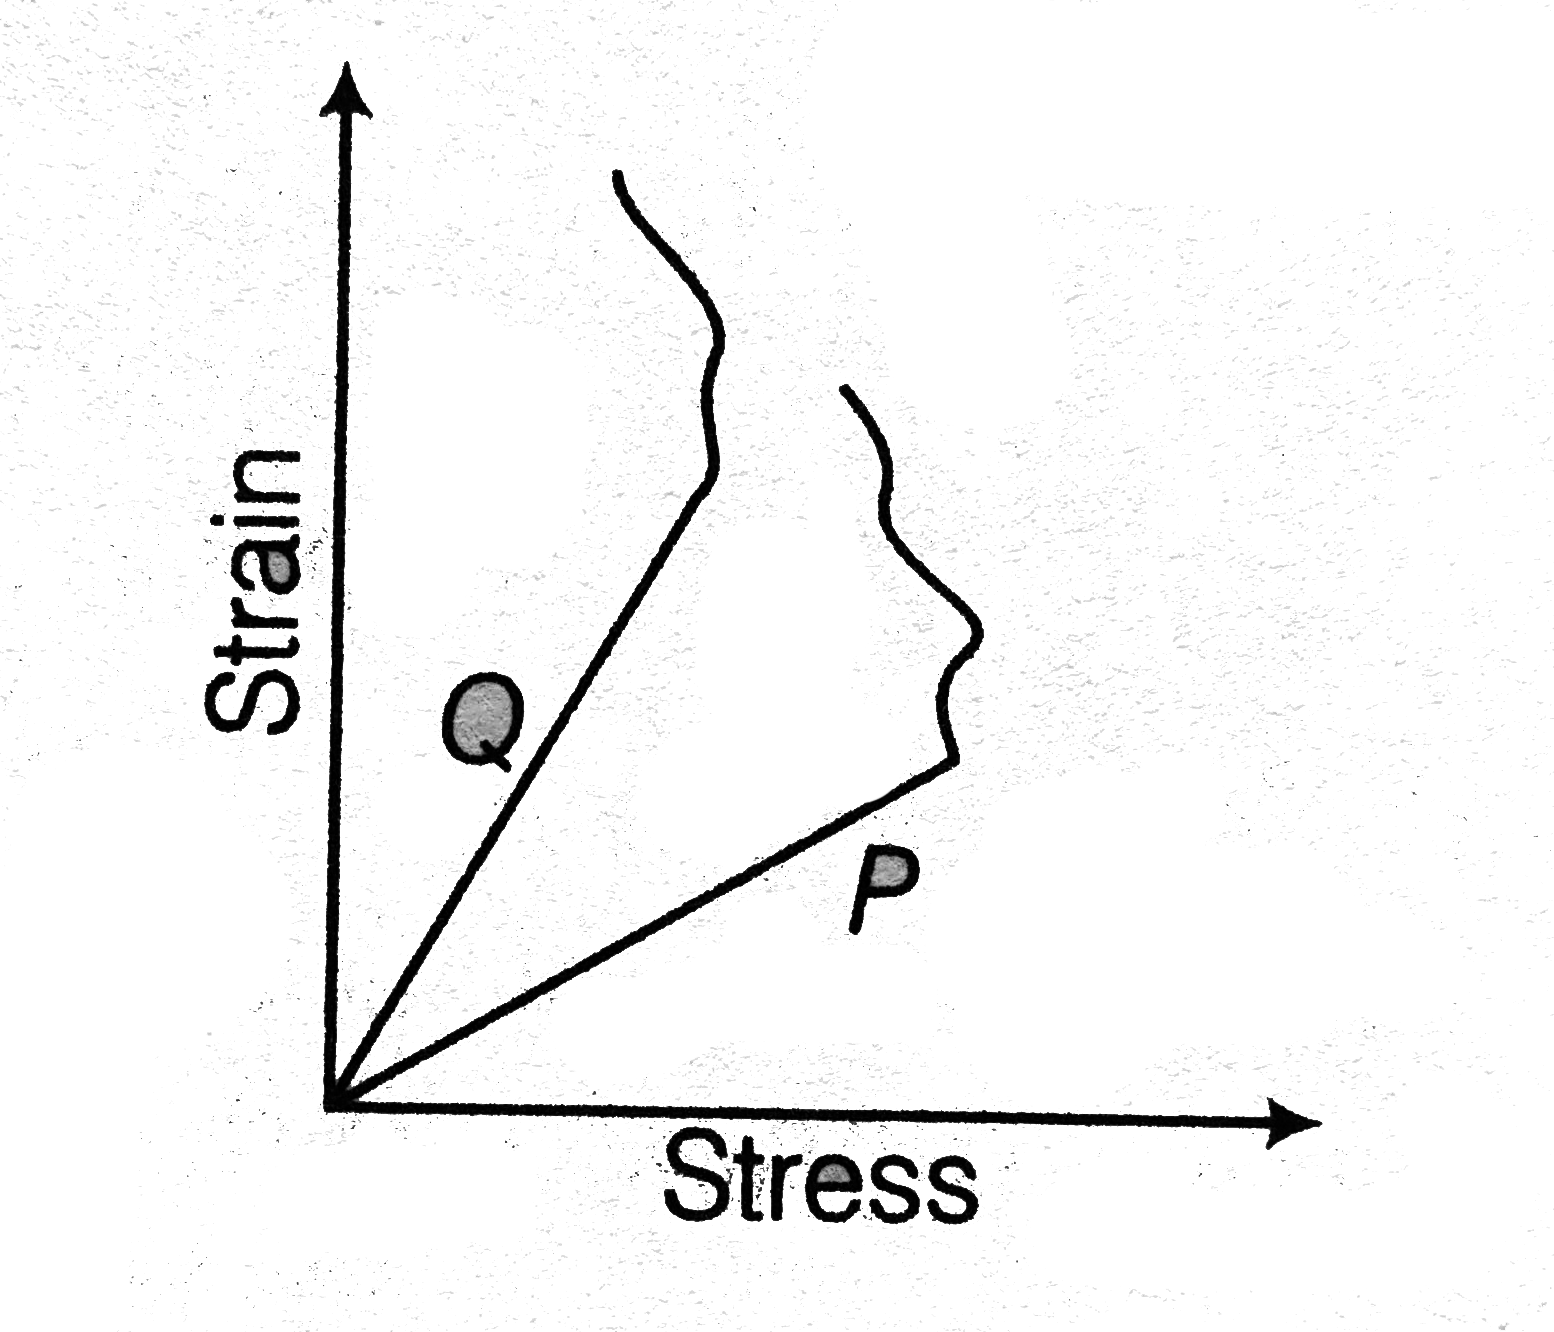
View SolutionFigure shows the stress-strain curve of two metals P and Q. From the graph, it can be concluded that
 View Solution
The graph between stress and strain represents the
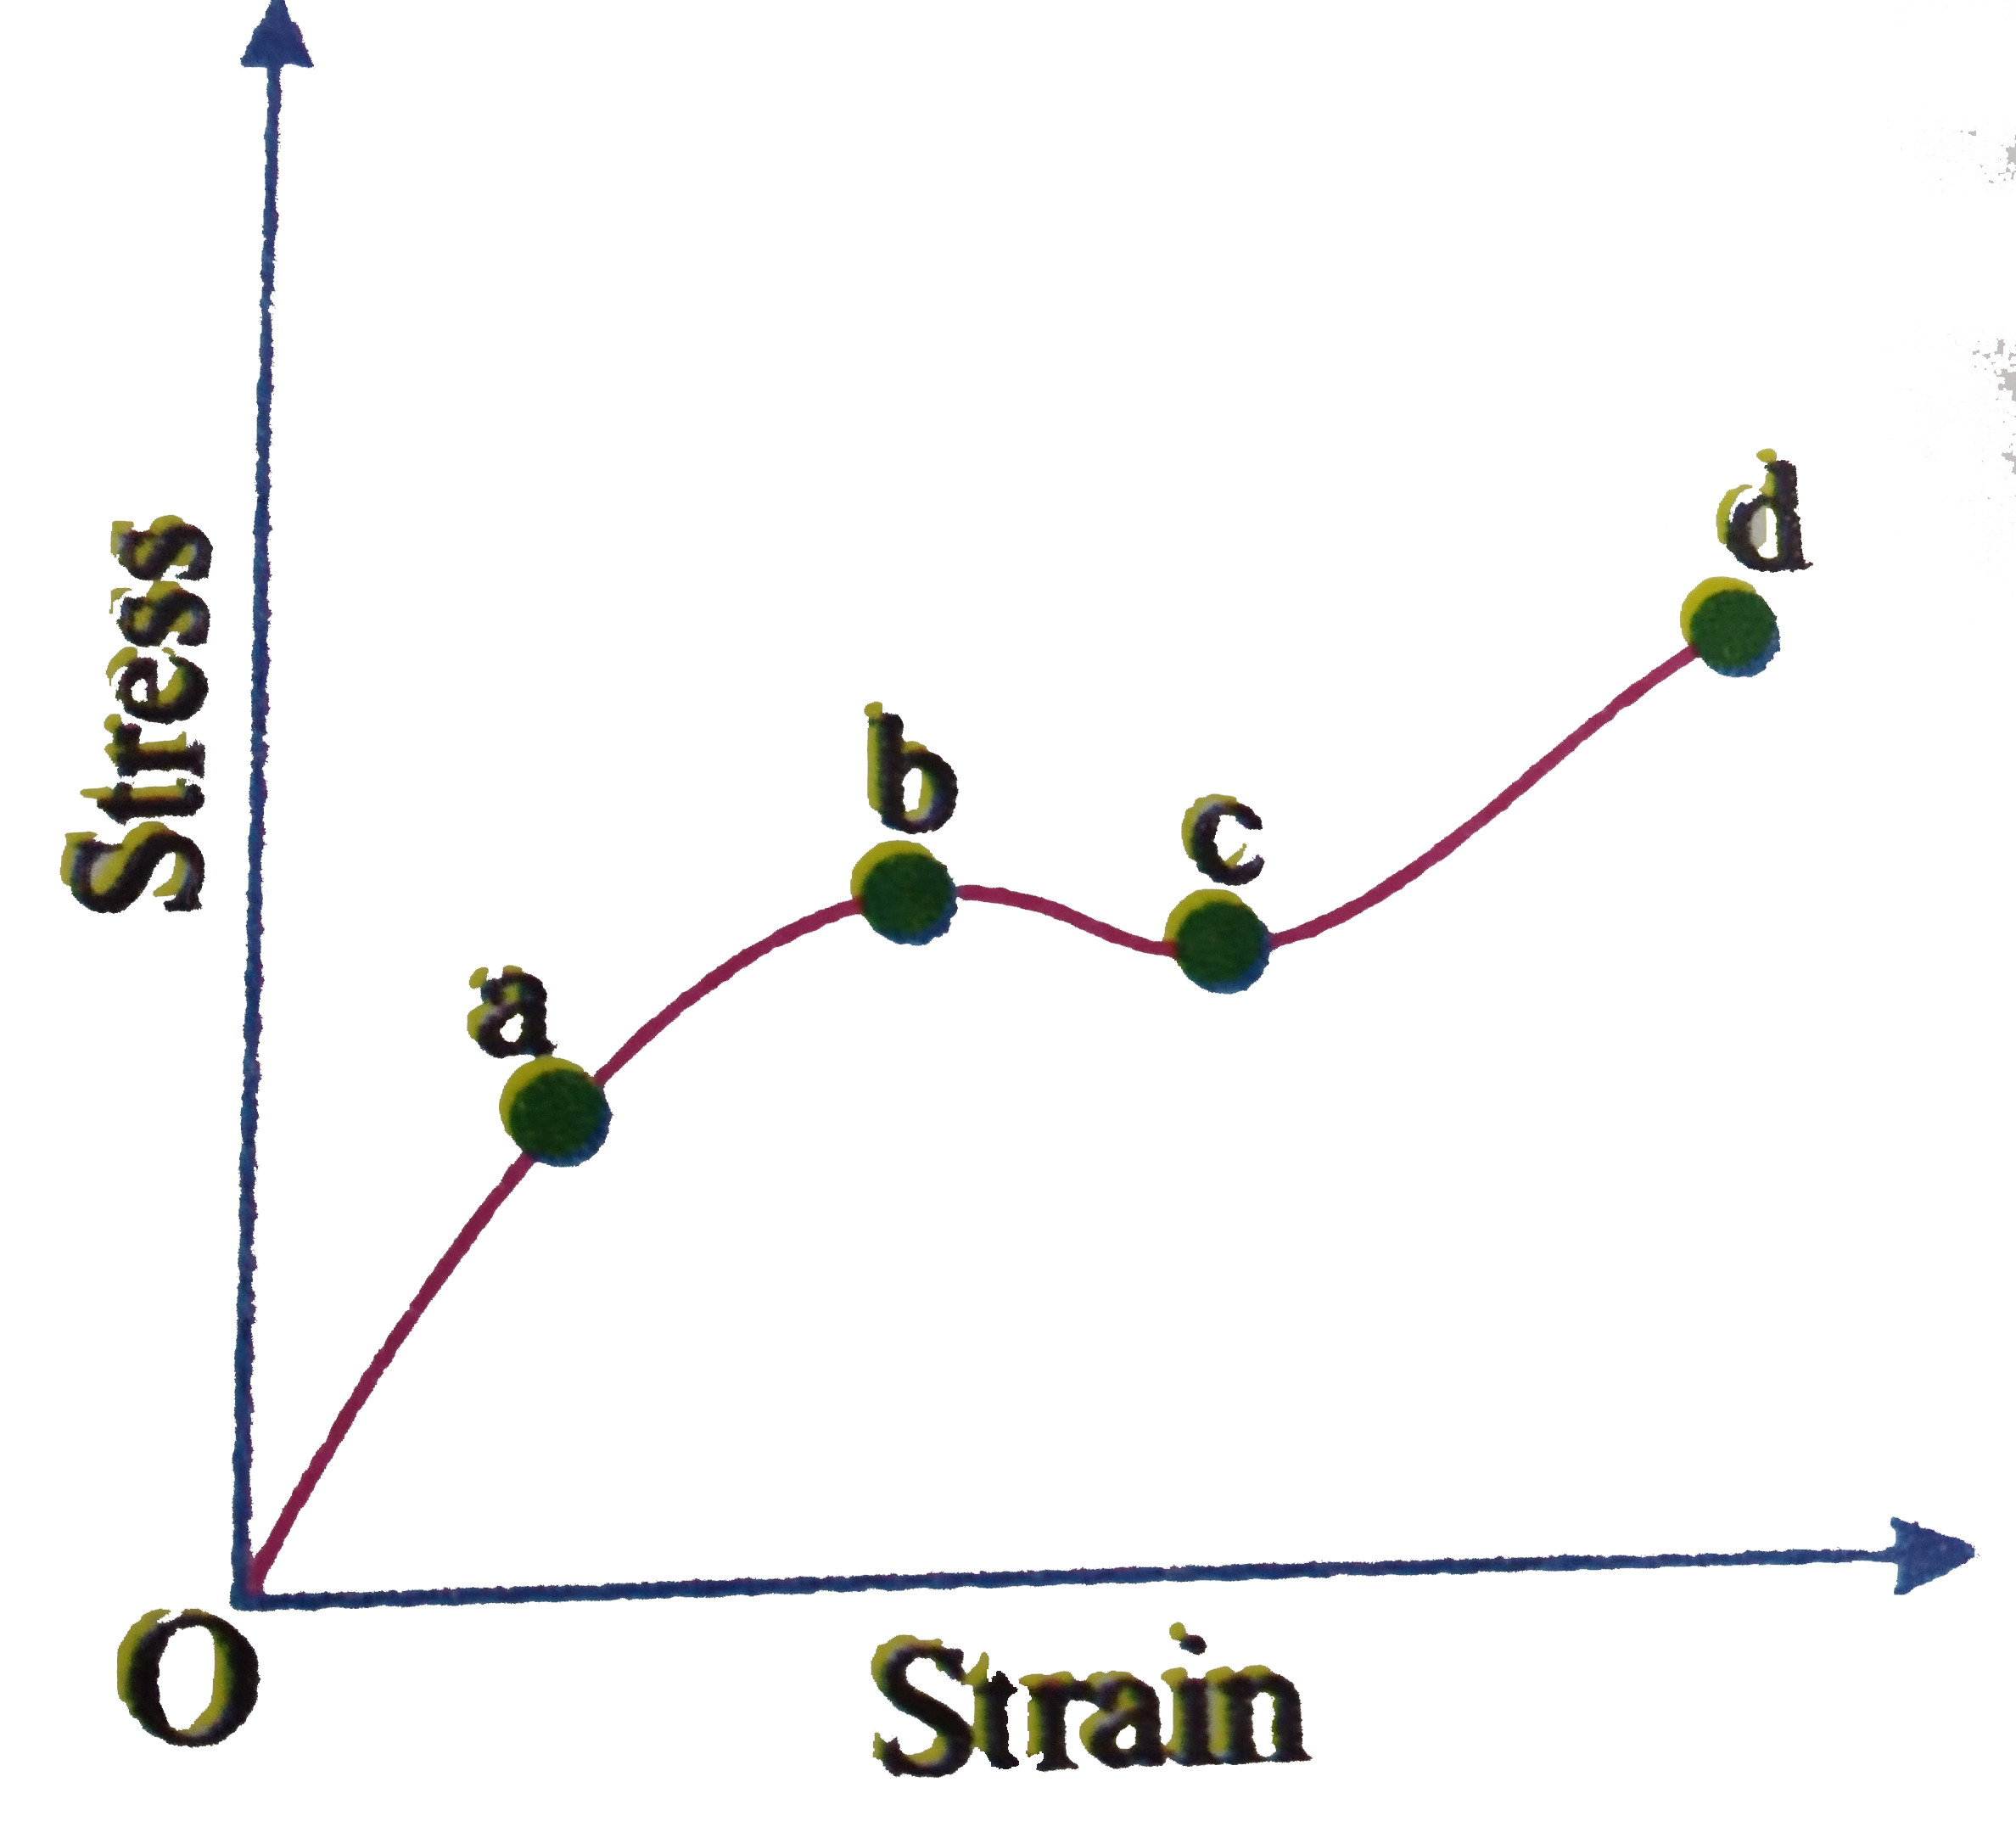
View SolutionA graph is shown between stress and strain for a metal. The part in which Hooke's law holds good is
 View Solution


