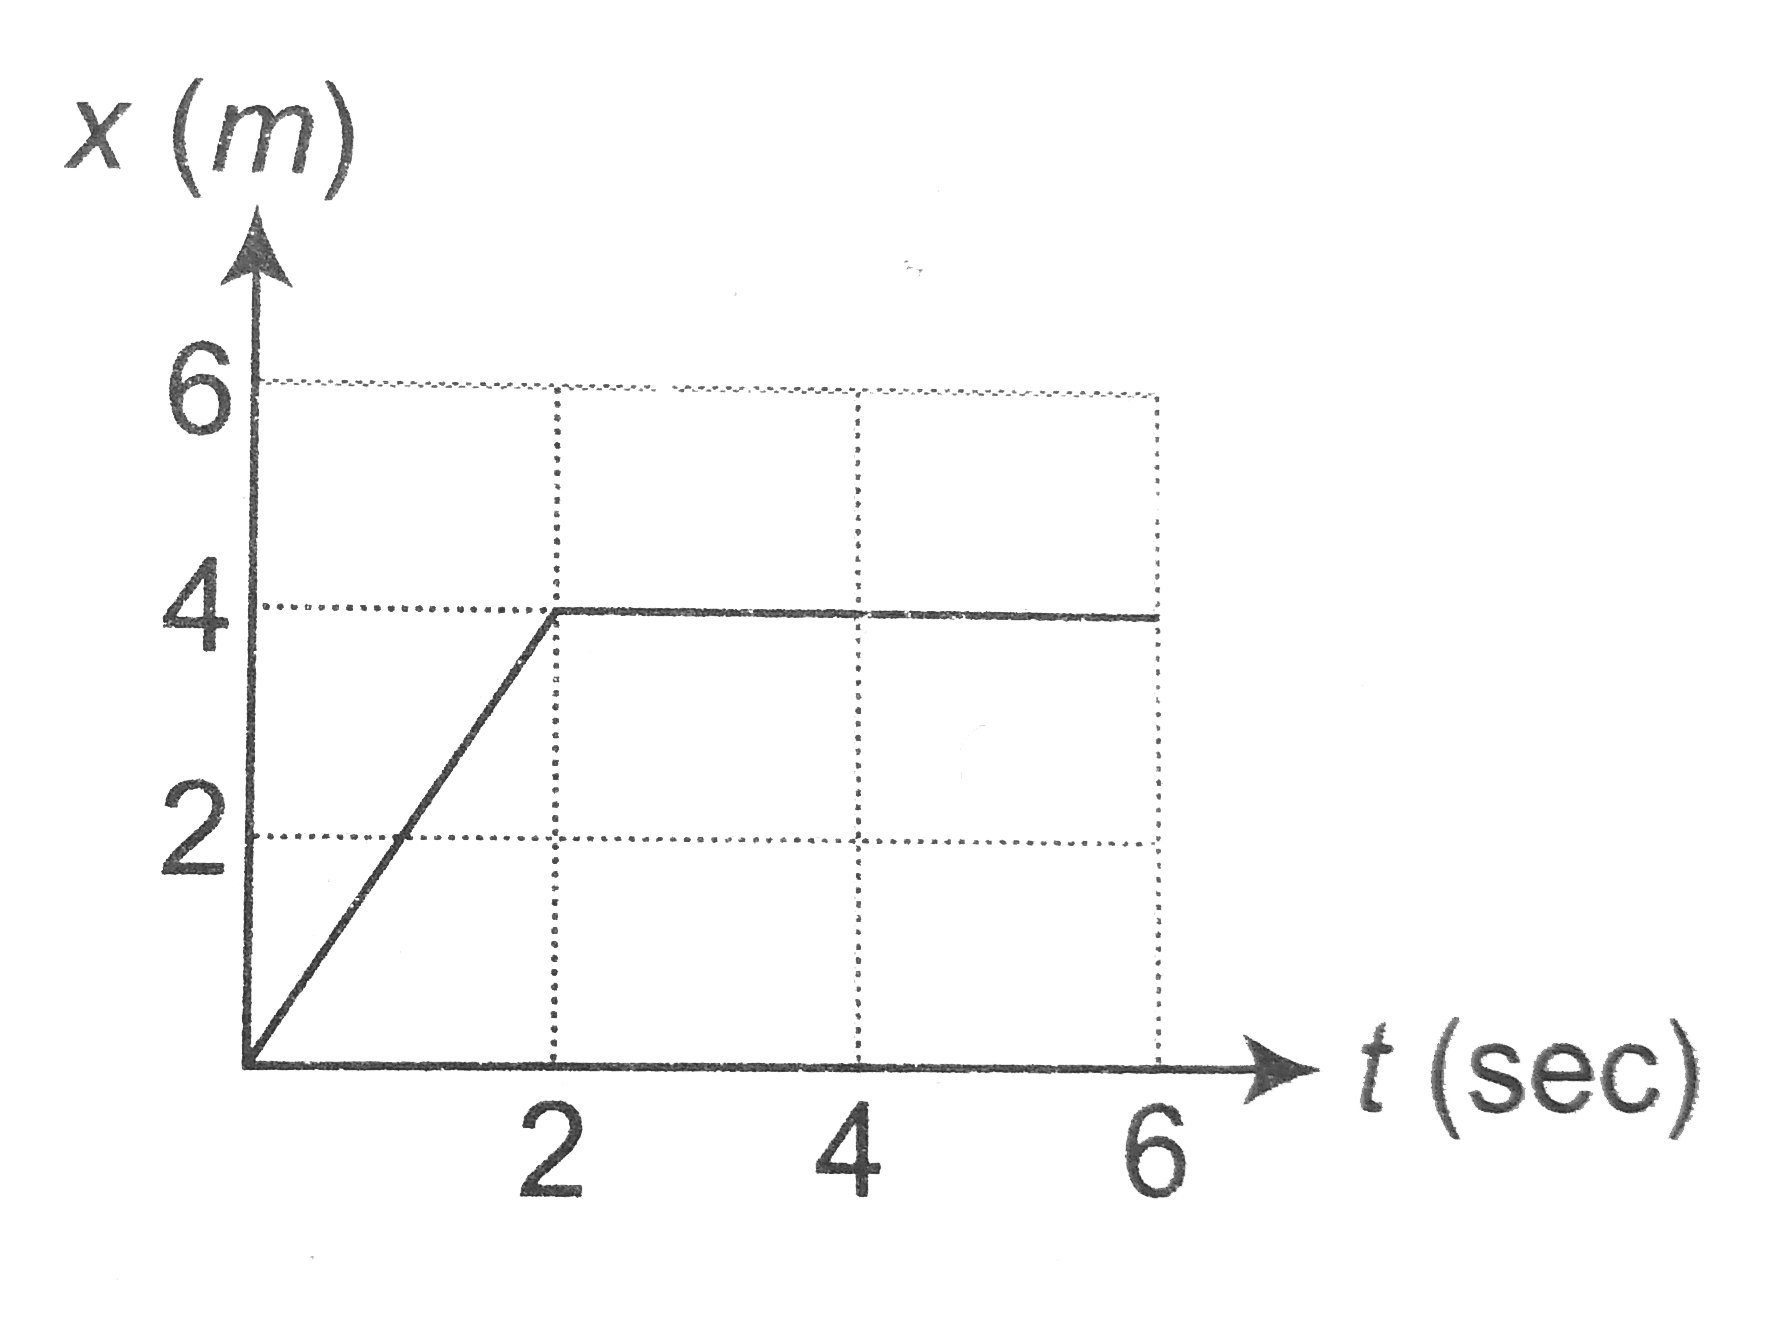
The position time graph of a particle of mass 50 gram is as shown in the figure. What is the impulse at t=2s?

Text Solution
The correct Answer is:B
The velocity of the particle , just before 2s, is
dxdt=42=2m/s
But just 2s, displacement remains constant
∴dx=0
Since the graph is a straight line parallel to t-axis.
∴ Velocity (v) =dxdt=0
∴ Impulse= Change in momentum
=m(v−u)=m(0−2)
=−2m=−2×50×10−3
=−10−1kgm/s=−0.1kgm/s
|
Topper's Solved these Questions
Similar Questions
Knowledge Check
The position-time graph of a particle of mass 0.1 kg is shown. The impulse at t = 2s is :
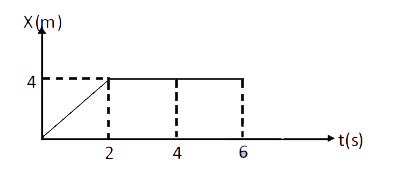 A0.2kgms−1B0.02kgms−1C0.1kgms−1D0.4kgms−1
In the figure given below, the position time graph of a particle of mass 0.1kg is shown. The impulse at t=2 sec is
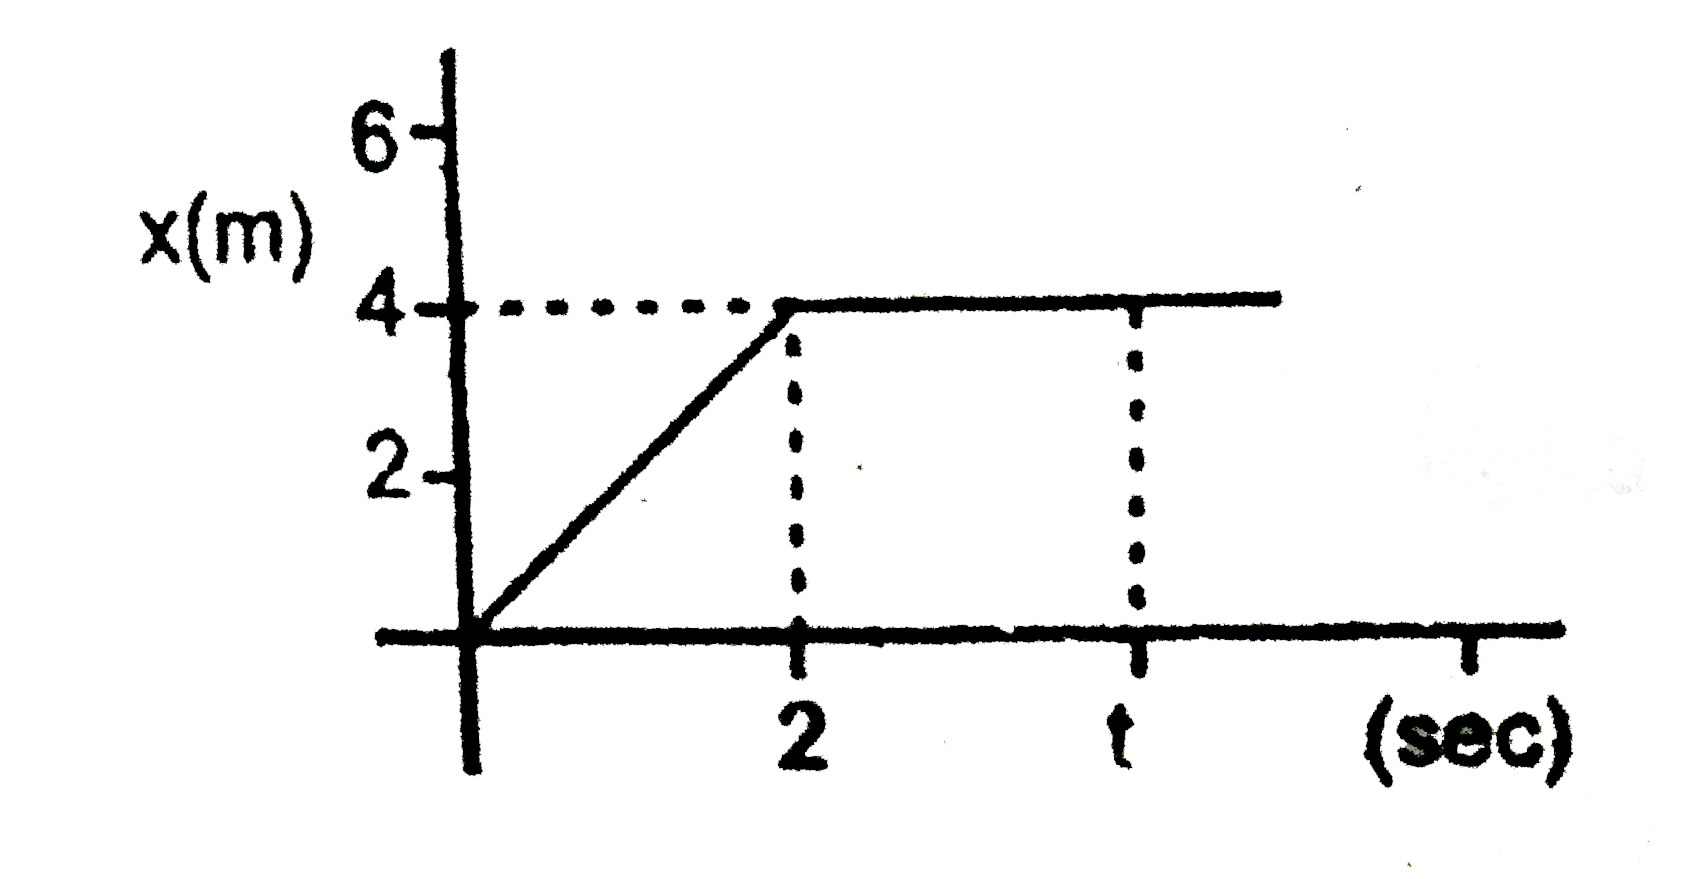 A0.2gkm/secB−0.2kgmsec−1C0.1kgmsec−1D−0.1kgm/sec
In the figure given below, the position–time graph of a particle of mass 0·1 kg is shown. The impulse at t=2sec is
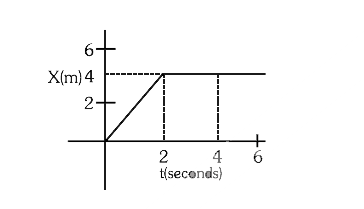 A0⋅2 kgmsec −1B−0⋅2 kgmsec −1C0⋅1 kgmsec −1D−0⋅4 kgmsec −1
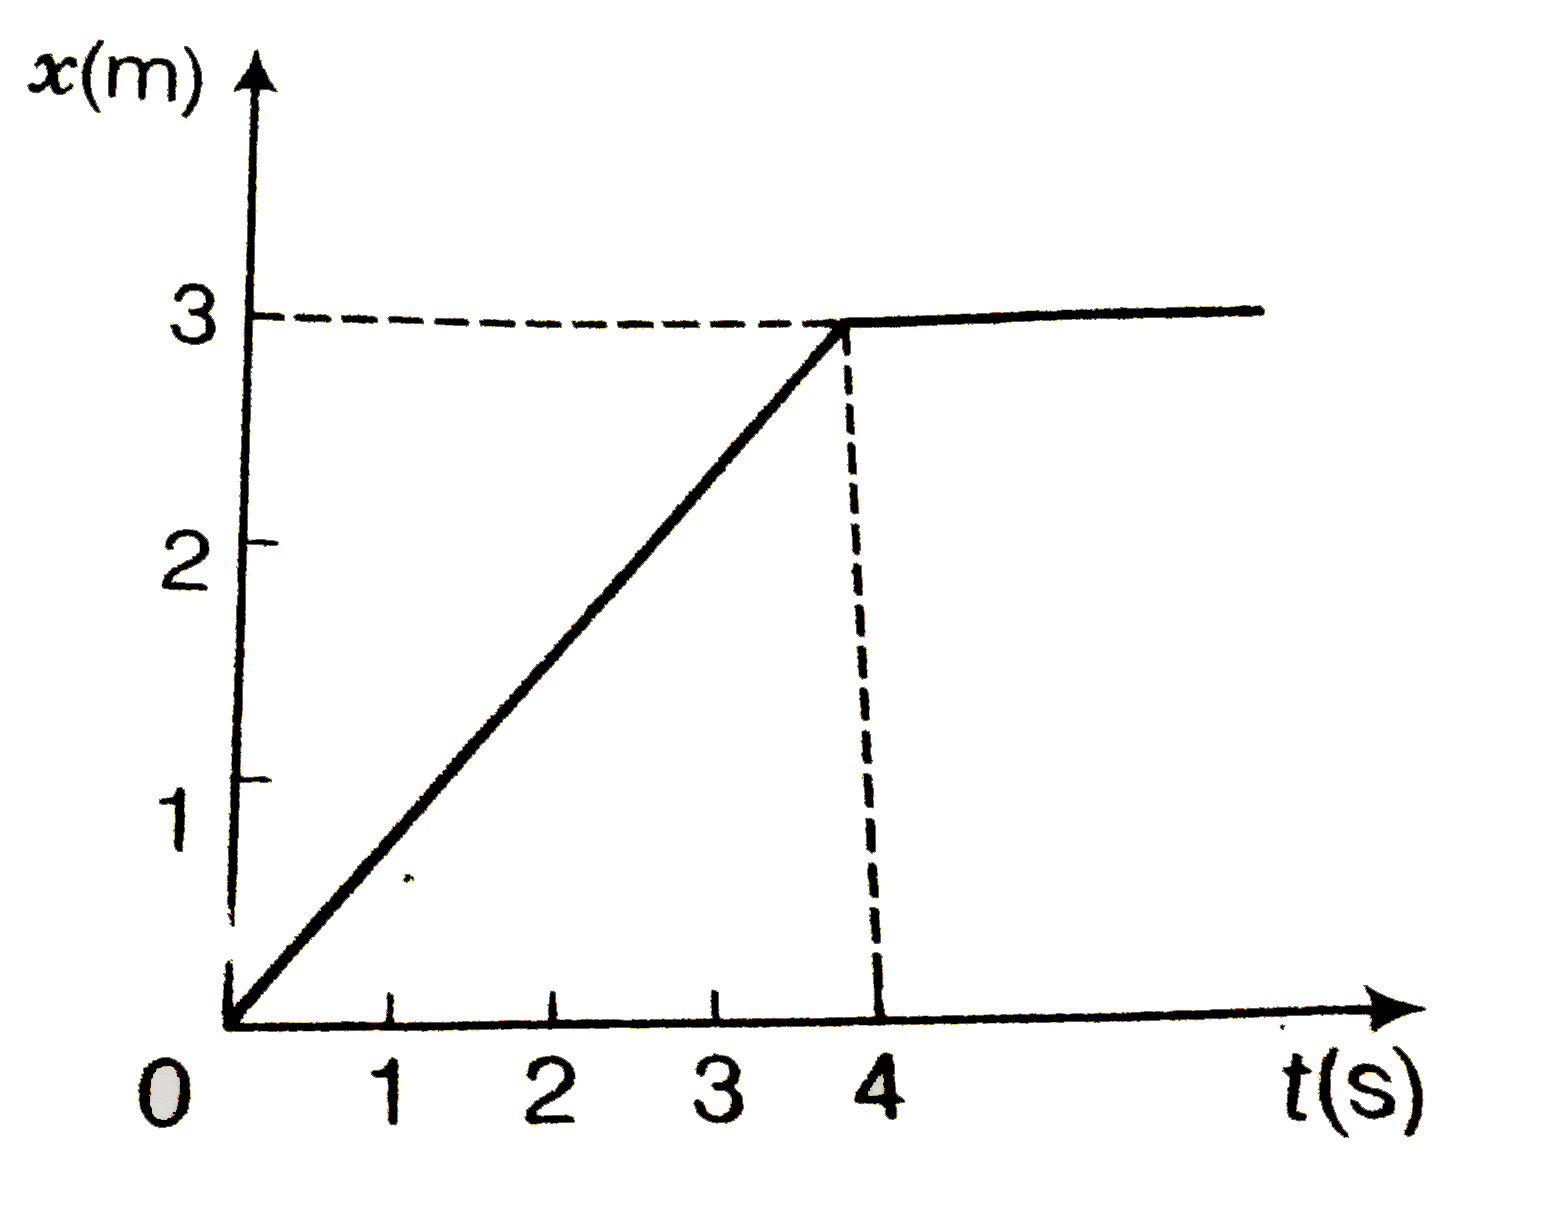
The position time graph of a body of mass 2kg is as given in What is the impulse on the body at t=0 s and t=4s ?
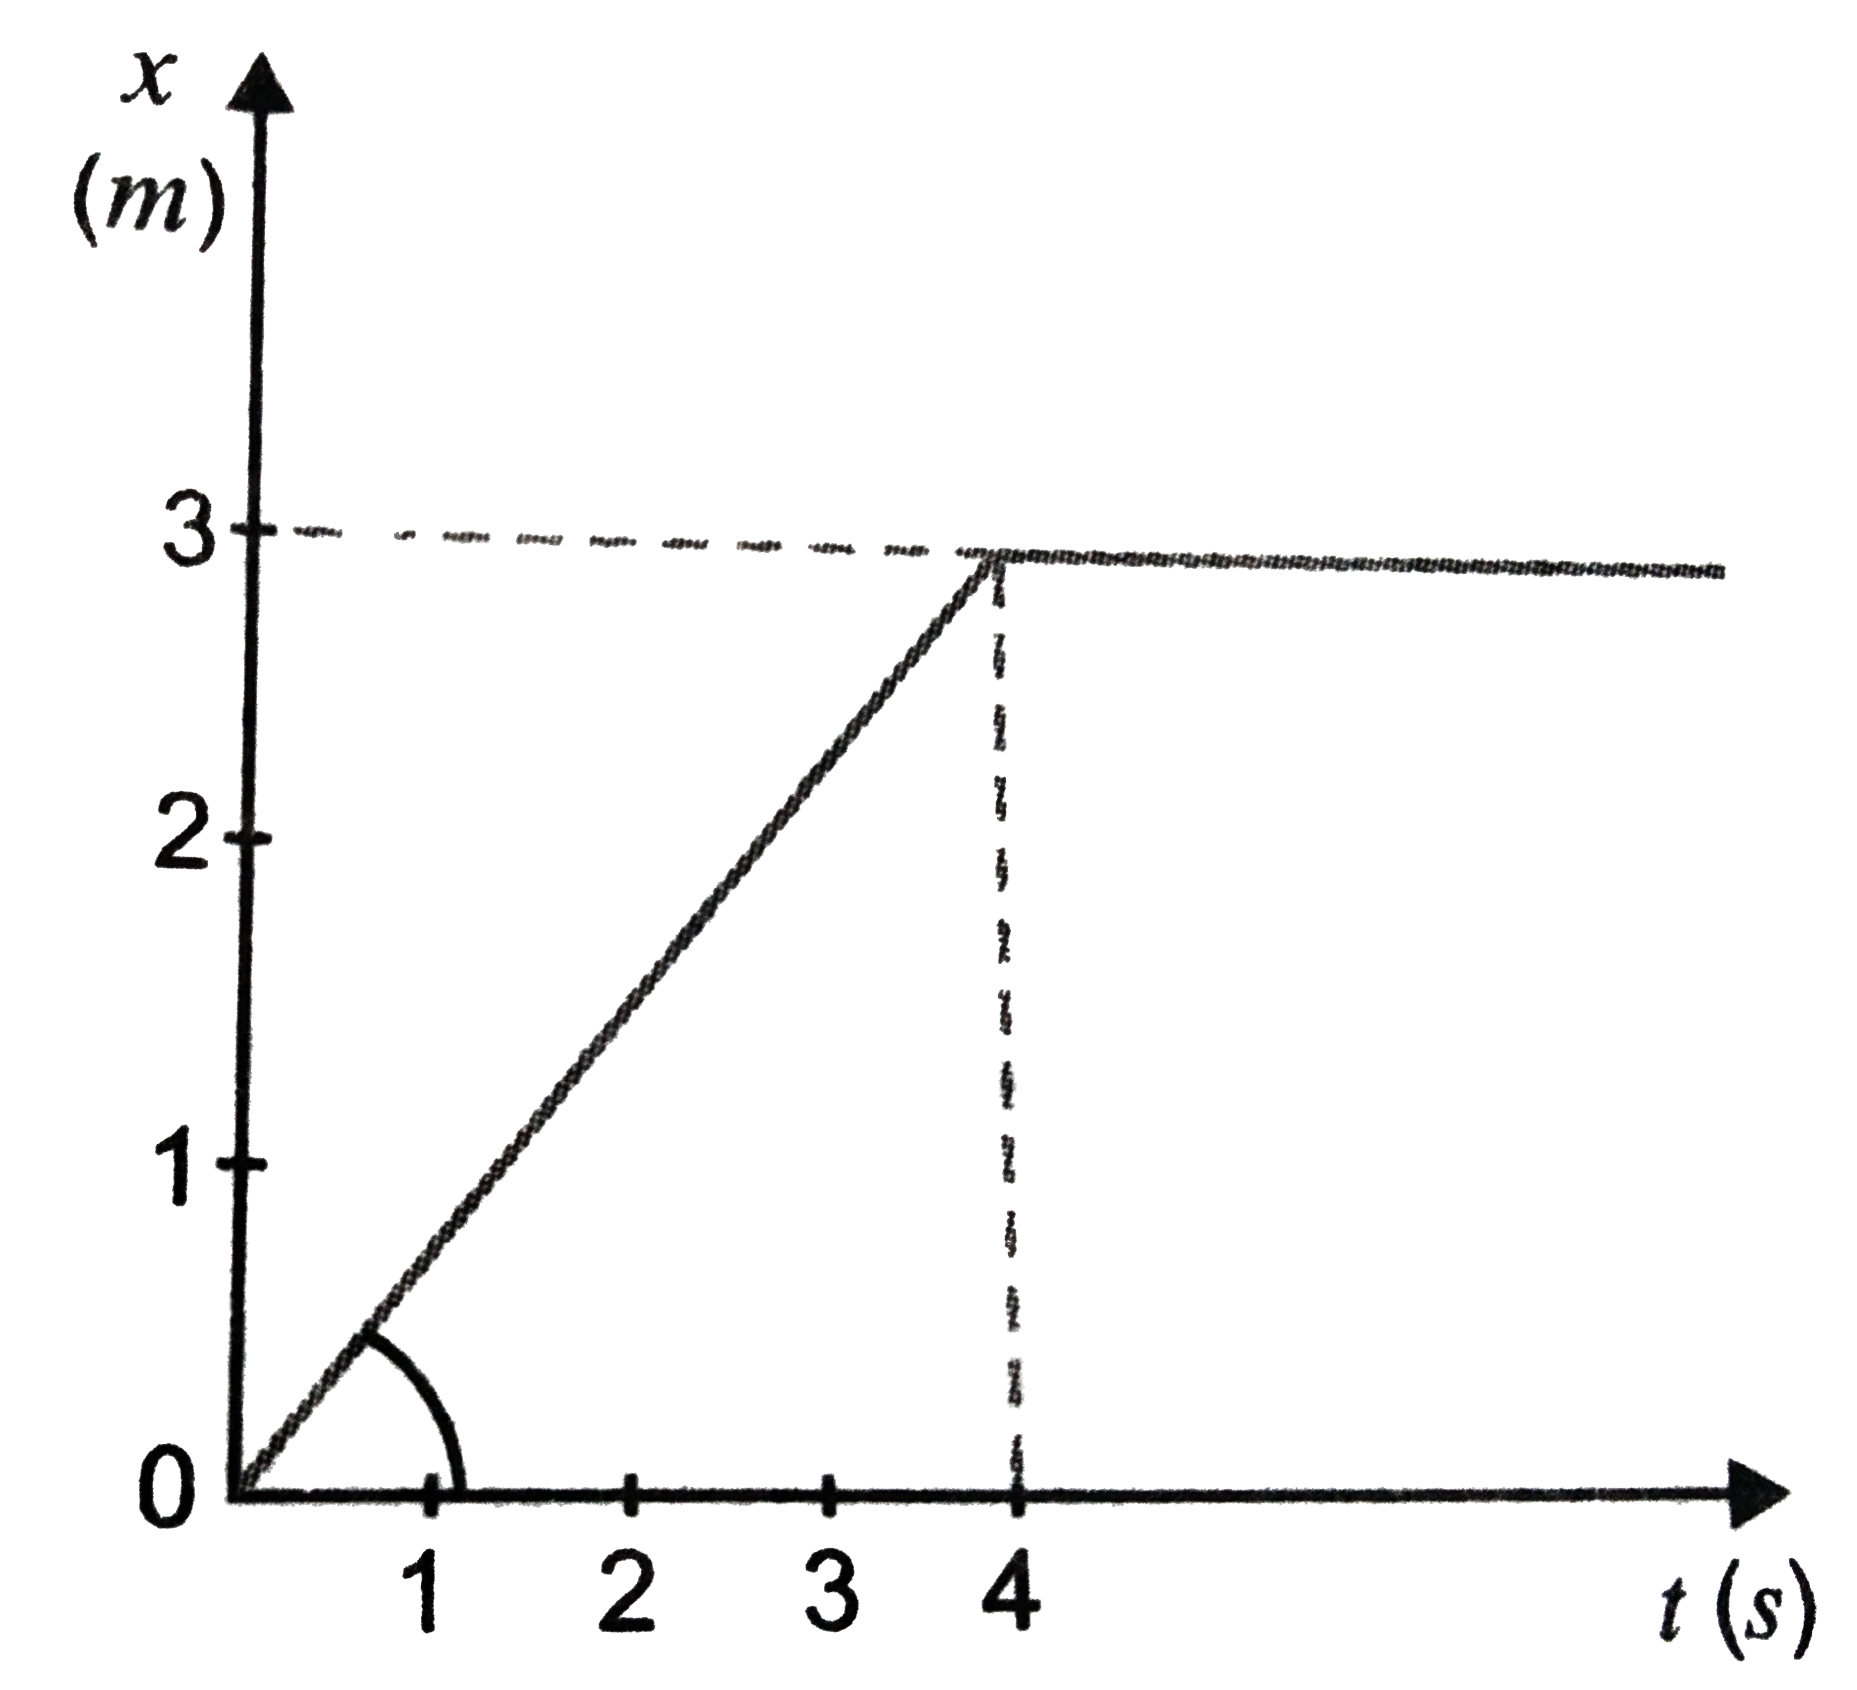 .
.
View SolutionThe position-time graph of a body of mass 2 kg is as given in figure . What is the impulse on the body at t = 0 s and t = 4 s .
View SolutionIn the figure given below, the position-time graph of a particle of mass 0.1kg is shown. The impuslse at t=2 sec is
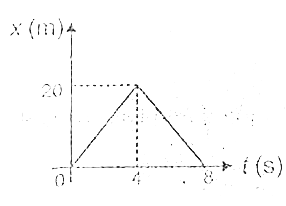
View SolutionThe position (X)-time (t) graph for a particle of mass 1 kg moving along x-axis is shown in figure. Find impulse on particle at t = 4 s.
View SolutionIn the figure given below, the position-time graph of a particle of mass 0.1kg is shown. The impuslse at t=2 sec is

View Solution
