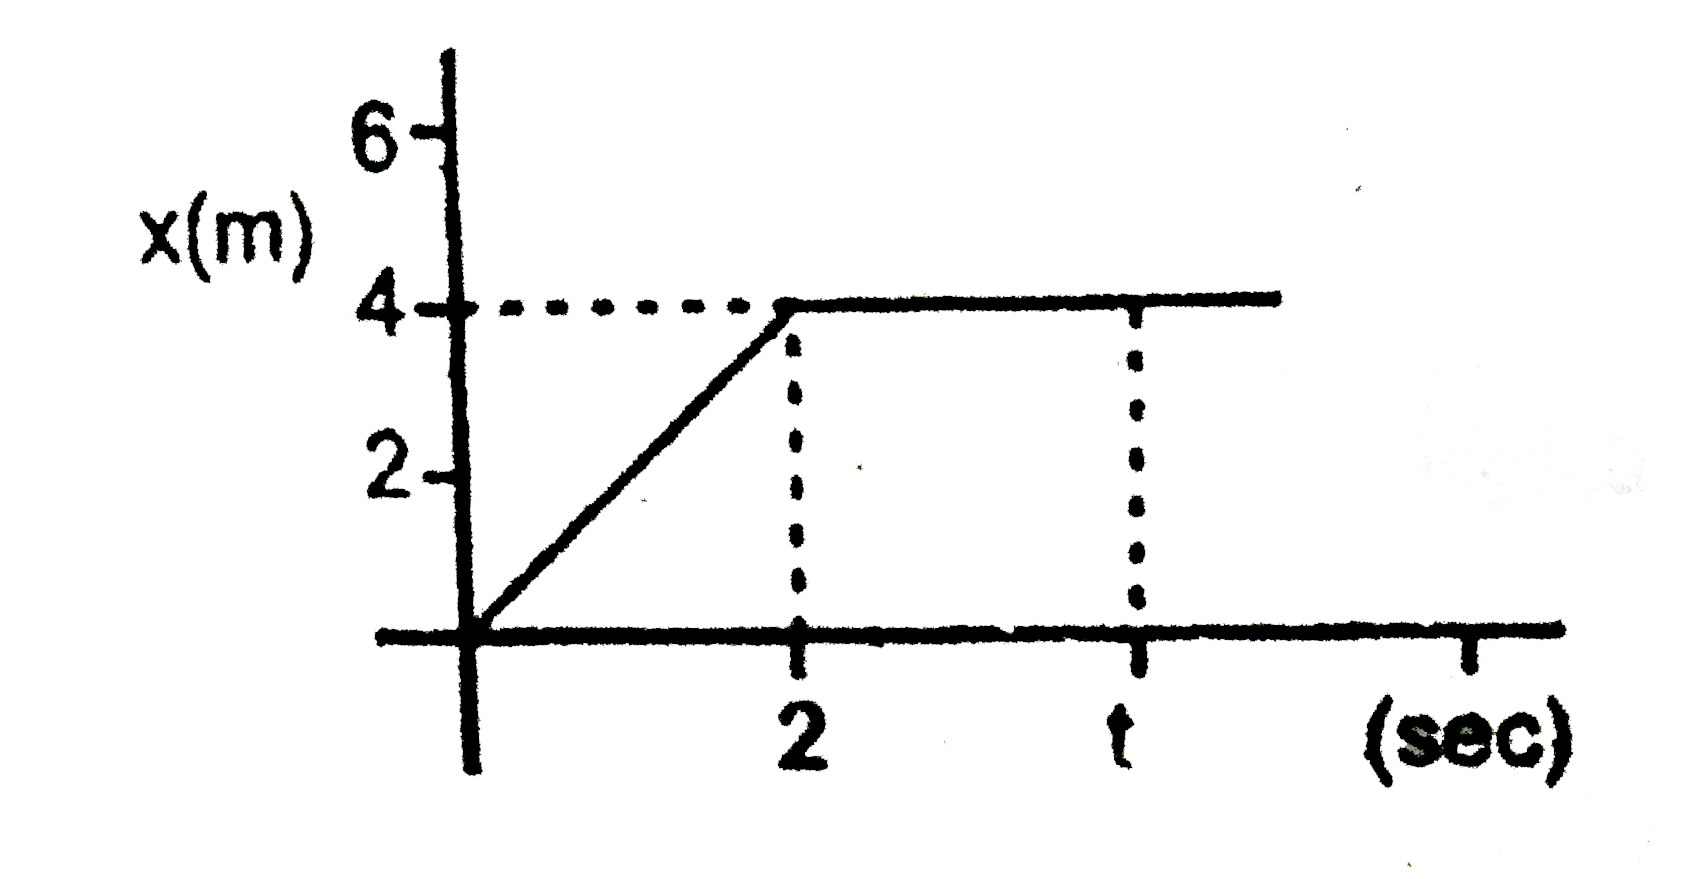
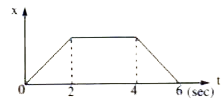
In the figure given below, the position time graph of a particle of mass 0.1kg is shown. The impulse at t=2 sec is
The correct Answer is:A
Impulse = change in momentum
Similar Questions
In the figure given below, the position-time graph of a particle of mass 0.1kg is shown. The impuslse at t=2 sec is
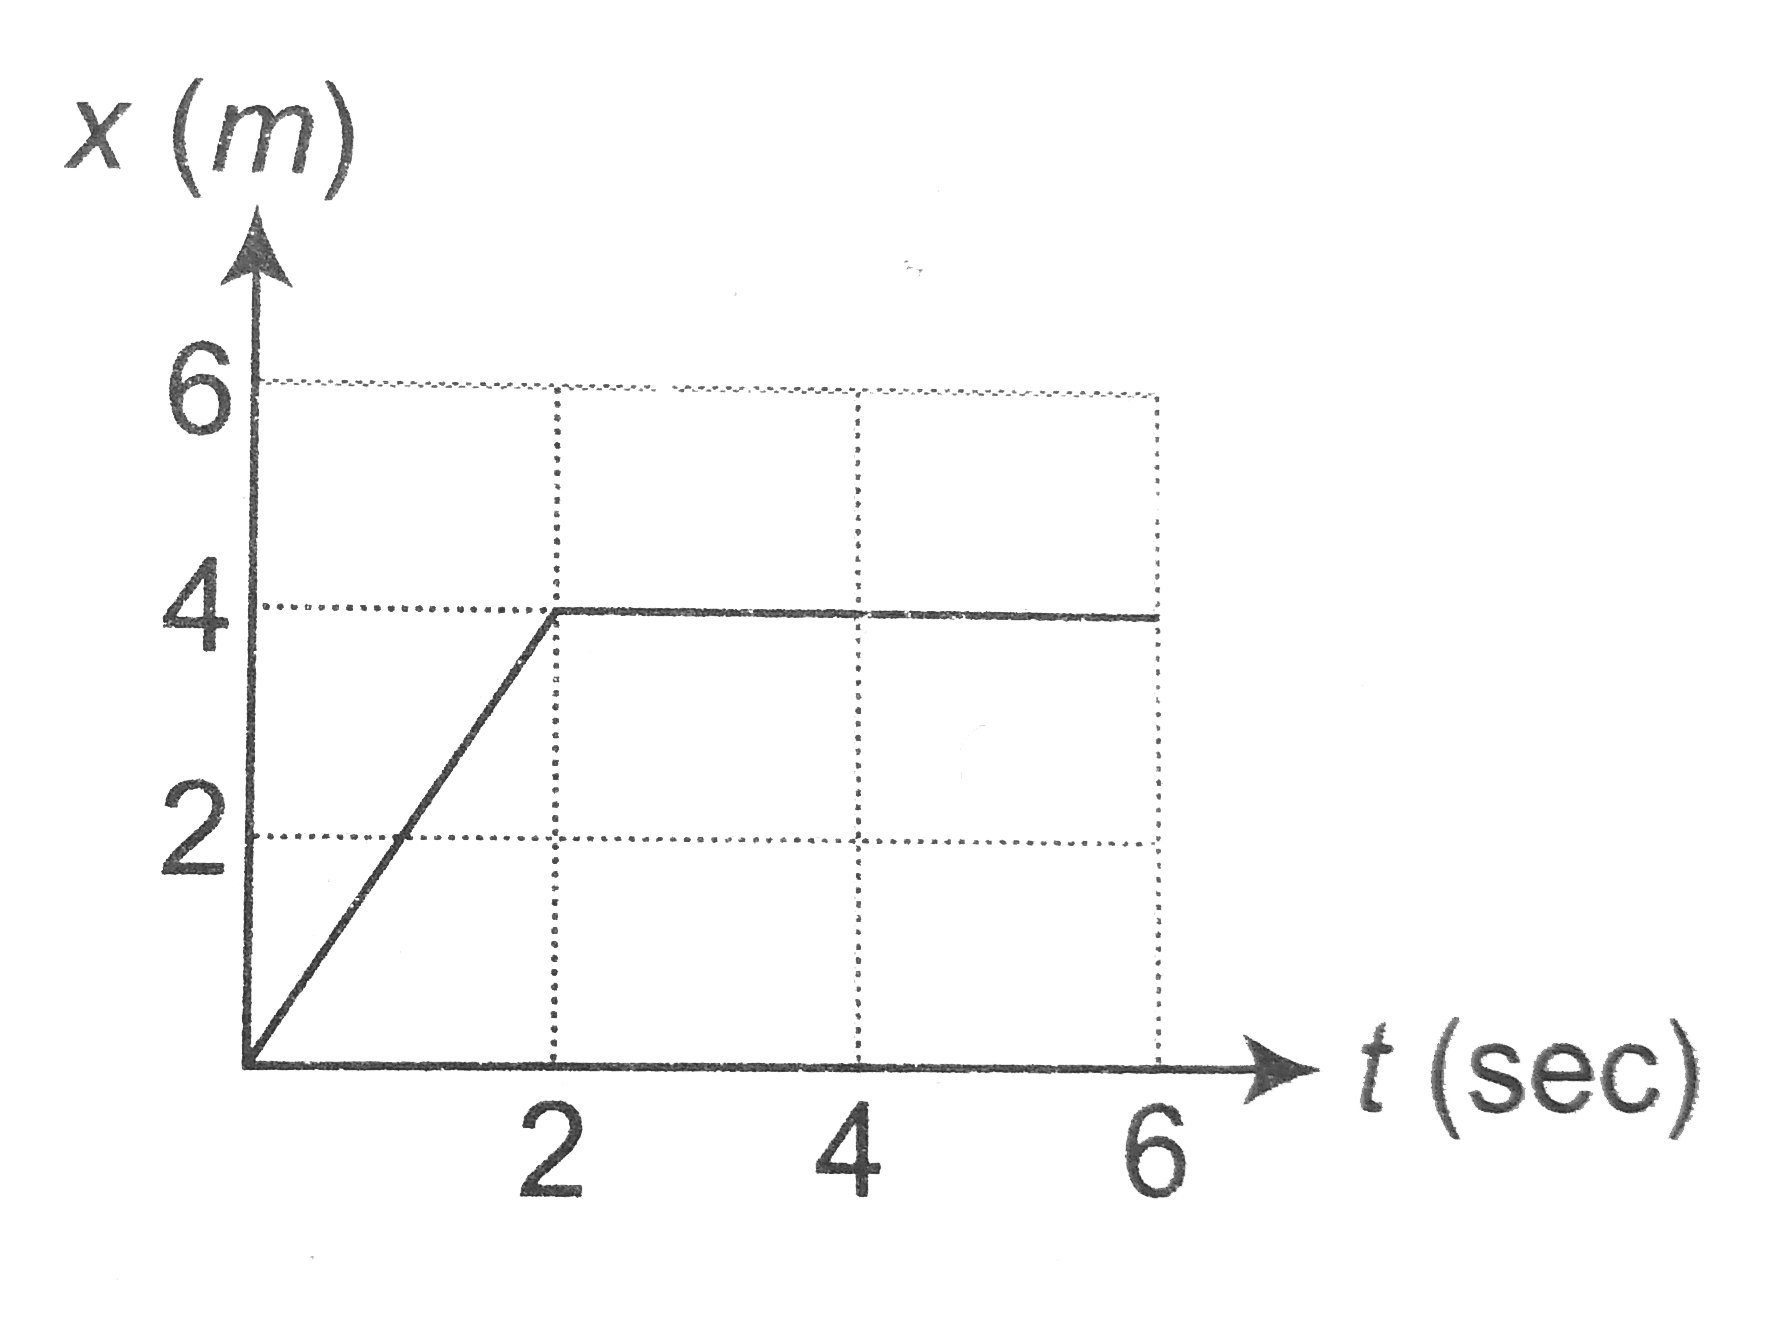
View SolutionIn the figure, the position time graph of a particle of mass 0.1 kg is shown. The impulse at t=2 second is :
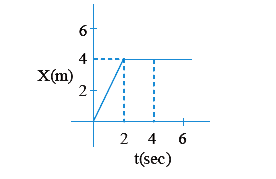
View SolutionThe figure shows the position time graph of a particle of mass 40 kg. What is the force acting on the particle of 0<t<4 s
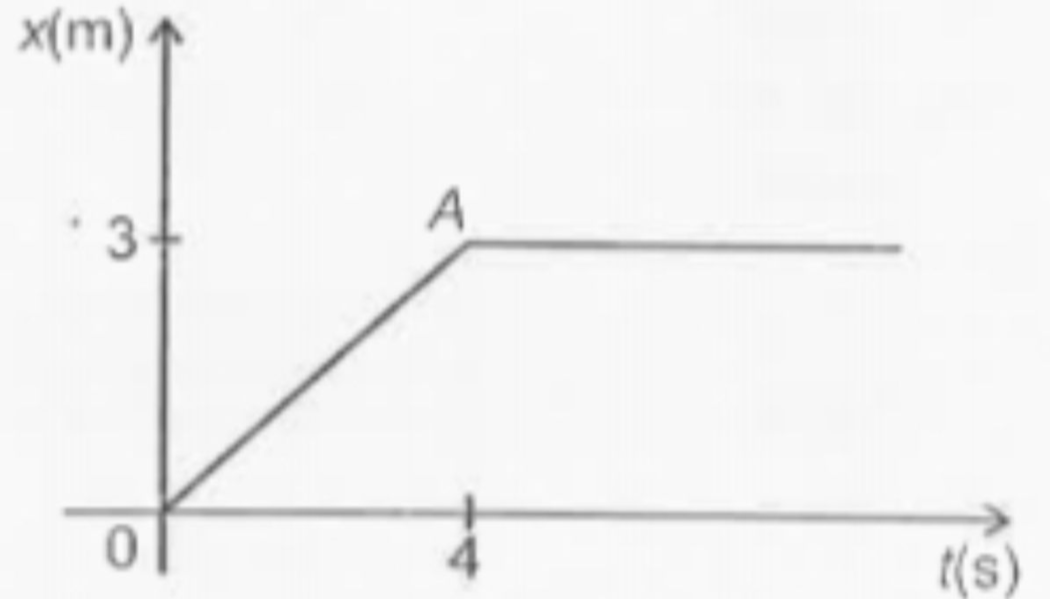
View SolutionThe velocity − time graph of a particle is as shown in figure

View SolutionThe position - time graph for a particle is shown in fig. Then in the time interval of (0, 6sec)
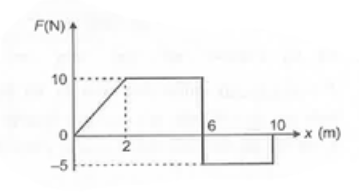
View SolutionThe force versus position (F-x) graph of a particle of mass 2 kg is shown in the figure. If at x = 0 velocity of particle is 2 m/s then velocity of the particle at x = 8 m will be
View SolutionFigure shows the position-time graph of a particle of mass 0.04kg. Suggest a suitable physical context for this motion. What is the time between two consecutive impulses received by the particle? What is the magnitude of each impulse?
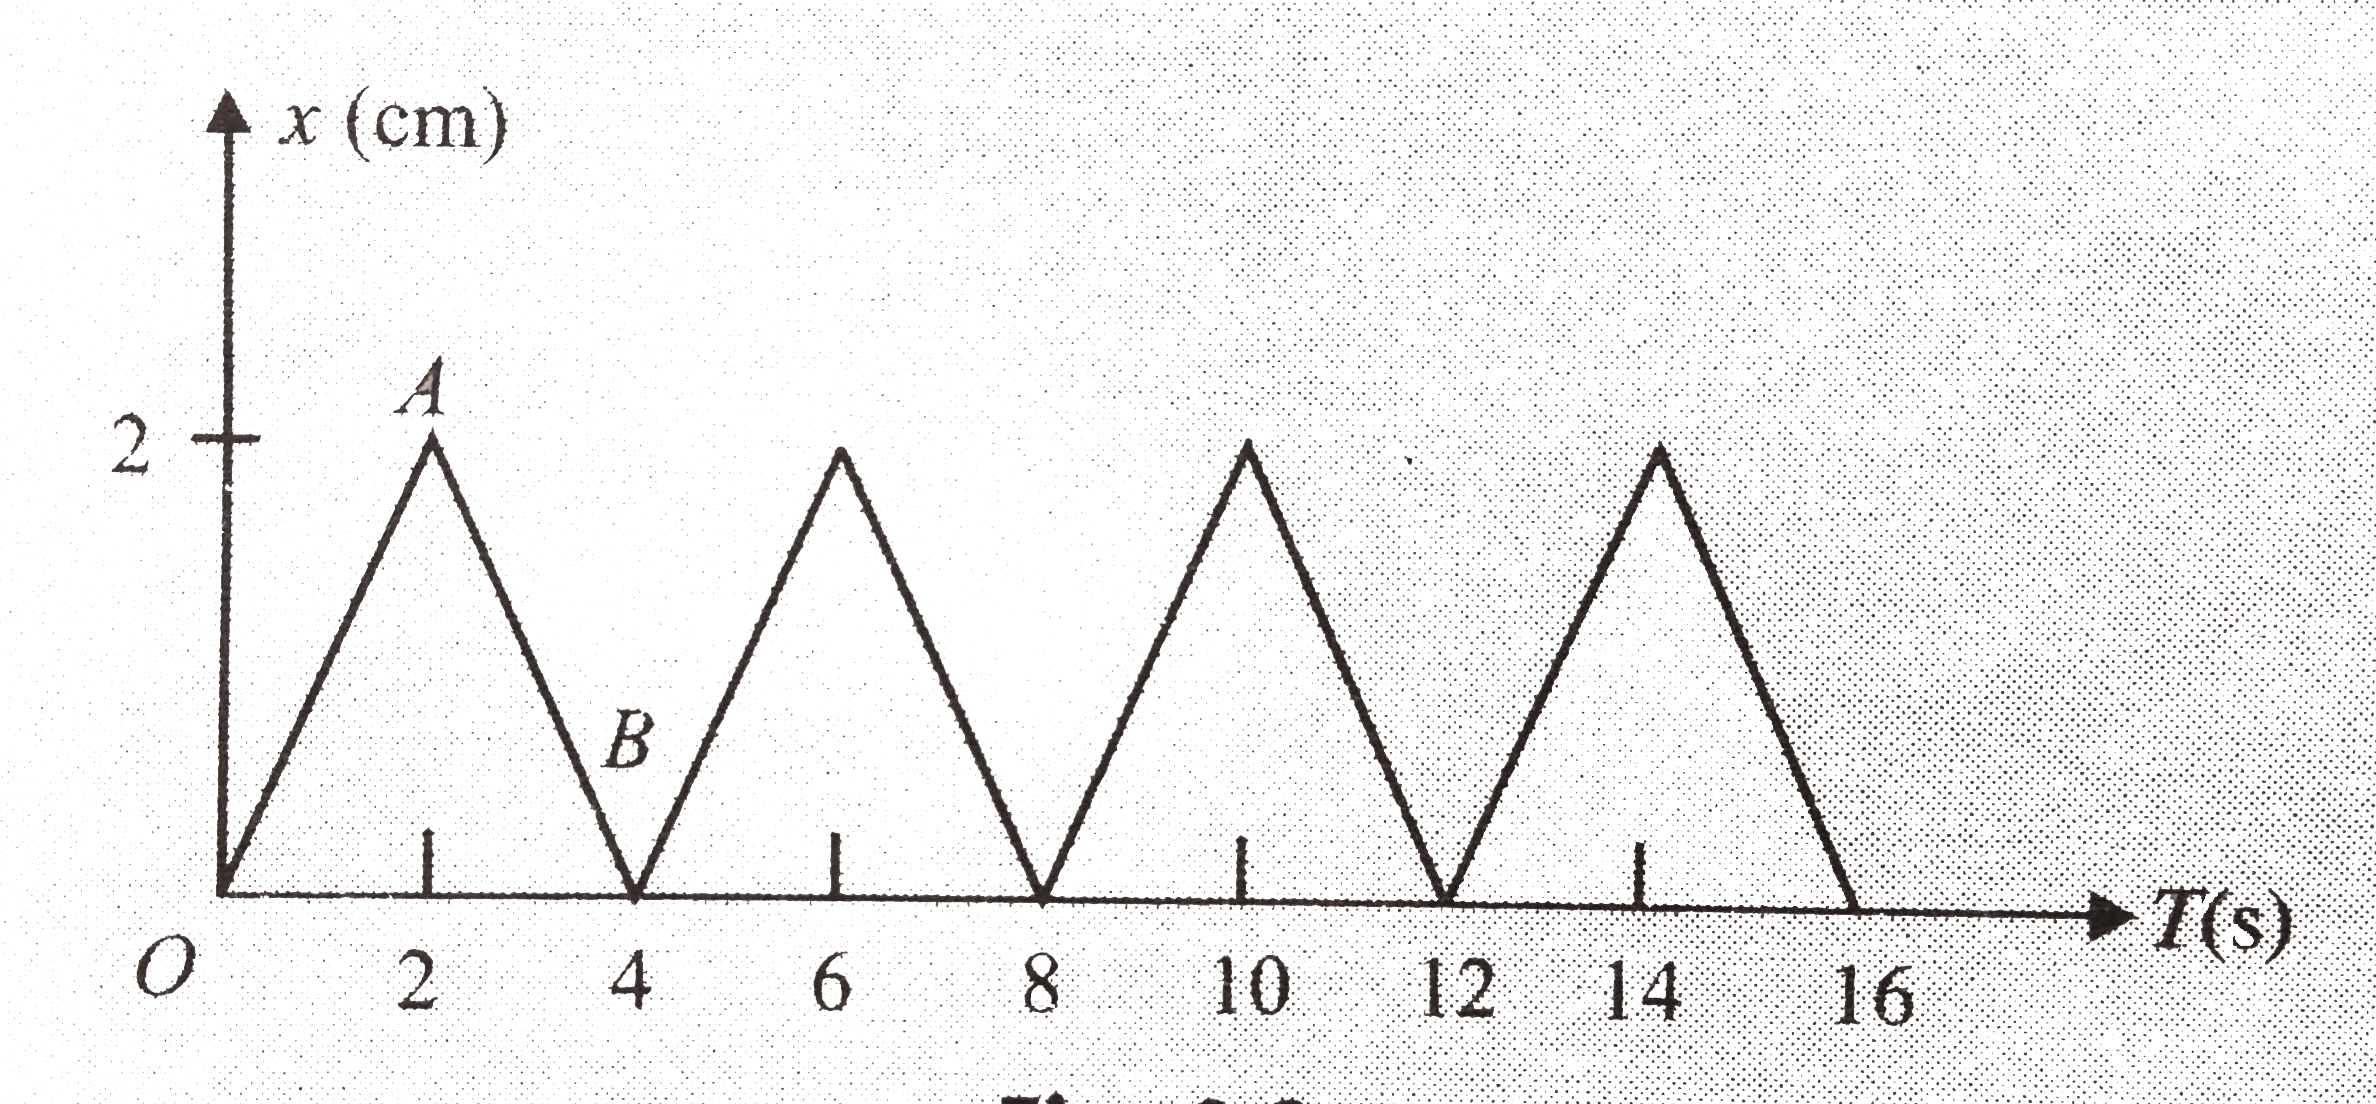
View SolutionFigure shows the position-time graph of a particle of mass 0.04kg. Suggest a suitable physical context for this motion. What is the time between two consecutive impulses received by the particle? What is the magnitude of each impluse?

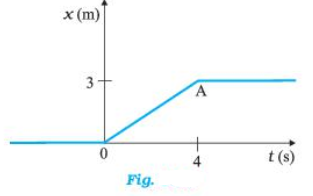
View SolutionFig. shows the position-time graph of a particle of mass 4 kg. What is the (i) force acting on the particle for t<0,t<4s,0<t<4s? (ii) impulse at t = 0 and t = 4 s? Assume that the motion is one dimensional.
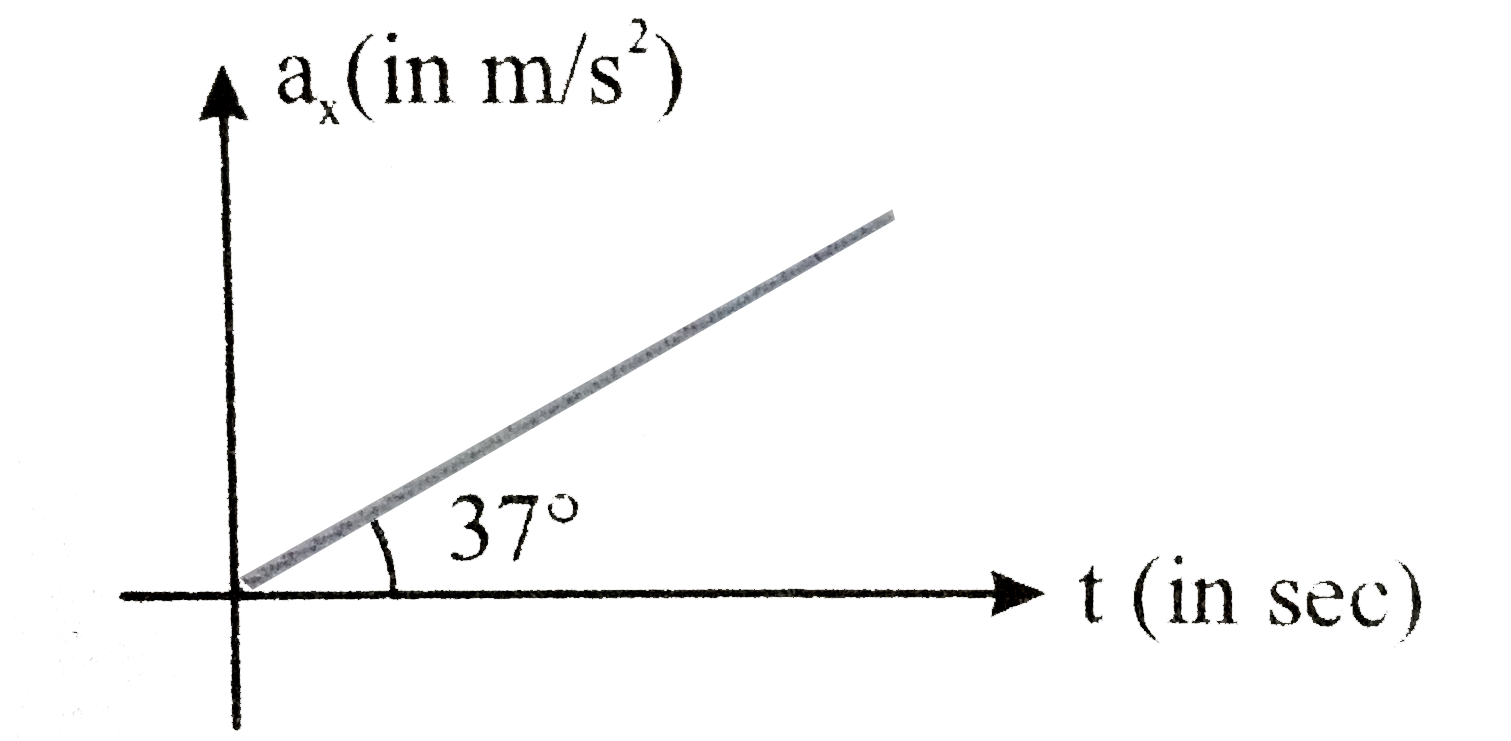
View SolutionIn the figure the variation of components of acceleration of a particle of mass is 1kg is shown w.r.t. time. The initial velocity of the particle is →u=(−3i+4j)m/s. The total work done by the resultant force on the particle in time from t=0 to t=4 seconds is :
 .
.
View Solution
