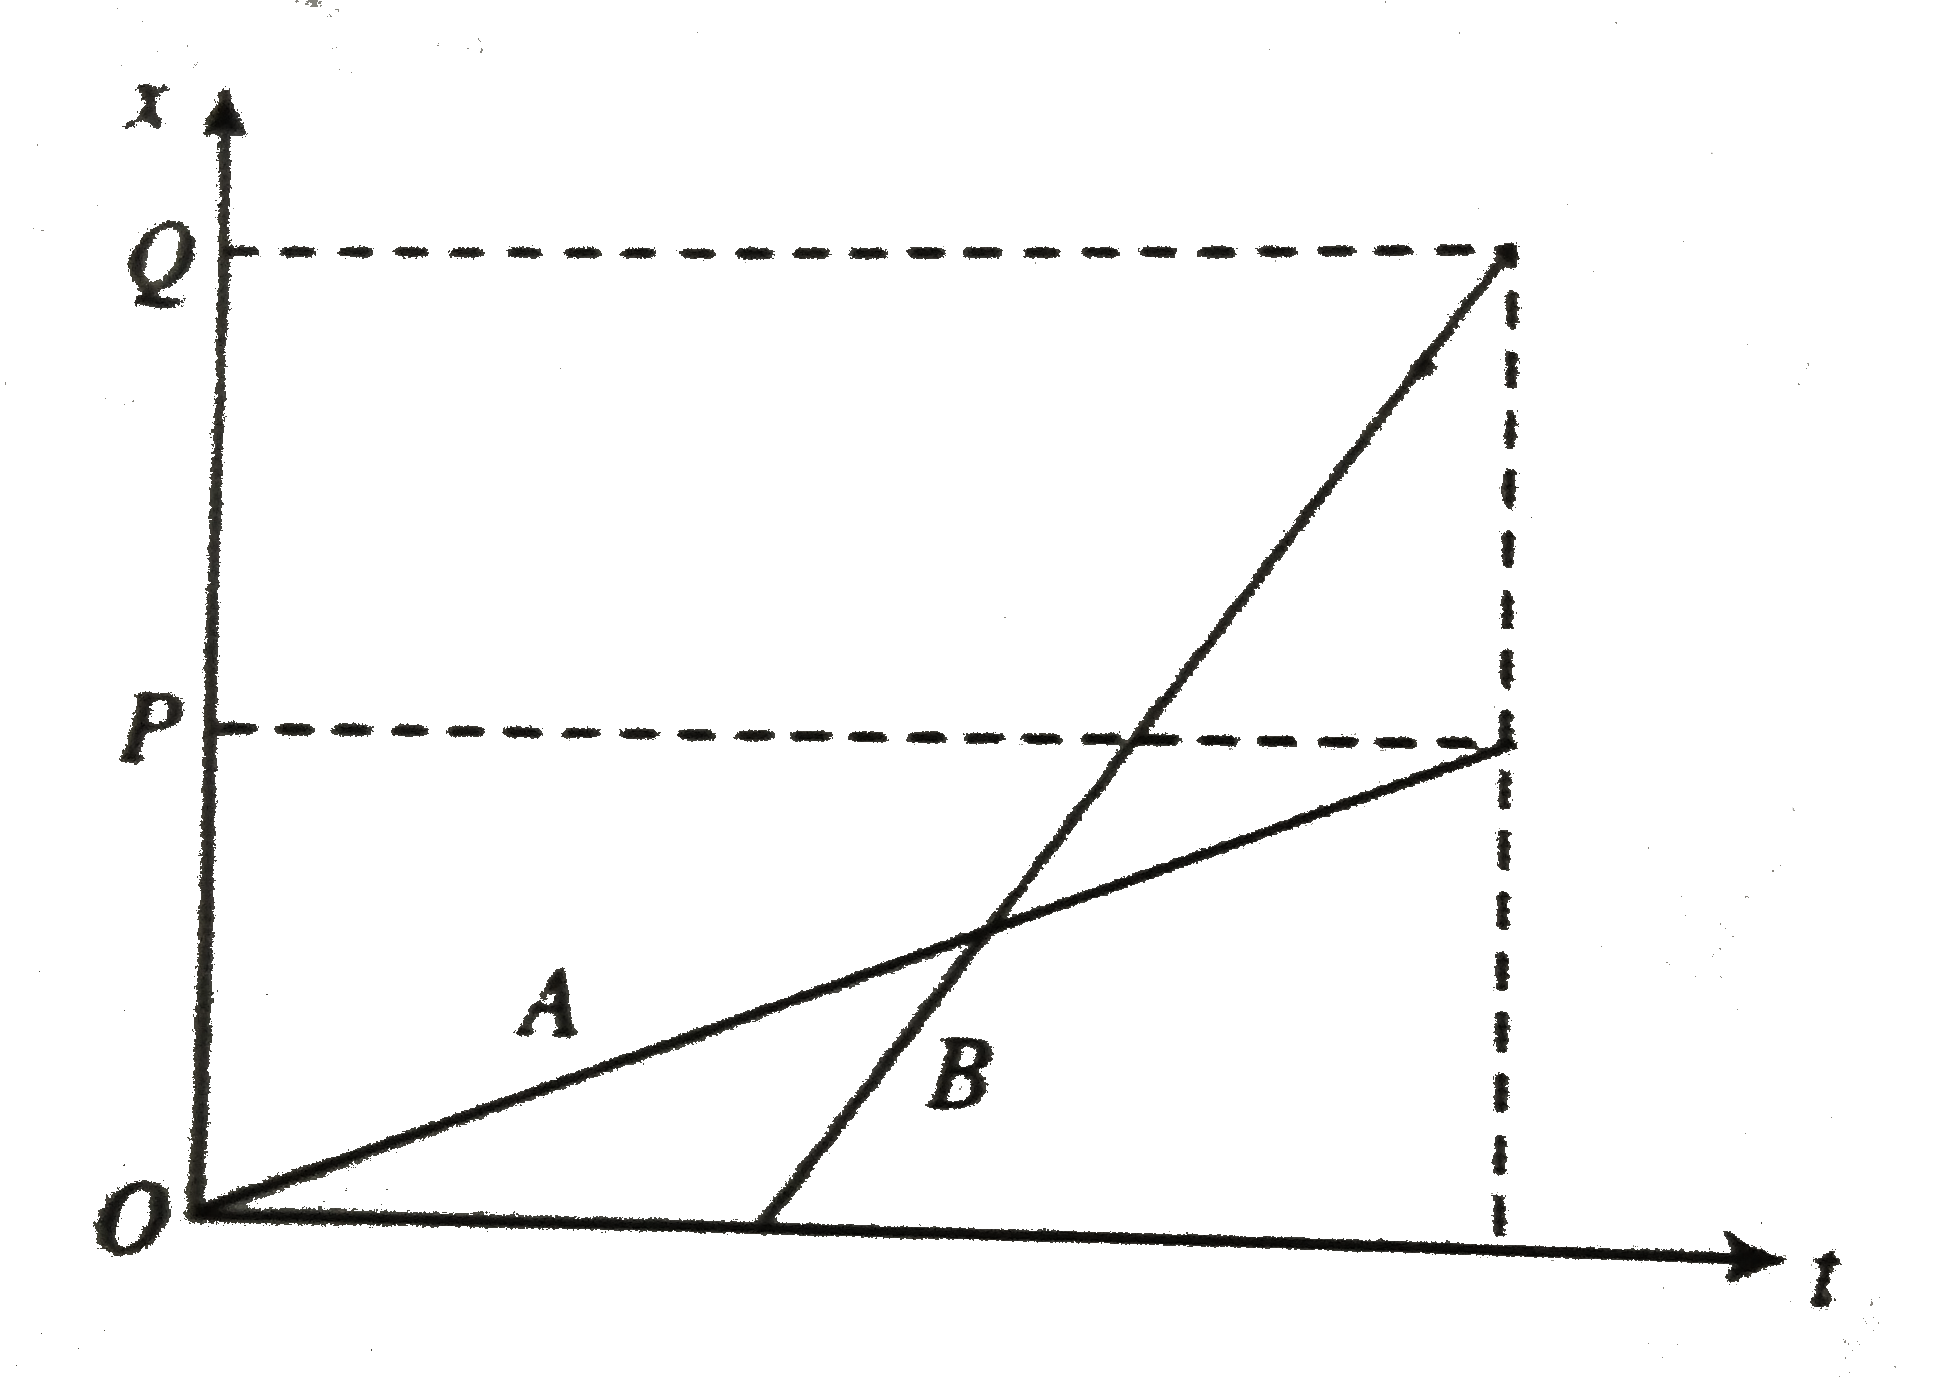
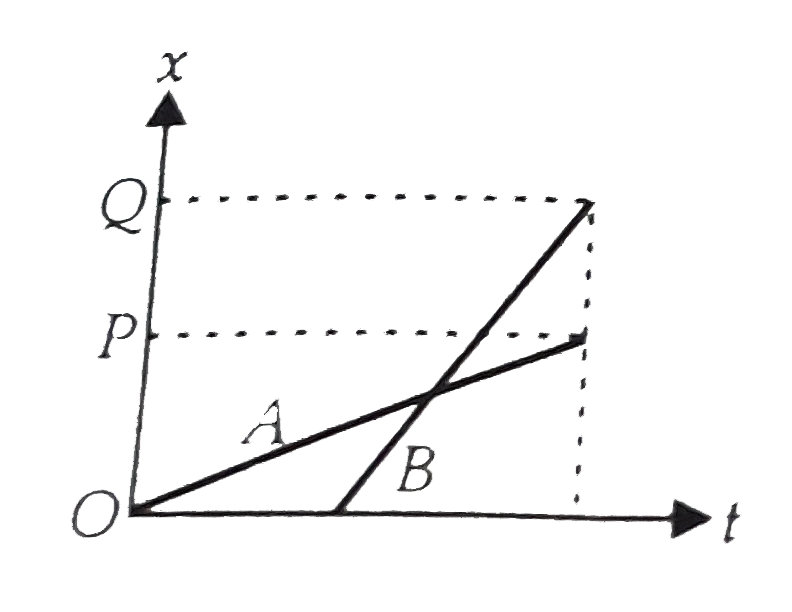
The position-time (x-t) graphs for two children A and B returning from their school O to their homes P and Q, respectively, are shown in . Choose the
 .
.
a.(A/B) Iives closer to school than (B/A).
b. (A/B) starts from the school earlier than (B/A).
c. (A/B) walks faster than (B/A).
d. A and B reach home at the (same//differnt) time.
e. (A//B) overtakes on the road (once//twice).
A live closer to the school than B.
A starts from the school earlier than B.
A walks faster than B.
A and B reach home at the same time.
The correct Answer is:C
(a) As OP lt OQ, A lives closer to the school than B. Hence, option (a) is correct.
(b) For x = 0, t = 0 for A, while t has some finite value for B. Therefore,
A starts from the school earlier than B. Hence, option (b) is correct.
Slope of x-t graph is equal to the speed. Since the slope of x-t graph for B is greater than that for A. Therefore, B walks faster than A. Hence, option (c ) is incorrect.
(d) Corresponding to points P and Q the value of t fromm x-t graphs for A and B is same. Thus, both A and B reach home at the same time. Hence, option (d) is correct.

Topper's Solved these Questions
- MOTION IN A STRAIGHT LINEBOOK - NCERT FINGERTIPSCHAPTER - MOTION IN A STRAIGHT LINEEXERCISE - Acceleration
19 Videos
- MOTION IN A STRAIGHT LINEBOOK - NCERT FINGERTIPSCHAPTER - MOTION IN A STRAIGHT LINEEXERCISE - Kinematic Equations For Uniformly Accelerated Motion
32 Videos
- MOTION IN A STRAIGHT LINEBOOK - NCERT FINGERTIPSCHAPTER - MOTION IN A STRAIGHT LINEEXERCISE - Average Velocity And Average Speed
8 Videos
- MOTION IN A PLANE BOOK - NCERT FINGERTIPSCHAPTER - MOTION IN A PLANE EXERCISE - Assertion And Reason
15 Videos
- OSCILLATIONS BOOK - NCERT FINGERTIPSCHAPTER - OSCILLATIONS EXERCISE - Assertion And Reason
15 Videos
Similar Questions
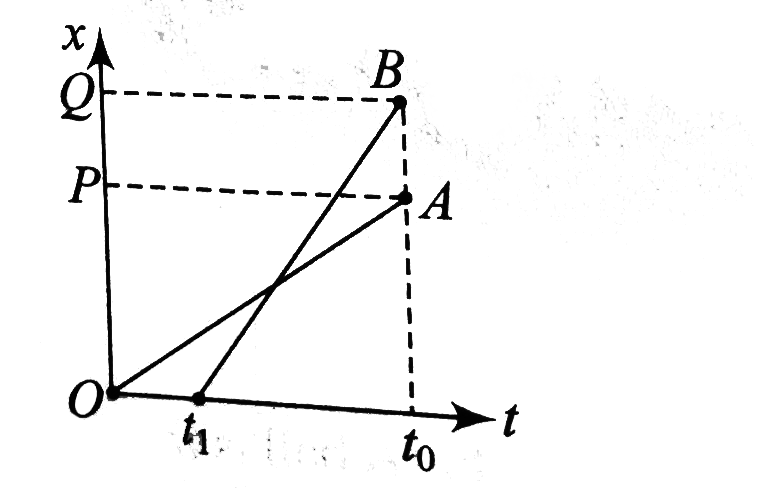
The position-time (x-t) graphs for two children A and B returning from their school O to their homes P and Q, respectively, are shown in figure. P Choose the correct answer.

(i) A and B reach home at the (same/different) time.
(ii) A or B overtakes on the road (once/twice).
View SolutionPosition time graph of two particles A and B are as shown in figure. Velocity of A w.r.t. B is
View Solution
Knowledge Check

The position-time (x-t) graphs for two children A and B returning from their school O to their homes P and Q respectively along straight line path (taken as x-axis) are shown in figure. Choose the correct statement (s):AA lives closer to the school BBA starts from the school earlier than BCA and B have equal average velocities from 0 to t0.DB overtakes A on the wayA is taller than B. C is taller than A. D is taller than E but shorter than B. Who is the tallest?
ACBACDDBVelocity time graphs of particles A and B moving along x-axis are shown here. Both A and B start from origin:
 AMaximum separation between the particles is 8mBMaximum separation between the particles is 10mCMaximum separation between the particles occurs at t=6sDMaximum separation between the particles occurs at t=8s
A is 20 years older than B. He is also 6times as old as B. Then the respective ages of A and B are
View SolutionTwo trains start at same time from A and B towards each other and after crossing they take a and b sec in reaching B and A then ratio of speeds of A and B.
View SolutionA is 20 years older than B. He is also 6times as old as B. Then the respective ages of A and B are
View SolutionA is taller than B. C is taller than D, but shorter than E. B is shorter than D and D is taller than A. Who is the tallest?
View SolutionA and B started at the same time from the same place for a certain destination. B walking at 56 of A's speed reached the destination 1 hour 15 minutes after A. B reached the destination in
View Solution
