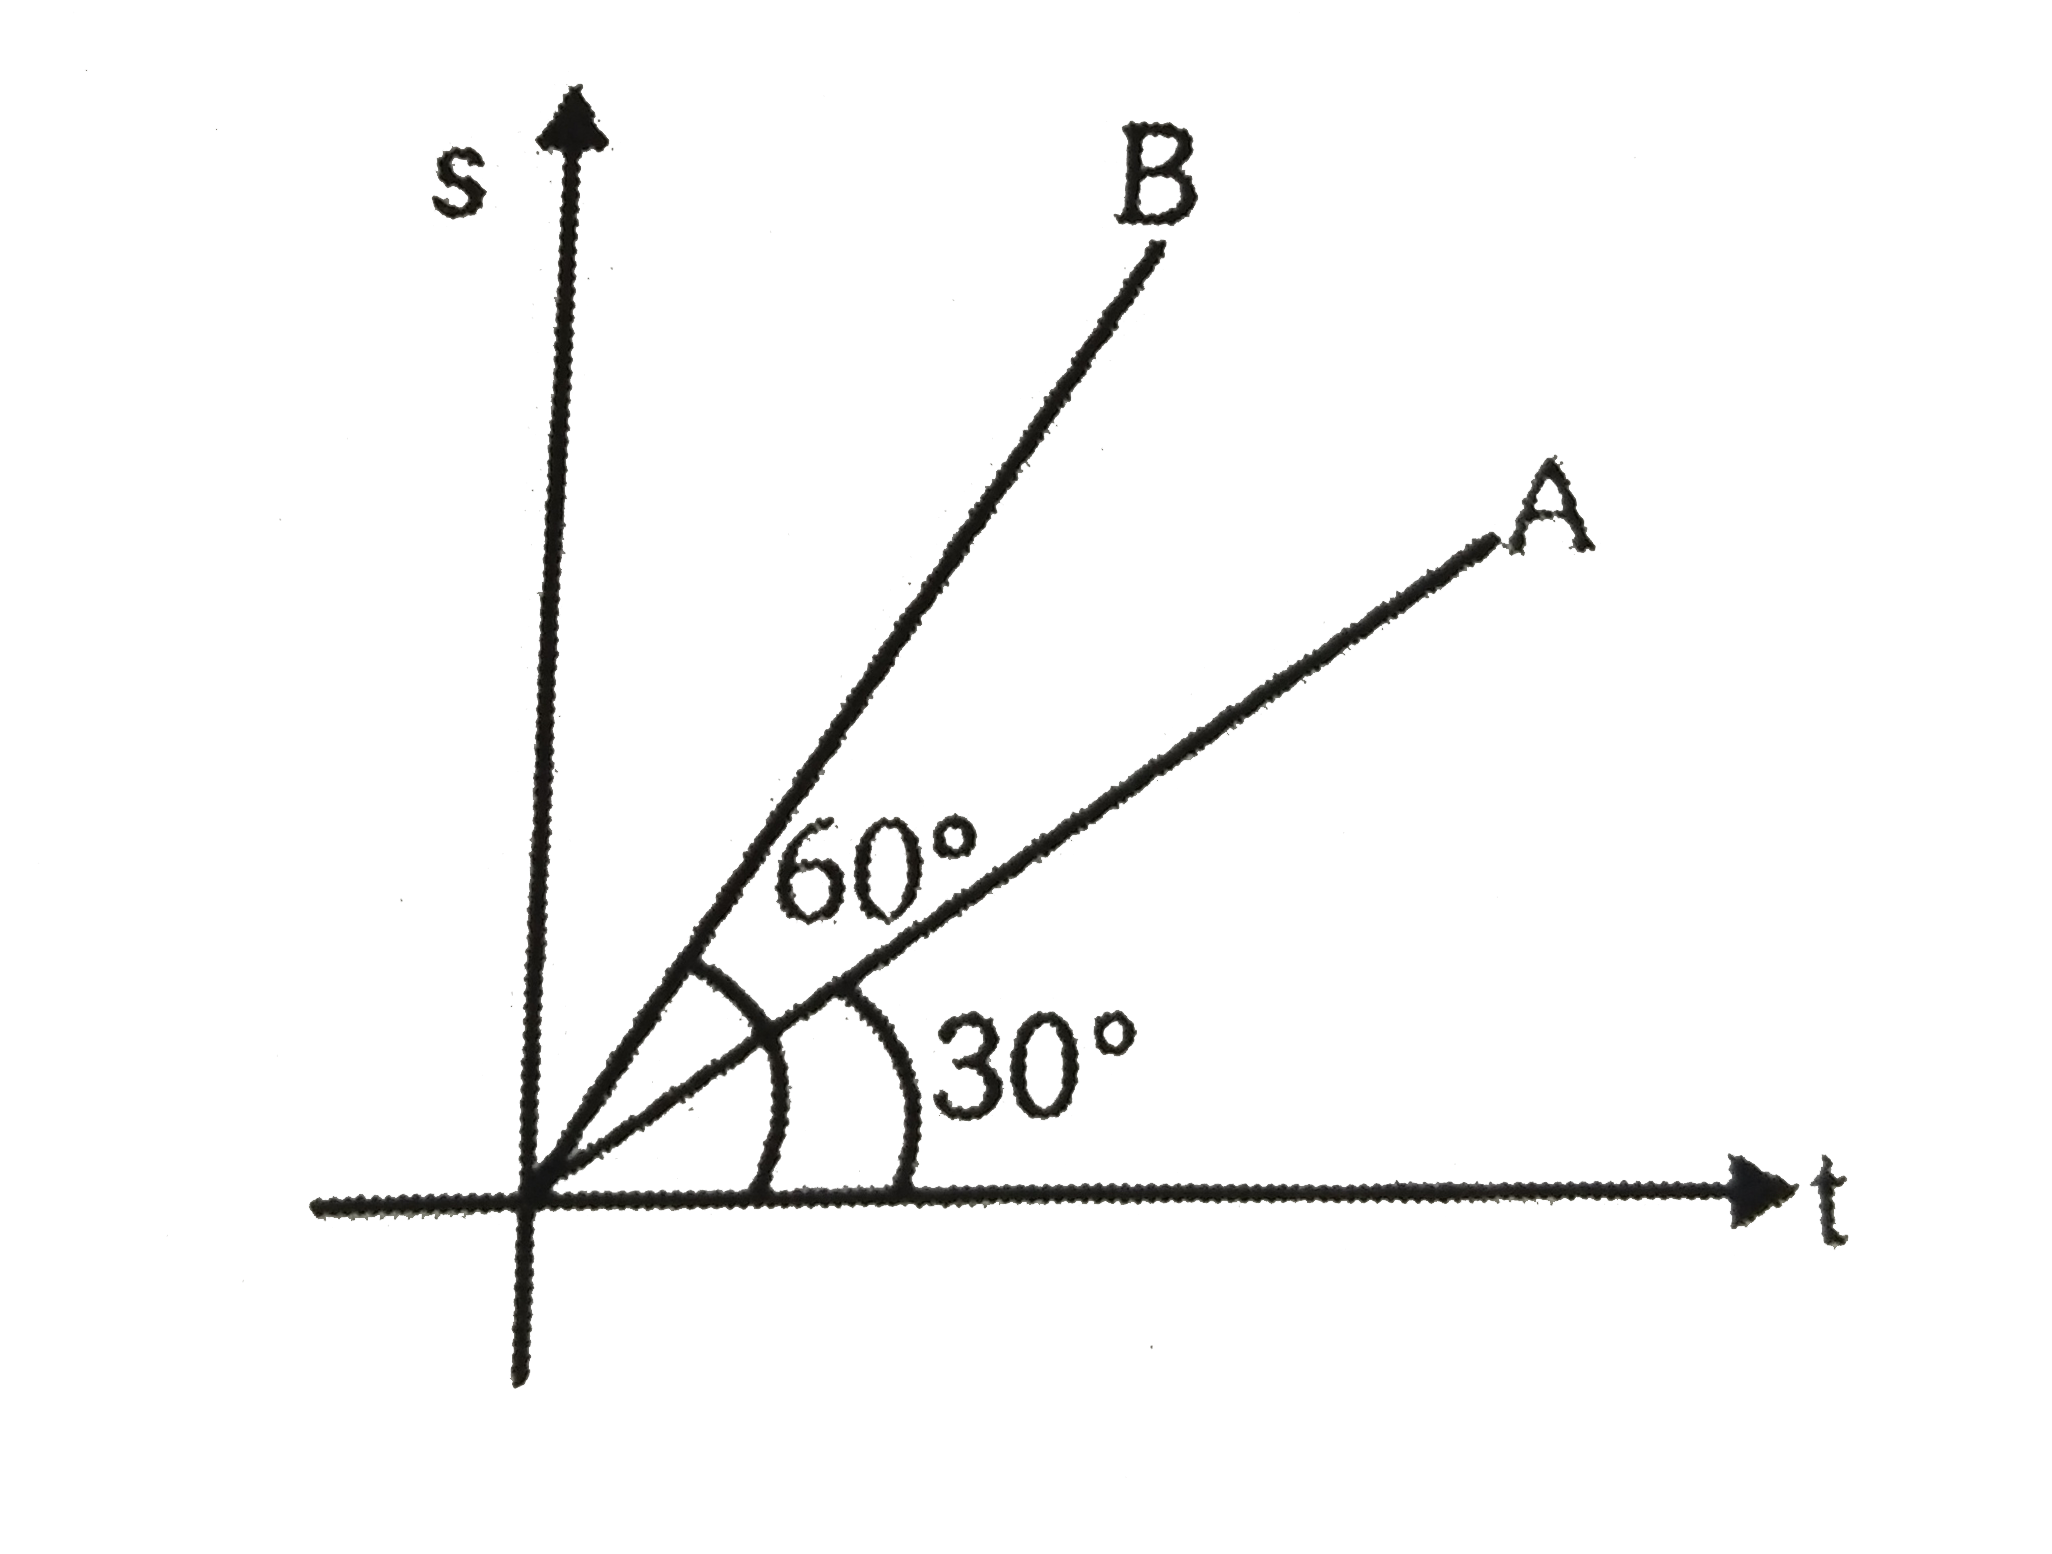
Position time graph of two particles A and B are as shown in figure. Velocity of A w.r.t. B is
Step by step video & image solution for Position time graph of two particles A and B are as shown in figure. Velocity of A w.r.t. B is by Physics experts to help you in doubts & scoring excellent marks in Class 12 exams.
Similar Questions
Knowledge Check
- Question 1 - Select One
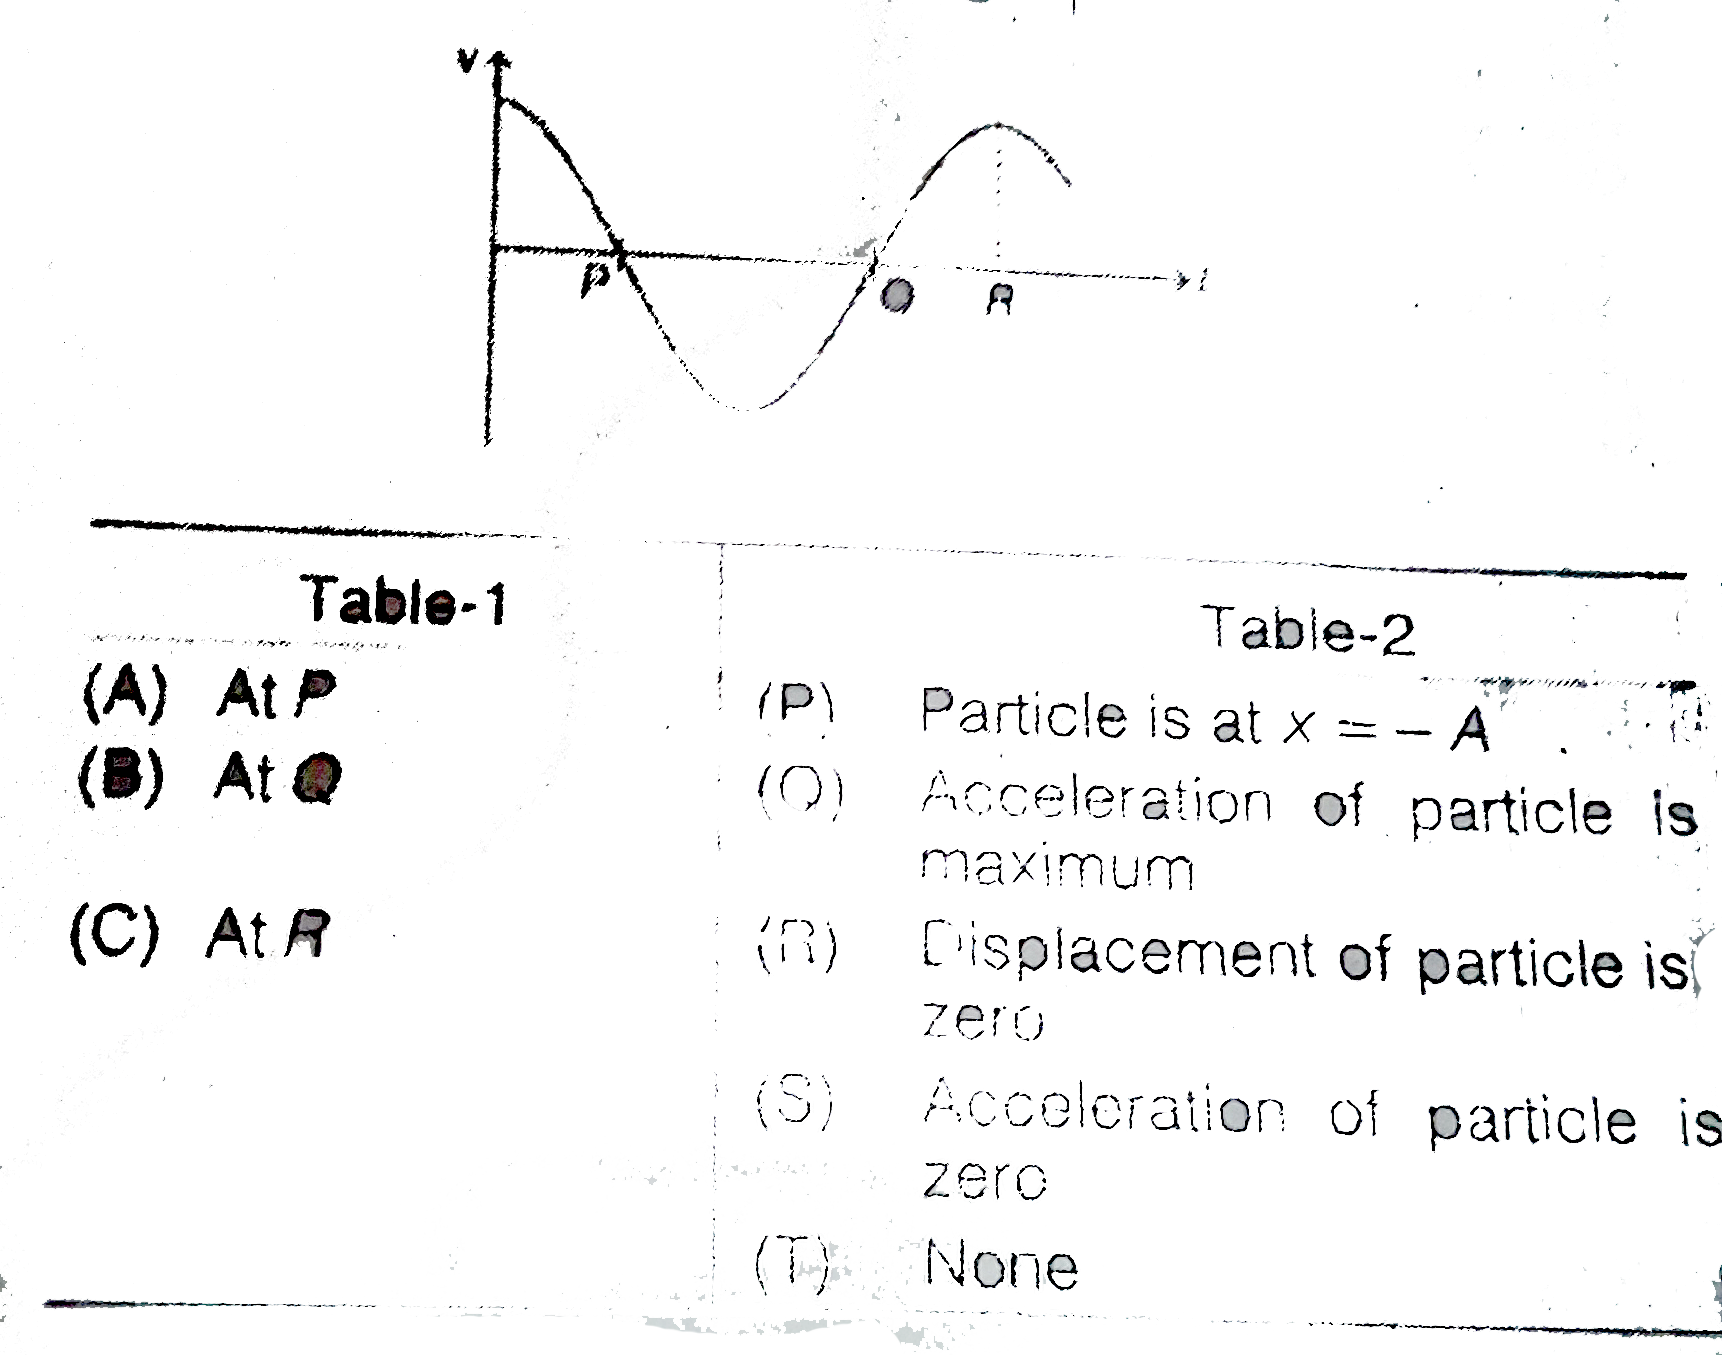
The velocity − time graph of a particle is as shown in figure
 AIt moves with a constant acceleration throughoutBIt moves with an acceleration of constant magnitude but changing direction at the end of every two secondCThe displacement of the particle is zeroDThe velocity becomes zero at t=4 second
 - Question 2 - Select One
The displacement time graphs of two bodies A and B are shown in figure. The ratio of velocity of A to velocity of B,vA/vB is:
 A1√3B√3C13D3
 - Question 3 - Select One
The velocity - time graph for two bodies A and B are shown in figure. Then, the acceleration of A and B are in the ratio
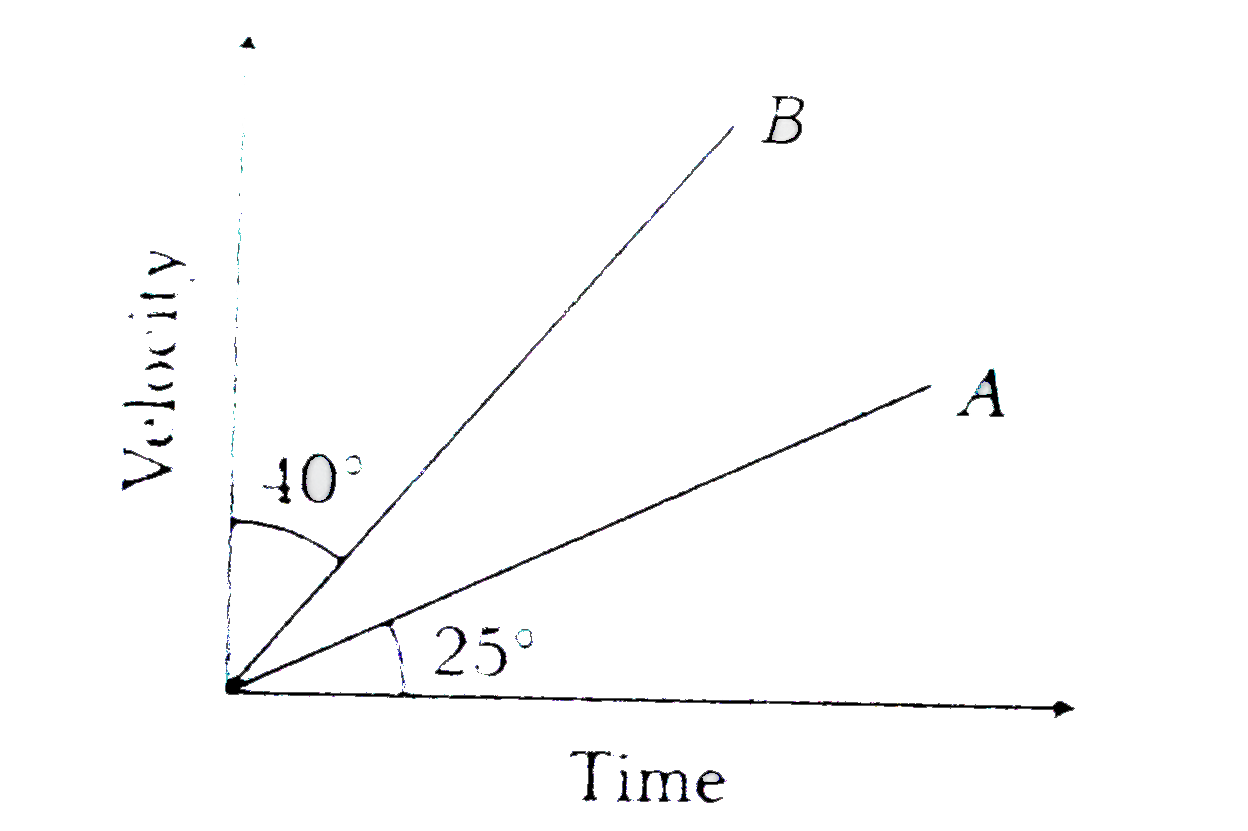 Asin25∘ to sin50∘Btan25∘ to tan40∘Ccos25∘ to cos50∘Dtan25∘ to tan50∘
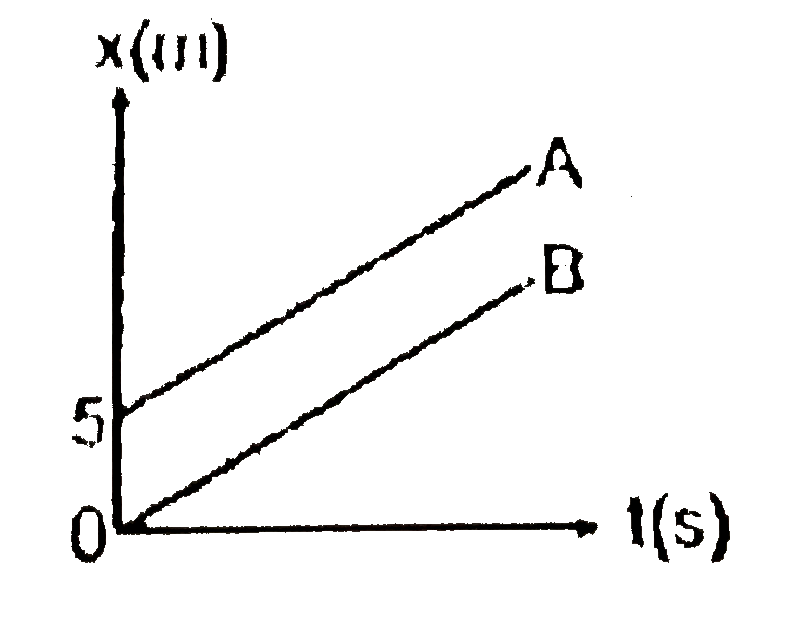
Figure shows position-time graph of two cars A and B.
 View Solution
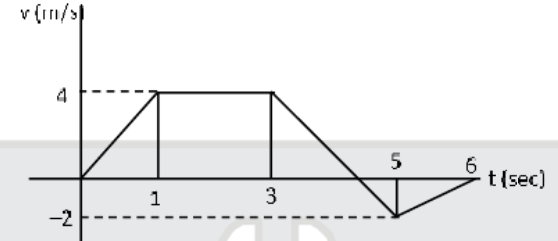
velocity time graph of a particle is shown in figure. Find displacement of the particle.
 View Solution
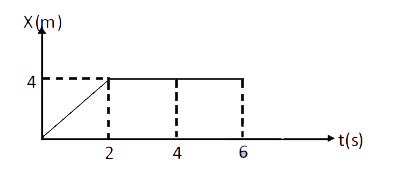
The position-time graph of a particle of mass 0.1 kg is shown. The impulse at t = 2s is :
 View Solution
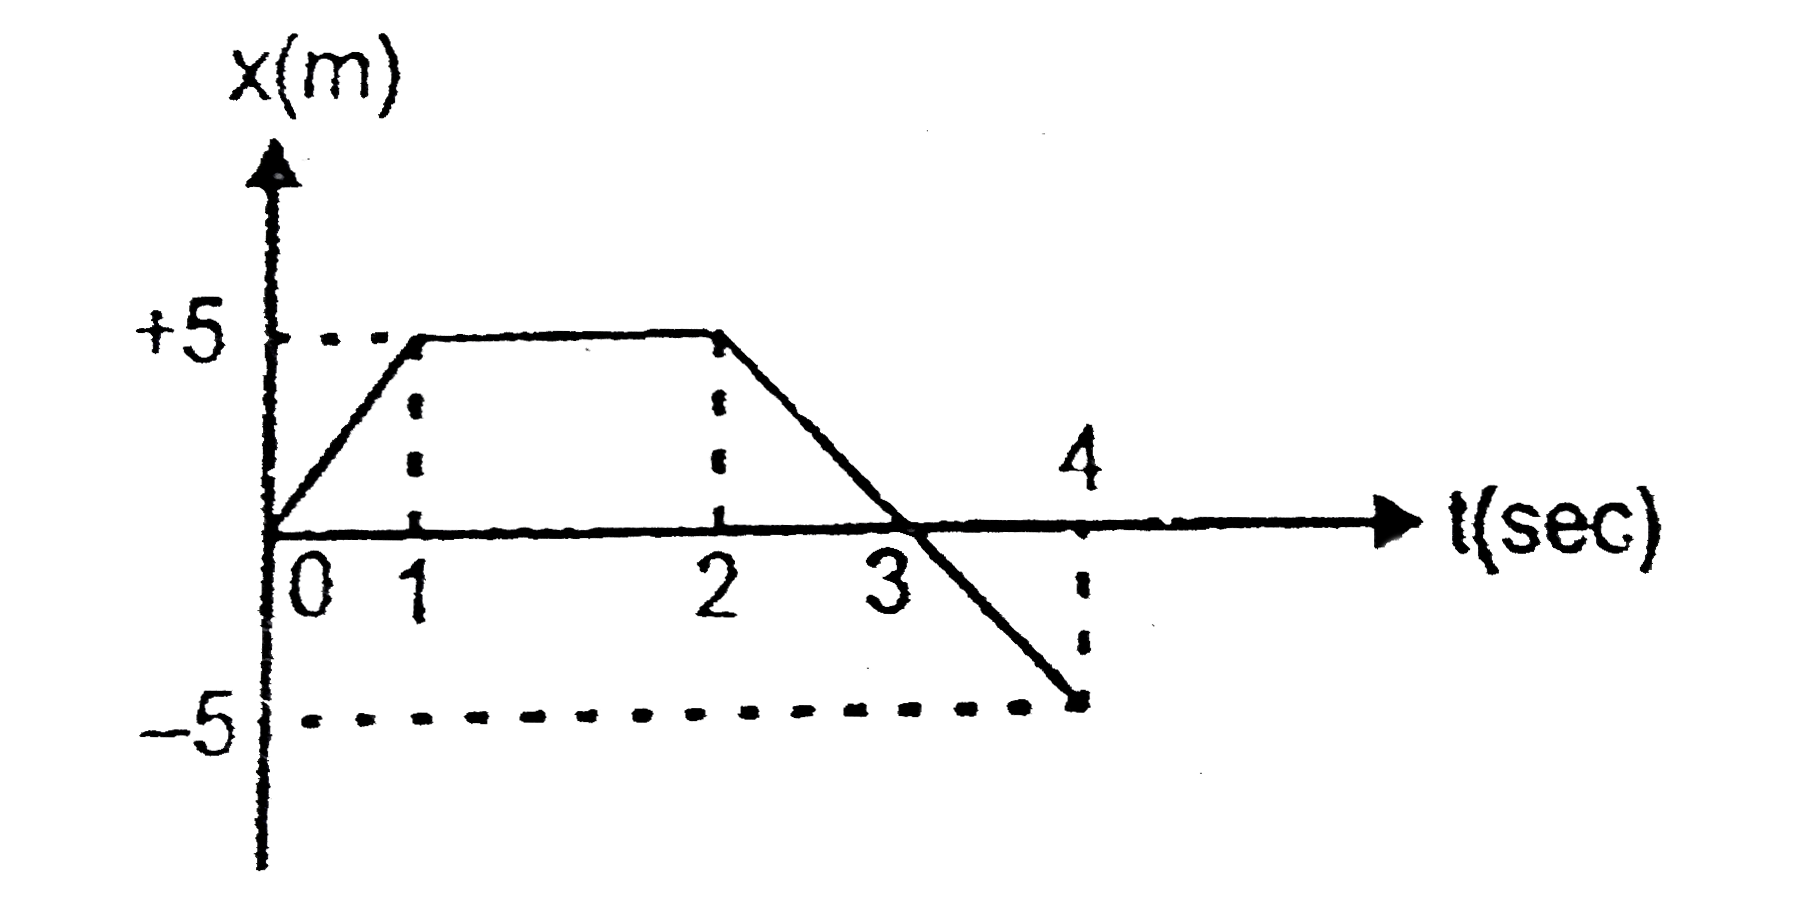
Position-time graph for a particle moving along x− direction is as shown in the figure. Average speed of the particle from t=0 to t=4 is :
 View Solution
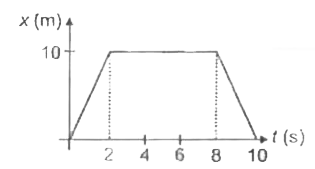
The position - time graph for a particle moving along a straight line is shown in figure. The total distance travelled by it in time t = 0 to t = 10 s is
 View Solution

