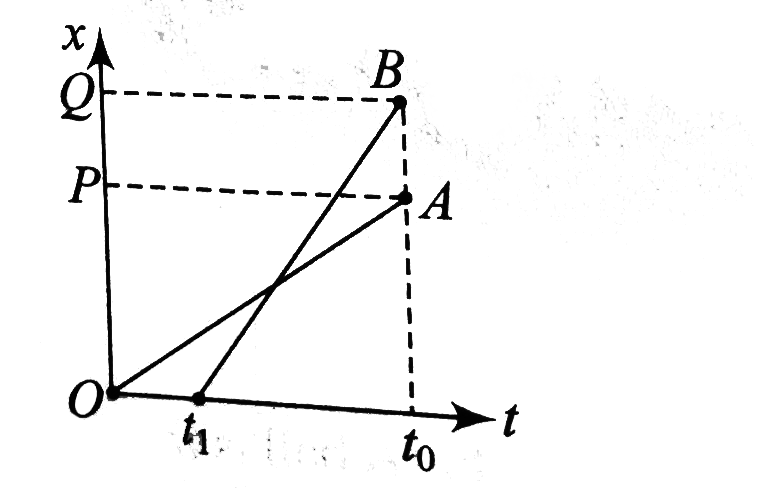
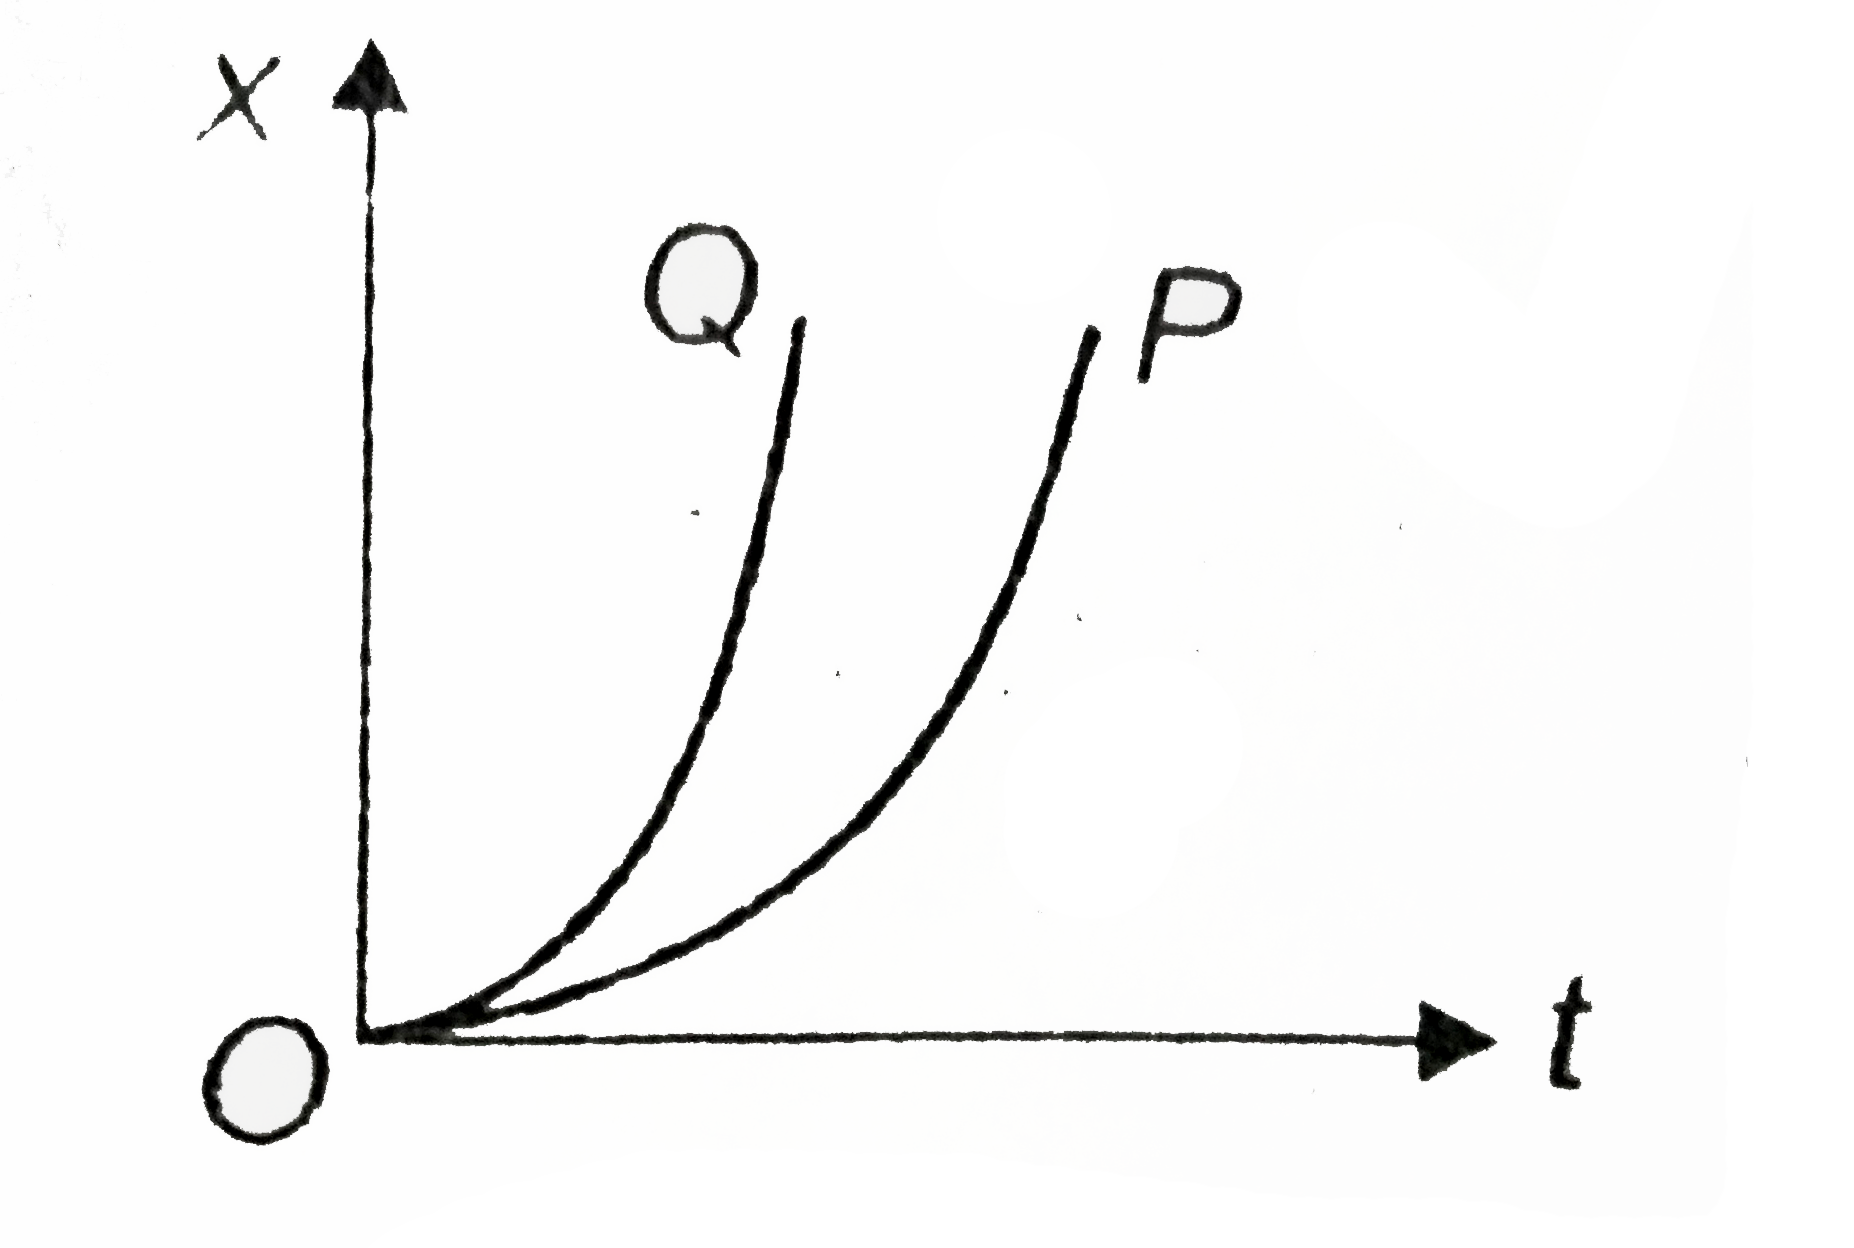
The position-time (x-t) graphs for two children A and B returning from their school O to their homes P and Q, respectively, are shown in figure. P Choose the correct answer.

(i) A and B reach home at the (same/different) time.
(ii) A or B overtakes on the road (once/twice).
(i) Corresponding to points P and Q, the value of t from x-t graphs for A and B is same, which can be checked by drawing lines through P and Q parallel to the t-axis. What is your conclusion?
(ii) The x-t graph for A and B intersect each other only once.
Topper's Solved these Questions
- DESCRIPTION OF MOTIONBook:CENGAGE PHYSICSChapter:DESCRIPTION OF MOTIONExercise:MANDATORY EXERCISE (EXERCISE SET - III)
Explore 12 Videos
- DESCRIPTION OF MOTIONBook:CENGAGE PHYSICSChapter:DESCRIPTION OF MOTIONExercise:CONSOLIDATED EXERCISE (COMPREHENSION)
Explore 7 Videos
- DESCRIPTION OF MOTIONBook:CENGAGE PHYSICSChapter:DESCRIPTION OF MOTIONExercise:MANDATORY EXERCISE (EXERCISE SET - I)
Explore 22 Videos
- ELASTICITYBook:CENGAGE PHYSICSChapter:ELASTICITYExercise:OLYMPIAD AND NTSE LEVEL EXERCISES
Explore 10 Videos
Similar Questions
The position-time (x-t) graphs for two children A and B returning from their school O to their homes P and Q respectively along straight line path (taken as x-axis) are shown in figure. Choose the correct statement (s):
View Solution
The position-time (x-t) graphs for two children A and B returning from their school O to their homes P and Q respectively along straight line path (taken as x-axis) are shown in figure. Choose the correct statement (s):
View Solution
Knowledge Check

The position-time (x-t) graphs for two children A and B returning from their school O to their homes P and Q respectively along straight line path (taken as x-axis) are shown in figure. Choose the correct statement (s):AA lives closer to the school BBA starts from the school earlier than BCA and B have equal average velocities from 0 to t0.DB overtakes A on the wayThe position- time (x-t) graphs for two rabbits A and B moving from their carrot field O to their homes P and Q respectively along straight line path (taken as x axis ) are shown in figure below. Choose the correct statement(s):
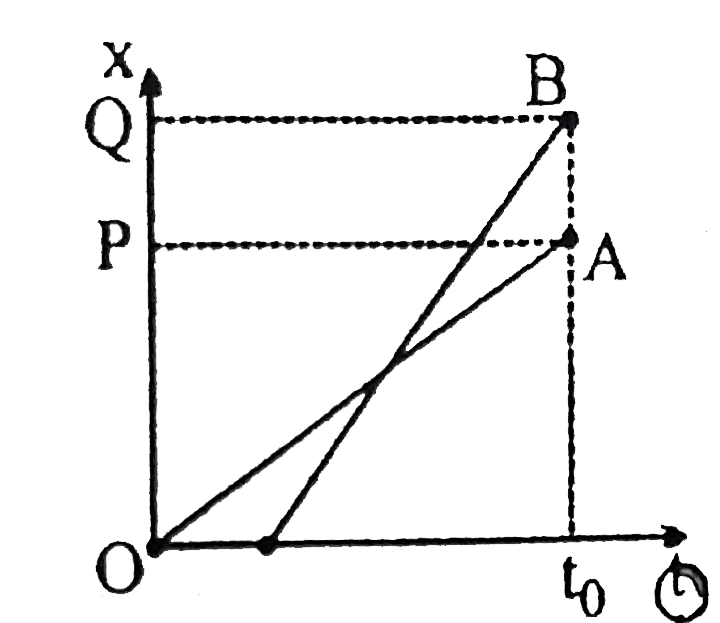 AA lives closer to the carrot field than BBA starts from the carrot field earlier than BCA and B have equal average velocities from 0→t0DB overtakes A on the way
The velocity - time graph of two bodies A and B is shown in figure. Choose correct statement.
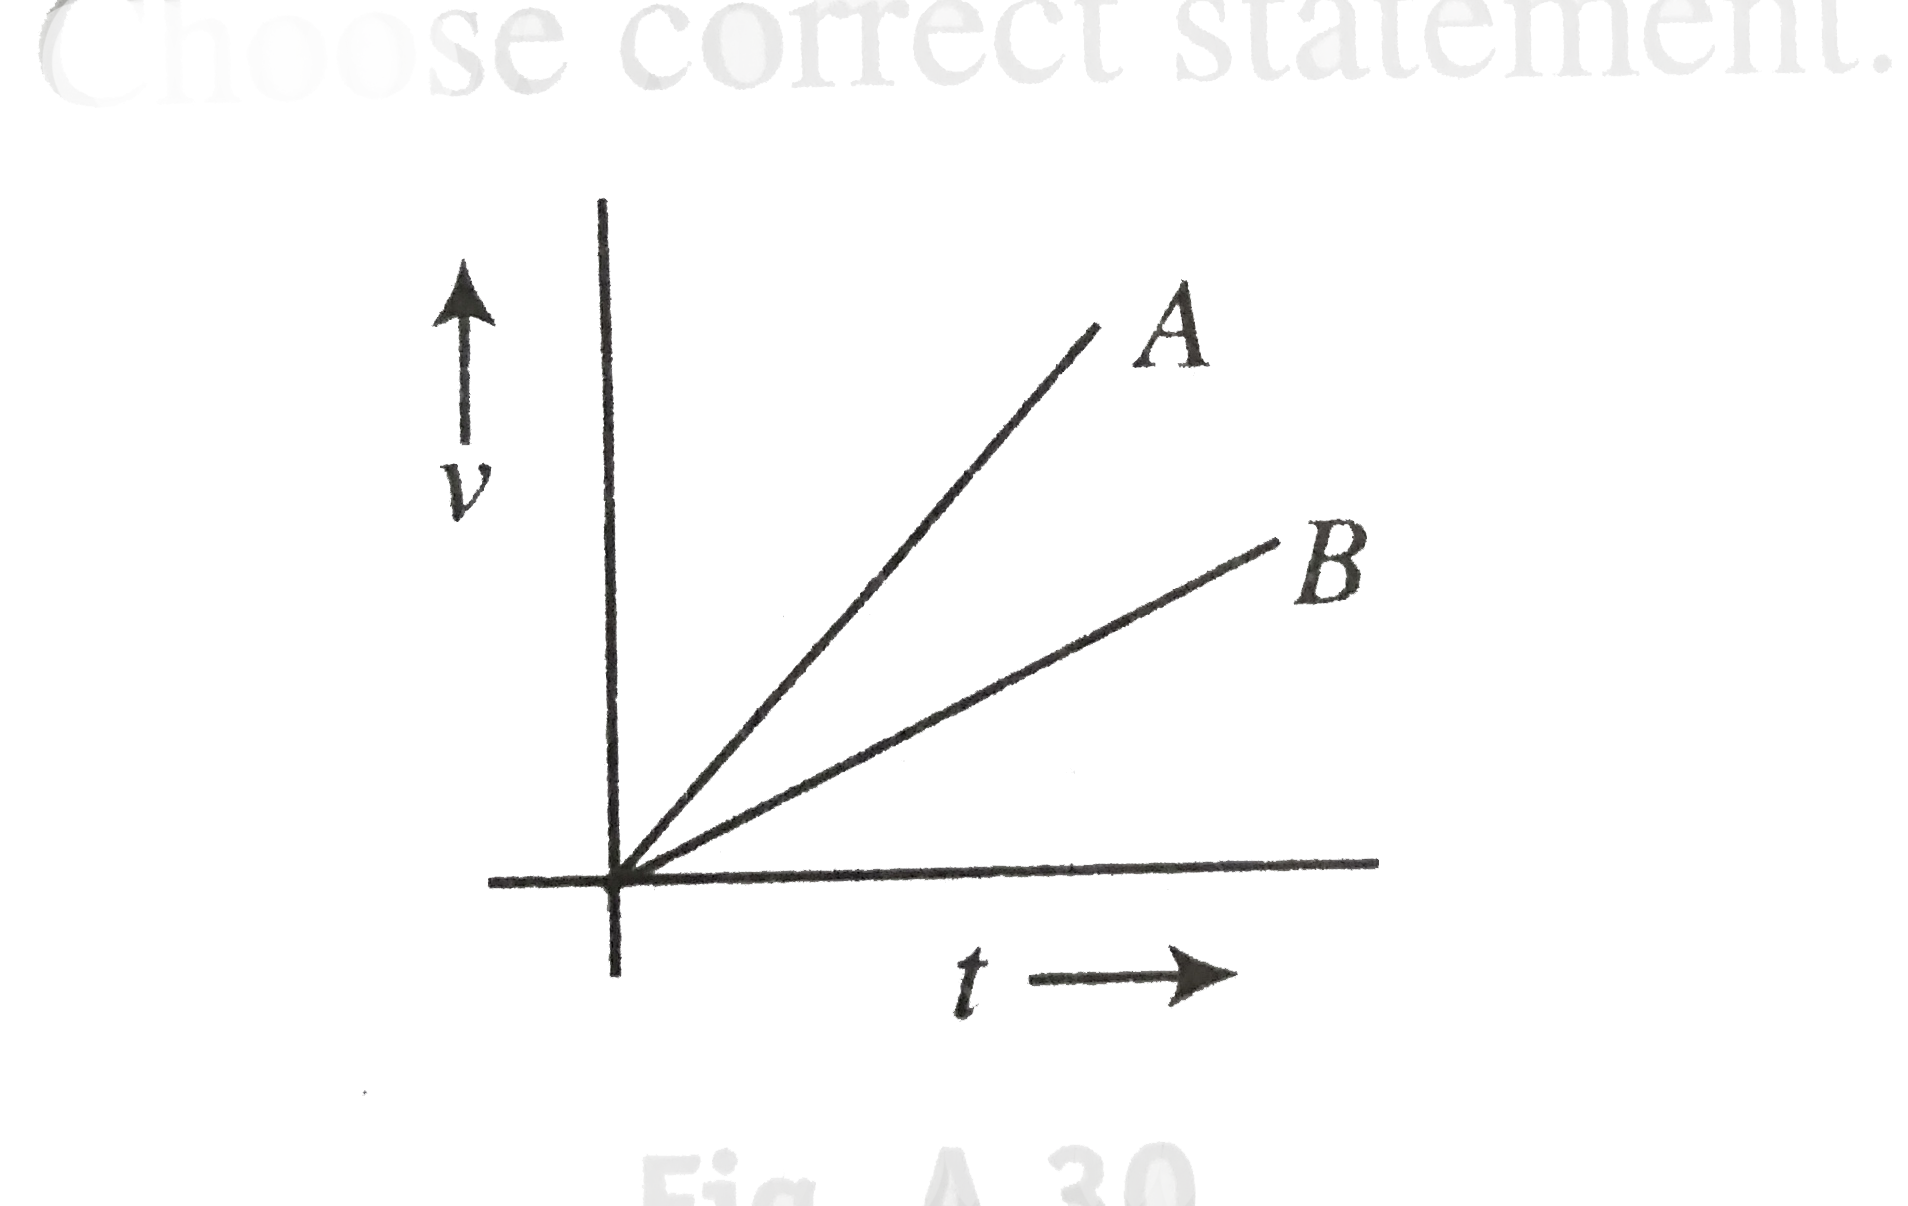 Aacceleration of Bgt acceleration of ABacceleration of A gt acceleration of BCboth are starting from same pointDA covers greater distance than B in the same time.
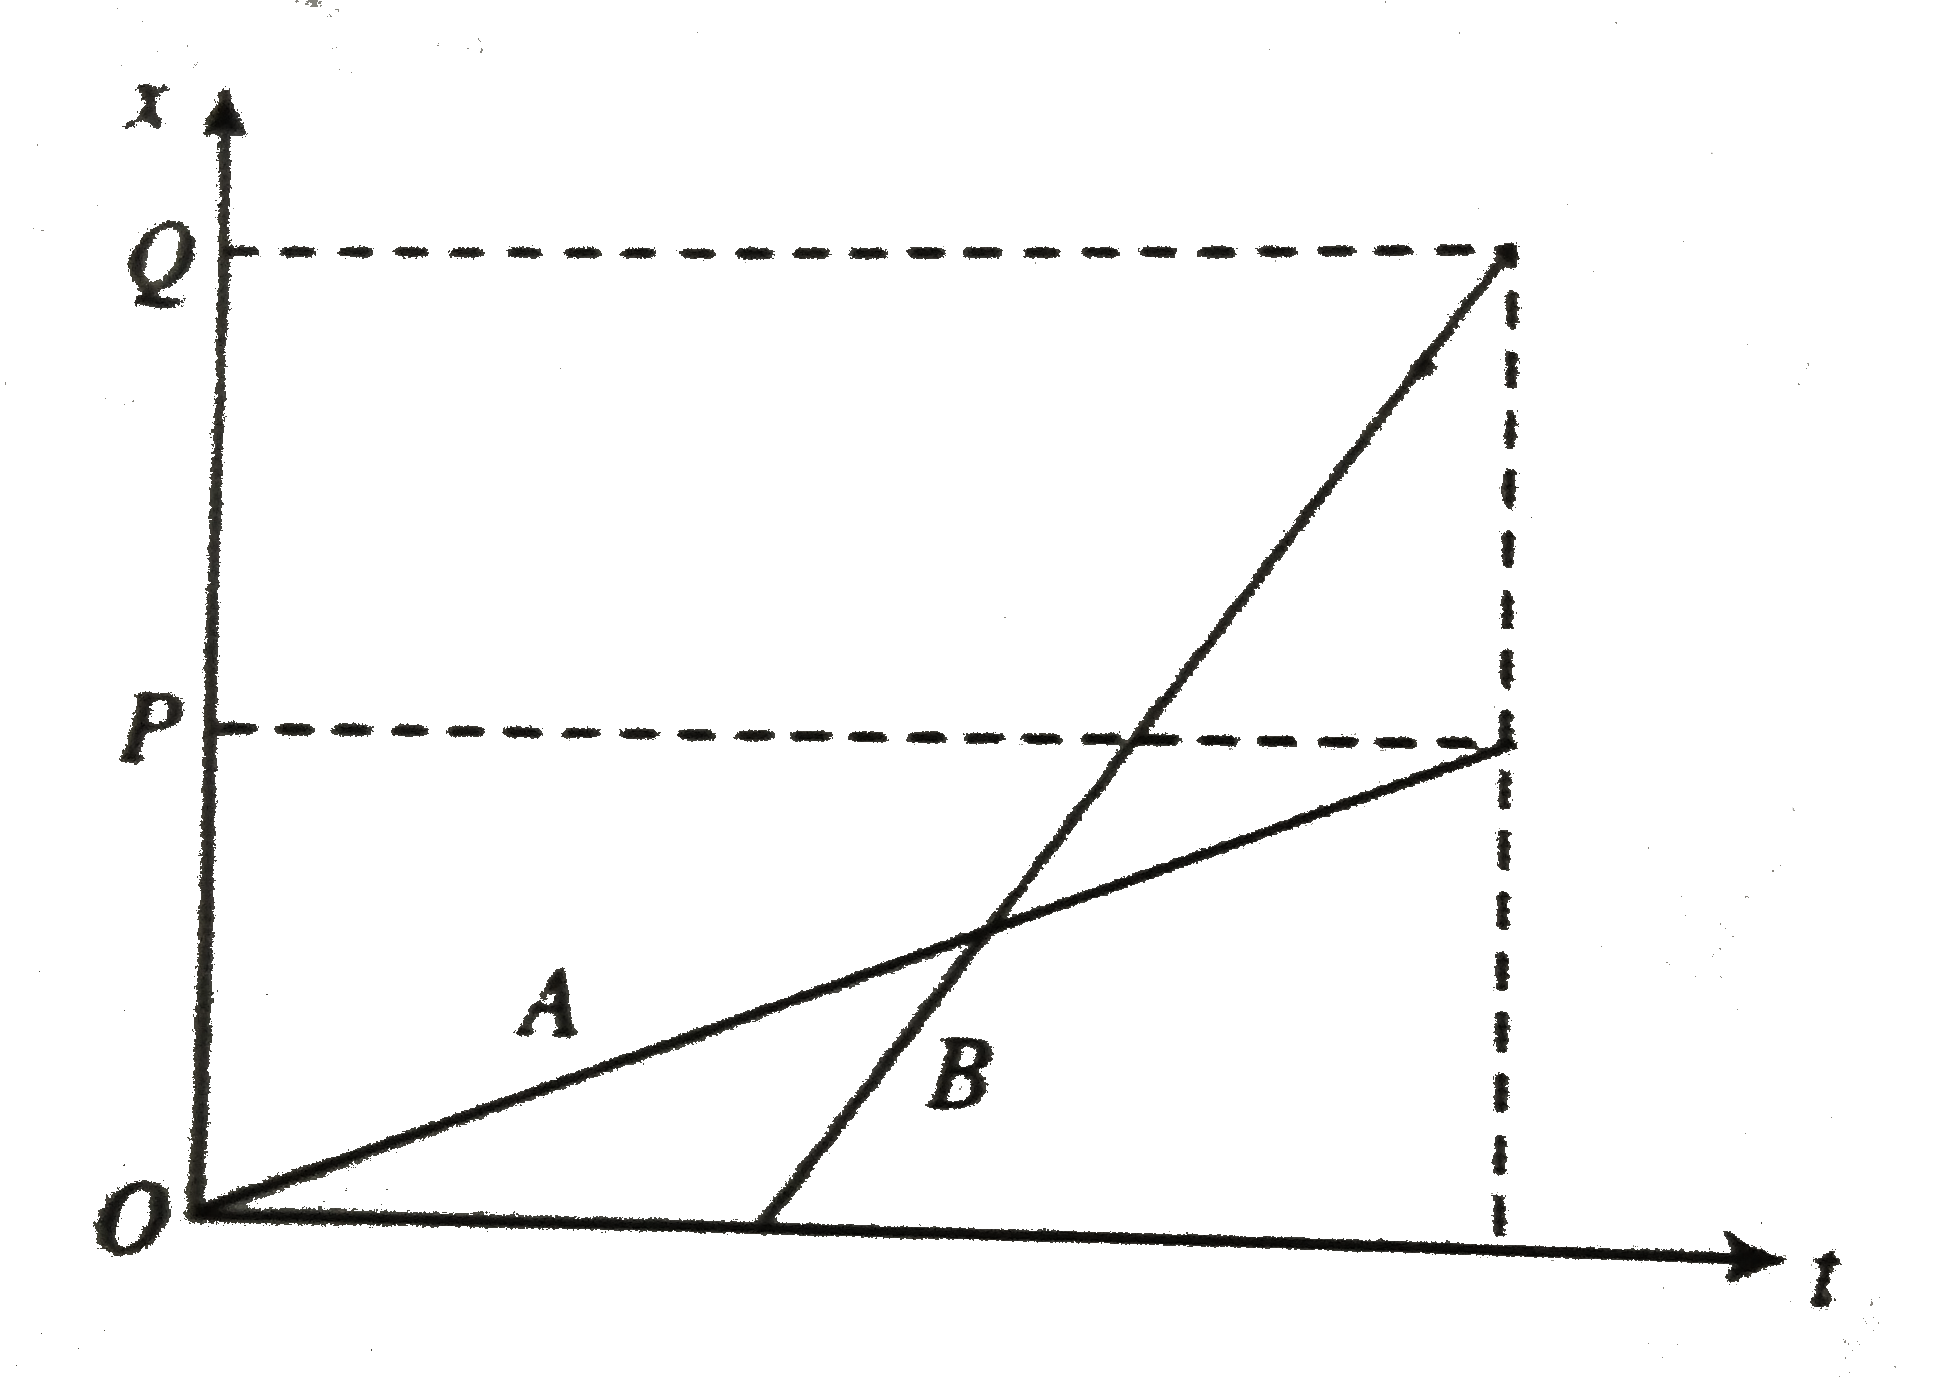
The position-time (x-t) graphs for two children A and B returning from their school O to their homes P and Q, respectively, are shown in . Choose the correct entries in the brackets
 .
.
a.(A/B) Iives closer to school than (B/A).
b. (A/B) starts from the school earlier than (B/A).
c. (A/B) walks faster than (B/A).
d. A and B reach home at the (same//differnt) time.
e. (A//B) overtakes on the road (once//twice).
View SolutionThe position-time (x-t) graphs for two children A and B returning from their school O to their homes P and Q, respectively, are shown in . Choose the
 .
.
a.(A/B) Iives closer to school than (B/A).
b. (A/B) starts from the school earlier than (B/A).
c. (A/B) walks faster than (B/A).
d. A and B reach home at the (same//differnt) time.
e. (A//B) overtakes on the road (once//twice).
View SolutionThe position-time graph for two particles P and Q moving on x-axis is shown in the figure. Then
View SolutionThe position-time graph for two particles P and Q moving on x-axis is shown in the figure. Then

View SolutionThe velocity - time graph of two bodies A and B is shown in figure. Choose correct statement.

View Solution
