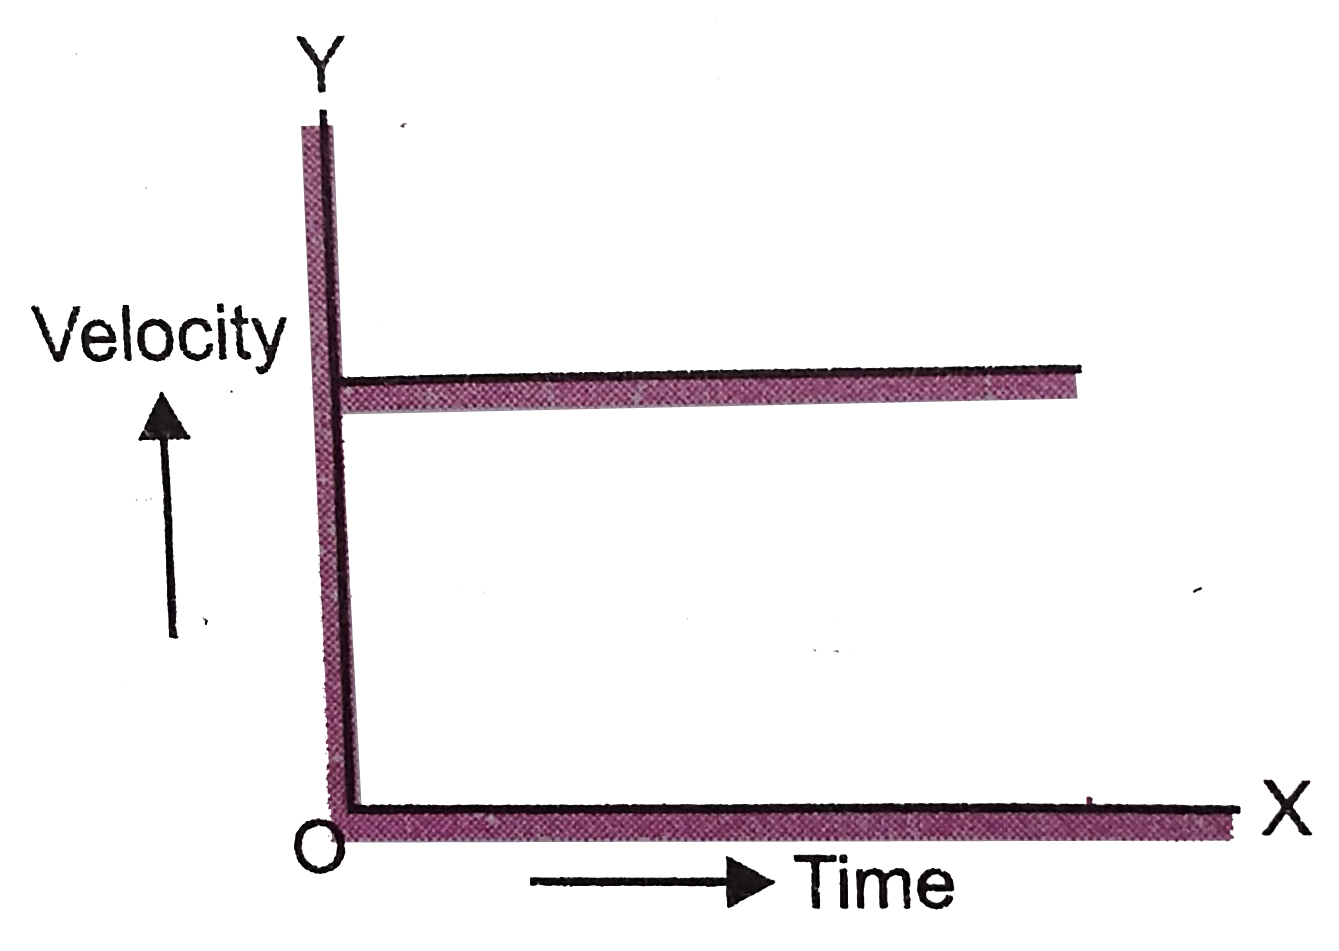
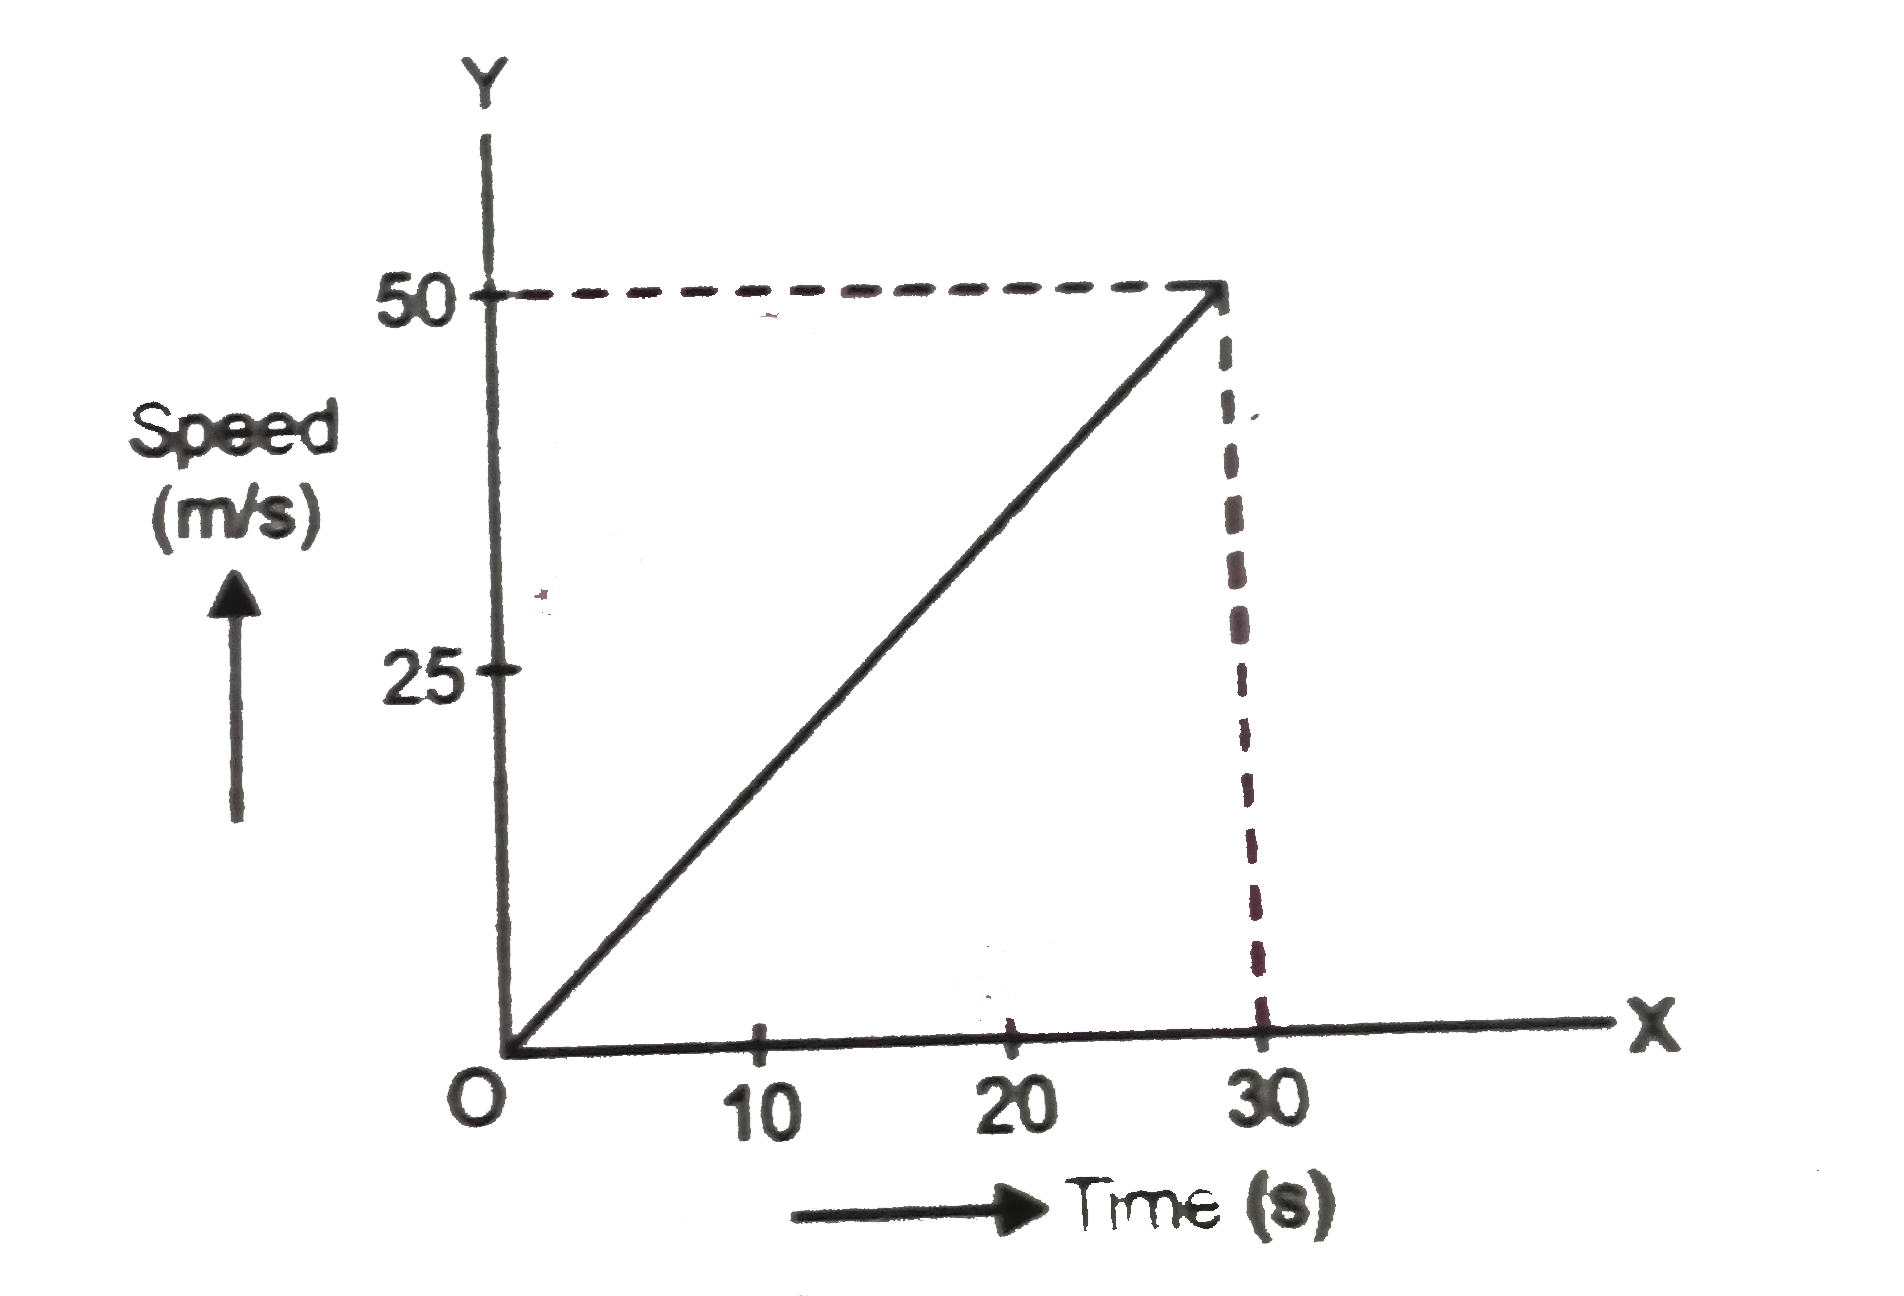
The speed time graph of a body is as shown in Figure. Calculate
(i) acceleration of body, (ii) retardation of body, (iii) total distance travelled by the body.
Text Solution
(i) Acceleration of body (from portion OA), Fig.
=change in vel.time taken=(10−0)5=2m/s2.
(ii) Retardation of body (from portion BC), Fig.
=change in velocitytime taken=(0−10)16−10=−1.67m/s2.
Total distance travelled = Area under the graph OABC, Fig.
=10×52+10×5+10×62=105m
|
Updated on:21/07/2023
Topper's Solved these Questions
- BOOK - PRADEEPCHAPTER - MOTIONEXERCISE - (NCERT) multiple choice11videos
MOTION
- BOOK - PRADEEPCHAPTER - MOTIONEXERCISE - Mock test24videos
MOTION
- BOOK - PRADEEPCHAPTER - MOTIONEXERCISE - Formative Assessment 1(b) - Oral testing (Exercise)1videos
MOTION
- BOOK - PRADEEPCHAPTER - GRAVITATIONEXERCISE - Model Test paper (1)36videos
GRAVITATION
- BOOK - PRADEEPCHAPTER - SOUNDEXERCISE - Model Test (sec - B)12videos
SOUND
Similar Questions
Knowledge Check
- Question 1 - Select One
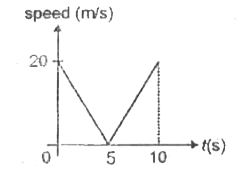
The speed - time graph for a body moving along a straight line is shown in figure. The average acceleration of body may be
 A0B4m/s2C−4m/s2DAll of these
 - Question 2 - Select One
The velocity - time graph of a body is given in figure below .
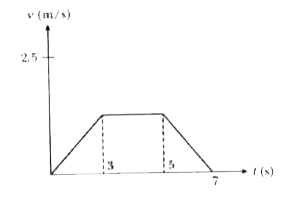
The acceleration-time graph of the motion of the body isA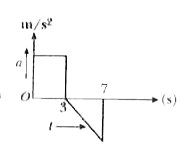 B
B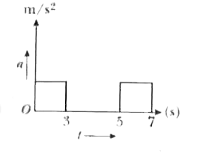 C
C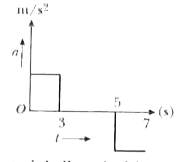 D
D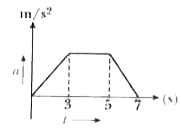
- Question 3 - Select One
The displacement time graph of a body is shown in figure. The velocity-time graph of the motion of the body will be
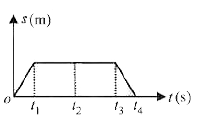 A
A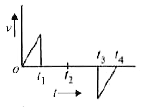 B
B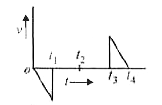 C
C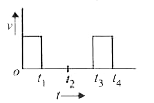 D
D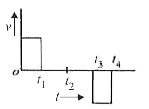
The speed time graph of a body of mass 50kg is shown in (figure). Calculate the force acting in the body
(i)from 0 to 4s (ii)from 4 to 6s
 View Solution
The velocity time graph of a body represented as shown in Fig. Calculate the distance by the body in 5 second.
 View Solution
The speed - time graph for a body moving along a straight line is shown in figure. The average acceleration of body may be
 View Solution
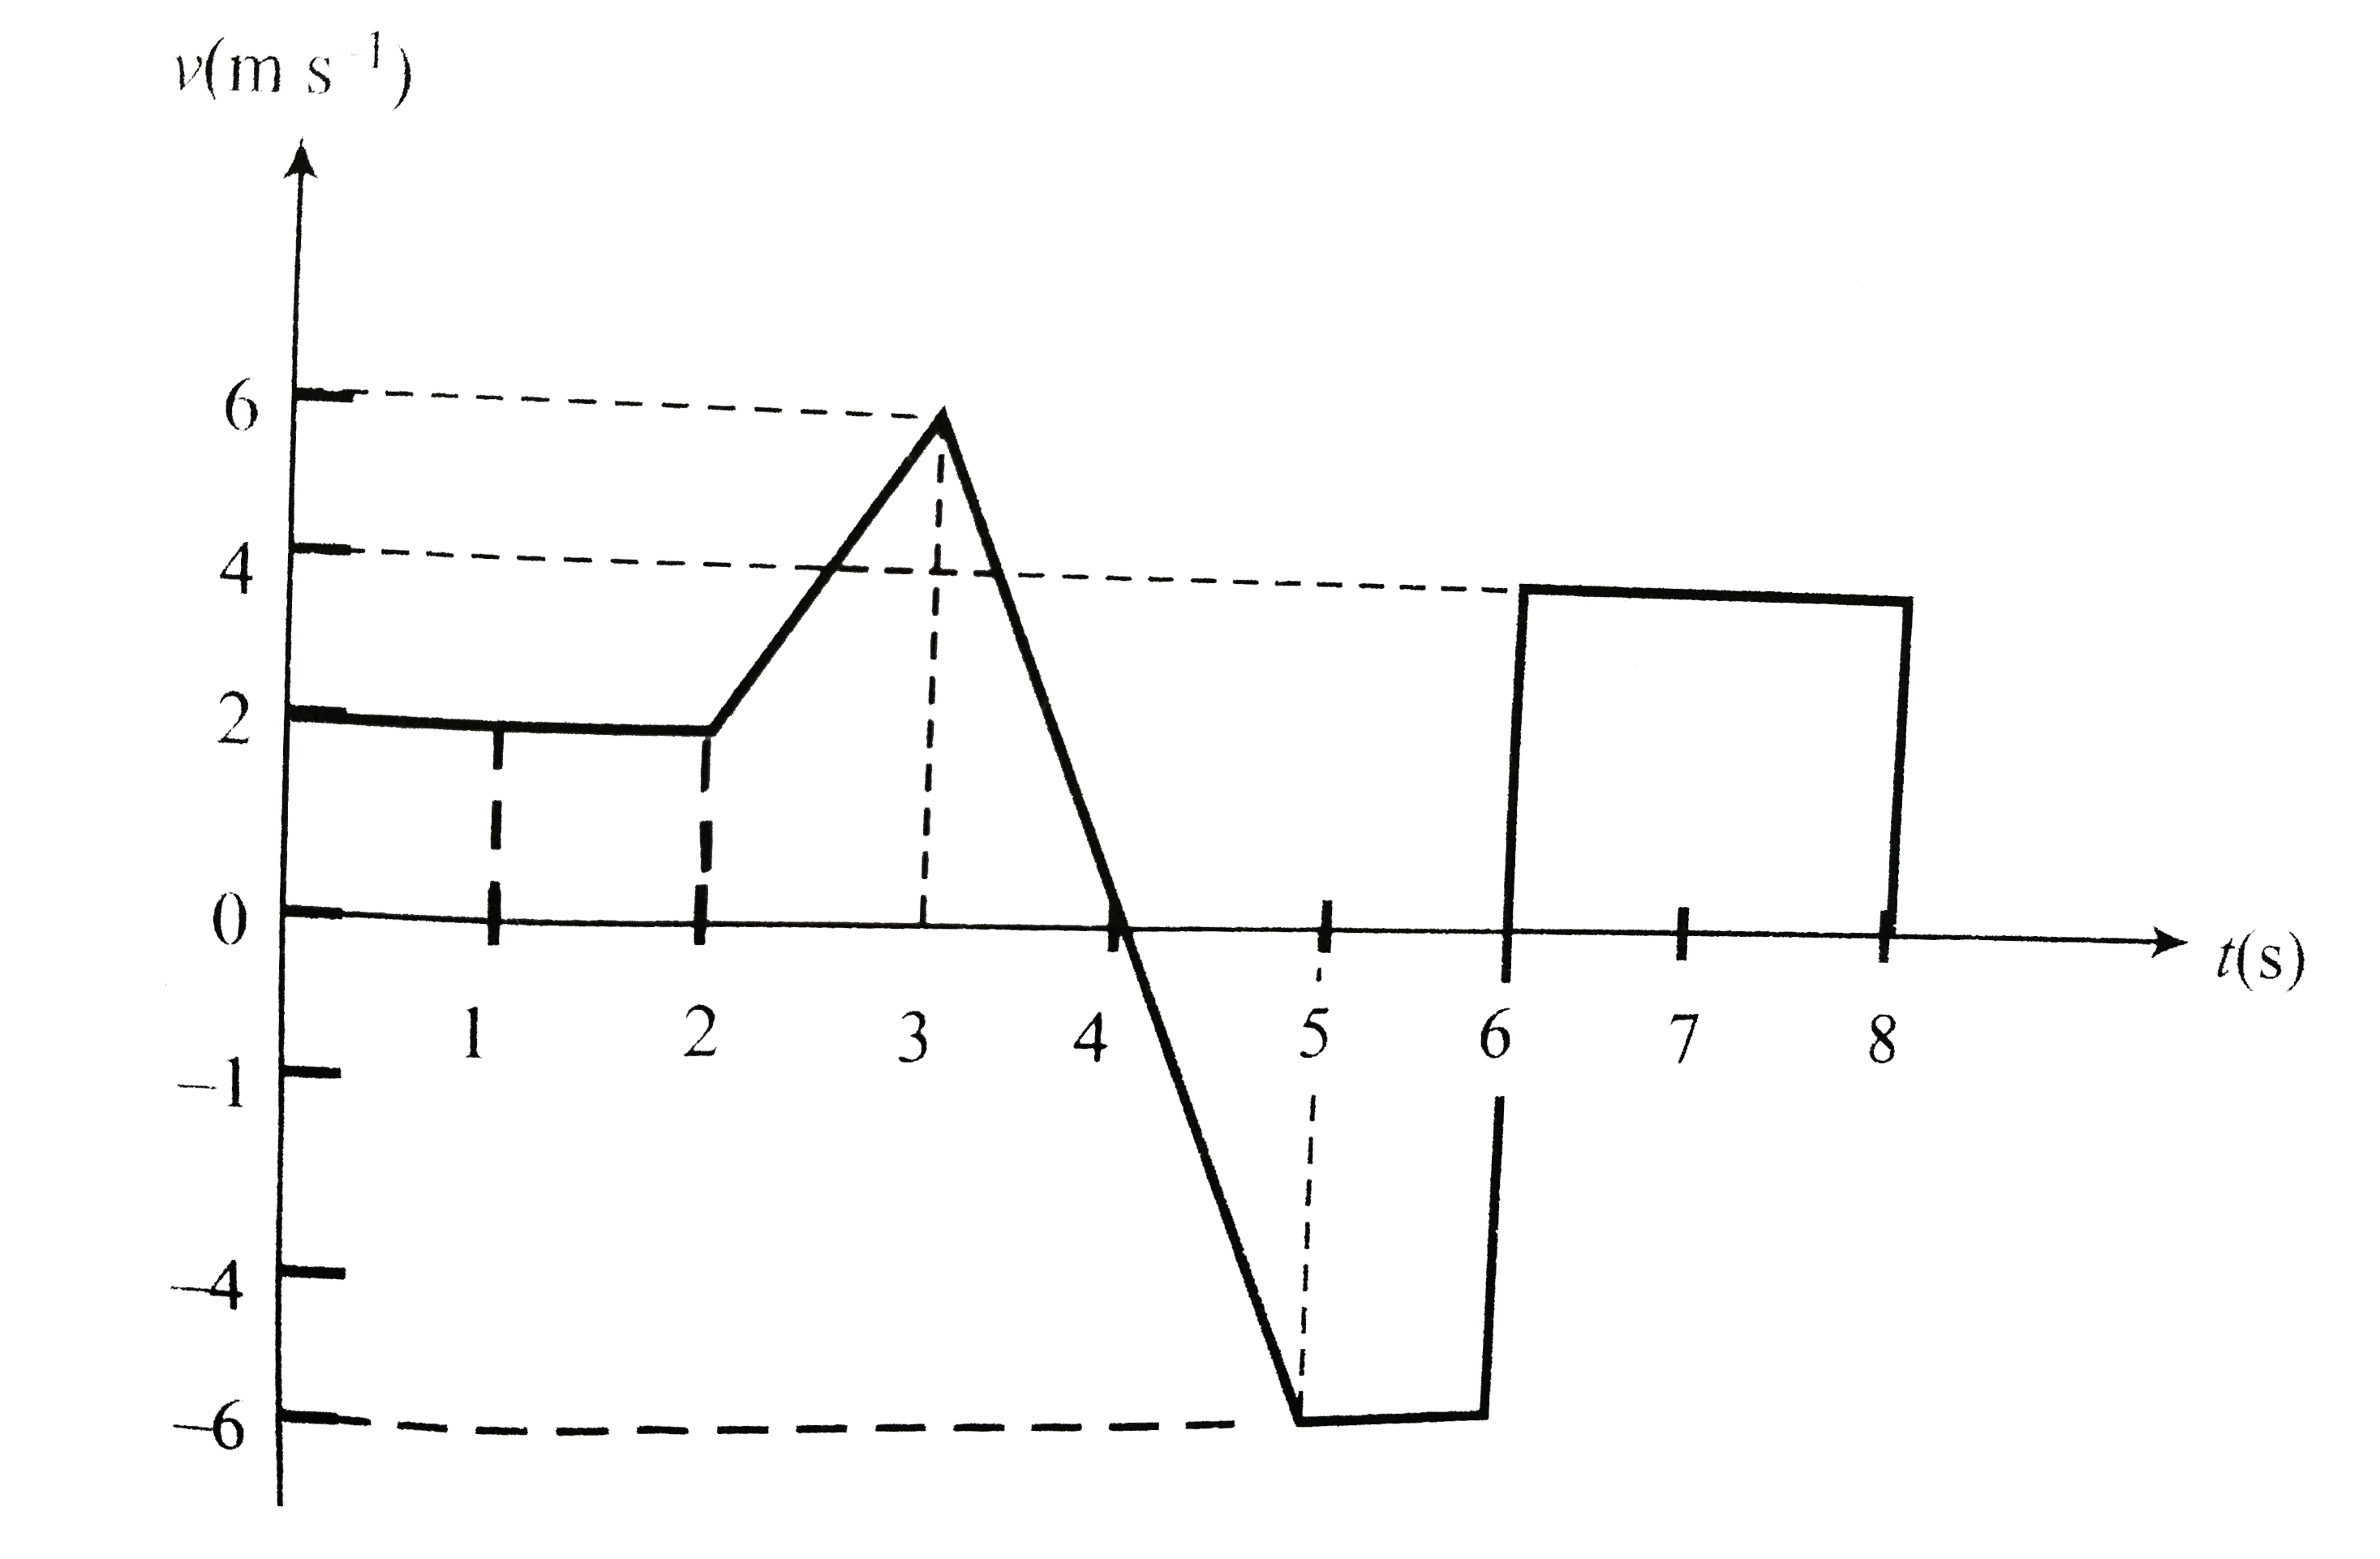
The velocity-time graph of a body is shown in .
The displacement of the body in 8s is.
 .View Solution
The velocity-time graph of a body is shown in .
The displacement of the body in 8s is.
 .View Solution


