The speed - time graph for a body moving along a straight line is shown in figure. The average acceleration of body may be
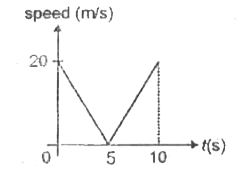
0
4m/s2
−4m/s2
All of these
The correct Answer is:D
Step by step video & image solution for The speed - time graph for a body moving along a straight line is shown in figure. The average acceleration of body may be by Physics experts to help you in doubts & scoring excellent marks in Class 12 exams.
Updated on:21/07/2023Topper's Solved these Questions
- MOTION IN A STRAIGHT LINEBOOK - AAKASH INSTITUTE ENGLISHCHAPTER - MOTION IN A STRAIGHT LINEEXERCISE - ASSIGNMENT (SECTION - C)
36 Videos
- MOTION IN A STRAIGHT LINEBOOK - AAKASH INSTITUTE ENGLISHCHAPTER - MOTION IN A STRAIGHT LINEEXERCISE - ASSIGNMENT (SECTION - D)
15 Videos
- MOTION IN A STRAIGHT LINEBOOK - AAKASH INSTITUTE ENGLISHCHAPTER - MOTION IN A STRAIGHT LINEEXERCISE - ASSIGNMENT (SECTION - A)
58 Videos
- MOTION IN A PLANEBOOK - AAKASH INSTITUTE ENGLISHCHAPTER - MOTION IN A PLANEEXERCISE - Assignement section -J (Aakash Challengers Questions)
7 Videos
- MOTION IN STRAIGHT LINEBOOK - AAKASH INSTITUTE ENGLISHCHAPTER - MOTION IN STRAIGHT LINEEXERCISE - Assignment (SECTION - J)
2 Videos
Similar Questions
Displacement time graph of a particle moving in a straight line is a shown in figure.

View SolutionThe position (x) - time (t) graph for a particle moving along a straight line is shown in figure. The average speed of particle in time interval t = 0 to t = 8 s is
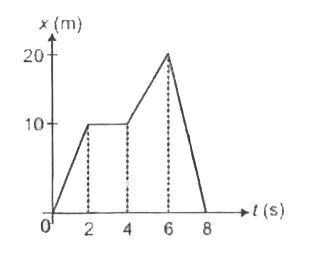
View Solution
The velocity displacement graph of a particle moving along a straight line is shown in figure.
Then the acceleration displacement graph is.
View SolutionThe position - time graph for a particle moving along a straight line is shown in figure. The total distance travelled by it in time t = 0 to t = 10 s is
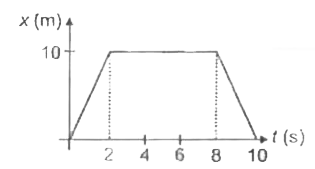
View SolutionThe velocity versus time graph of a body moving in a straight line is as shown in the figure below
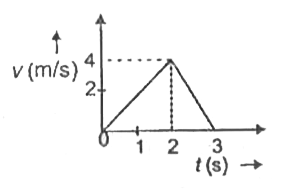
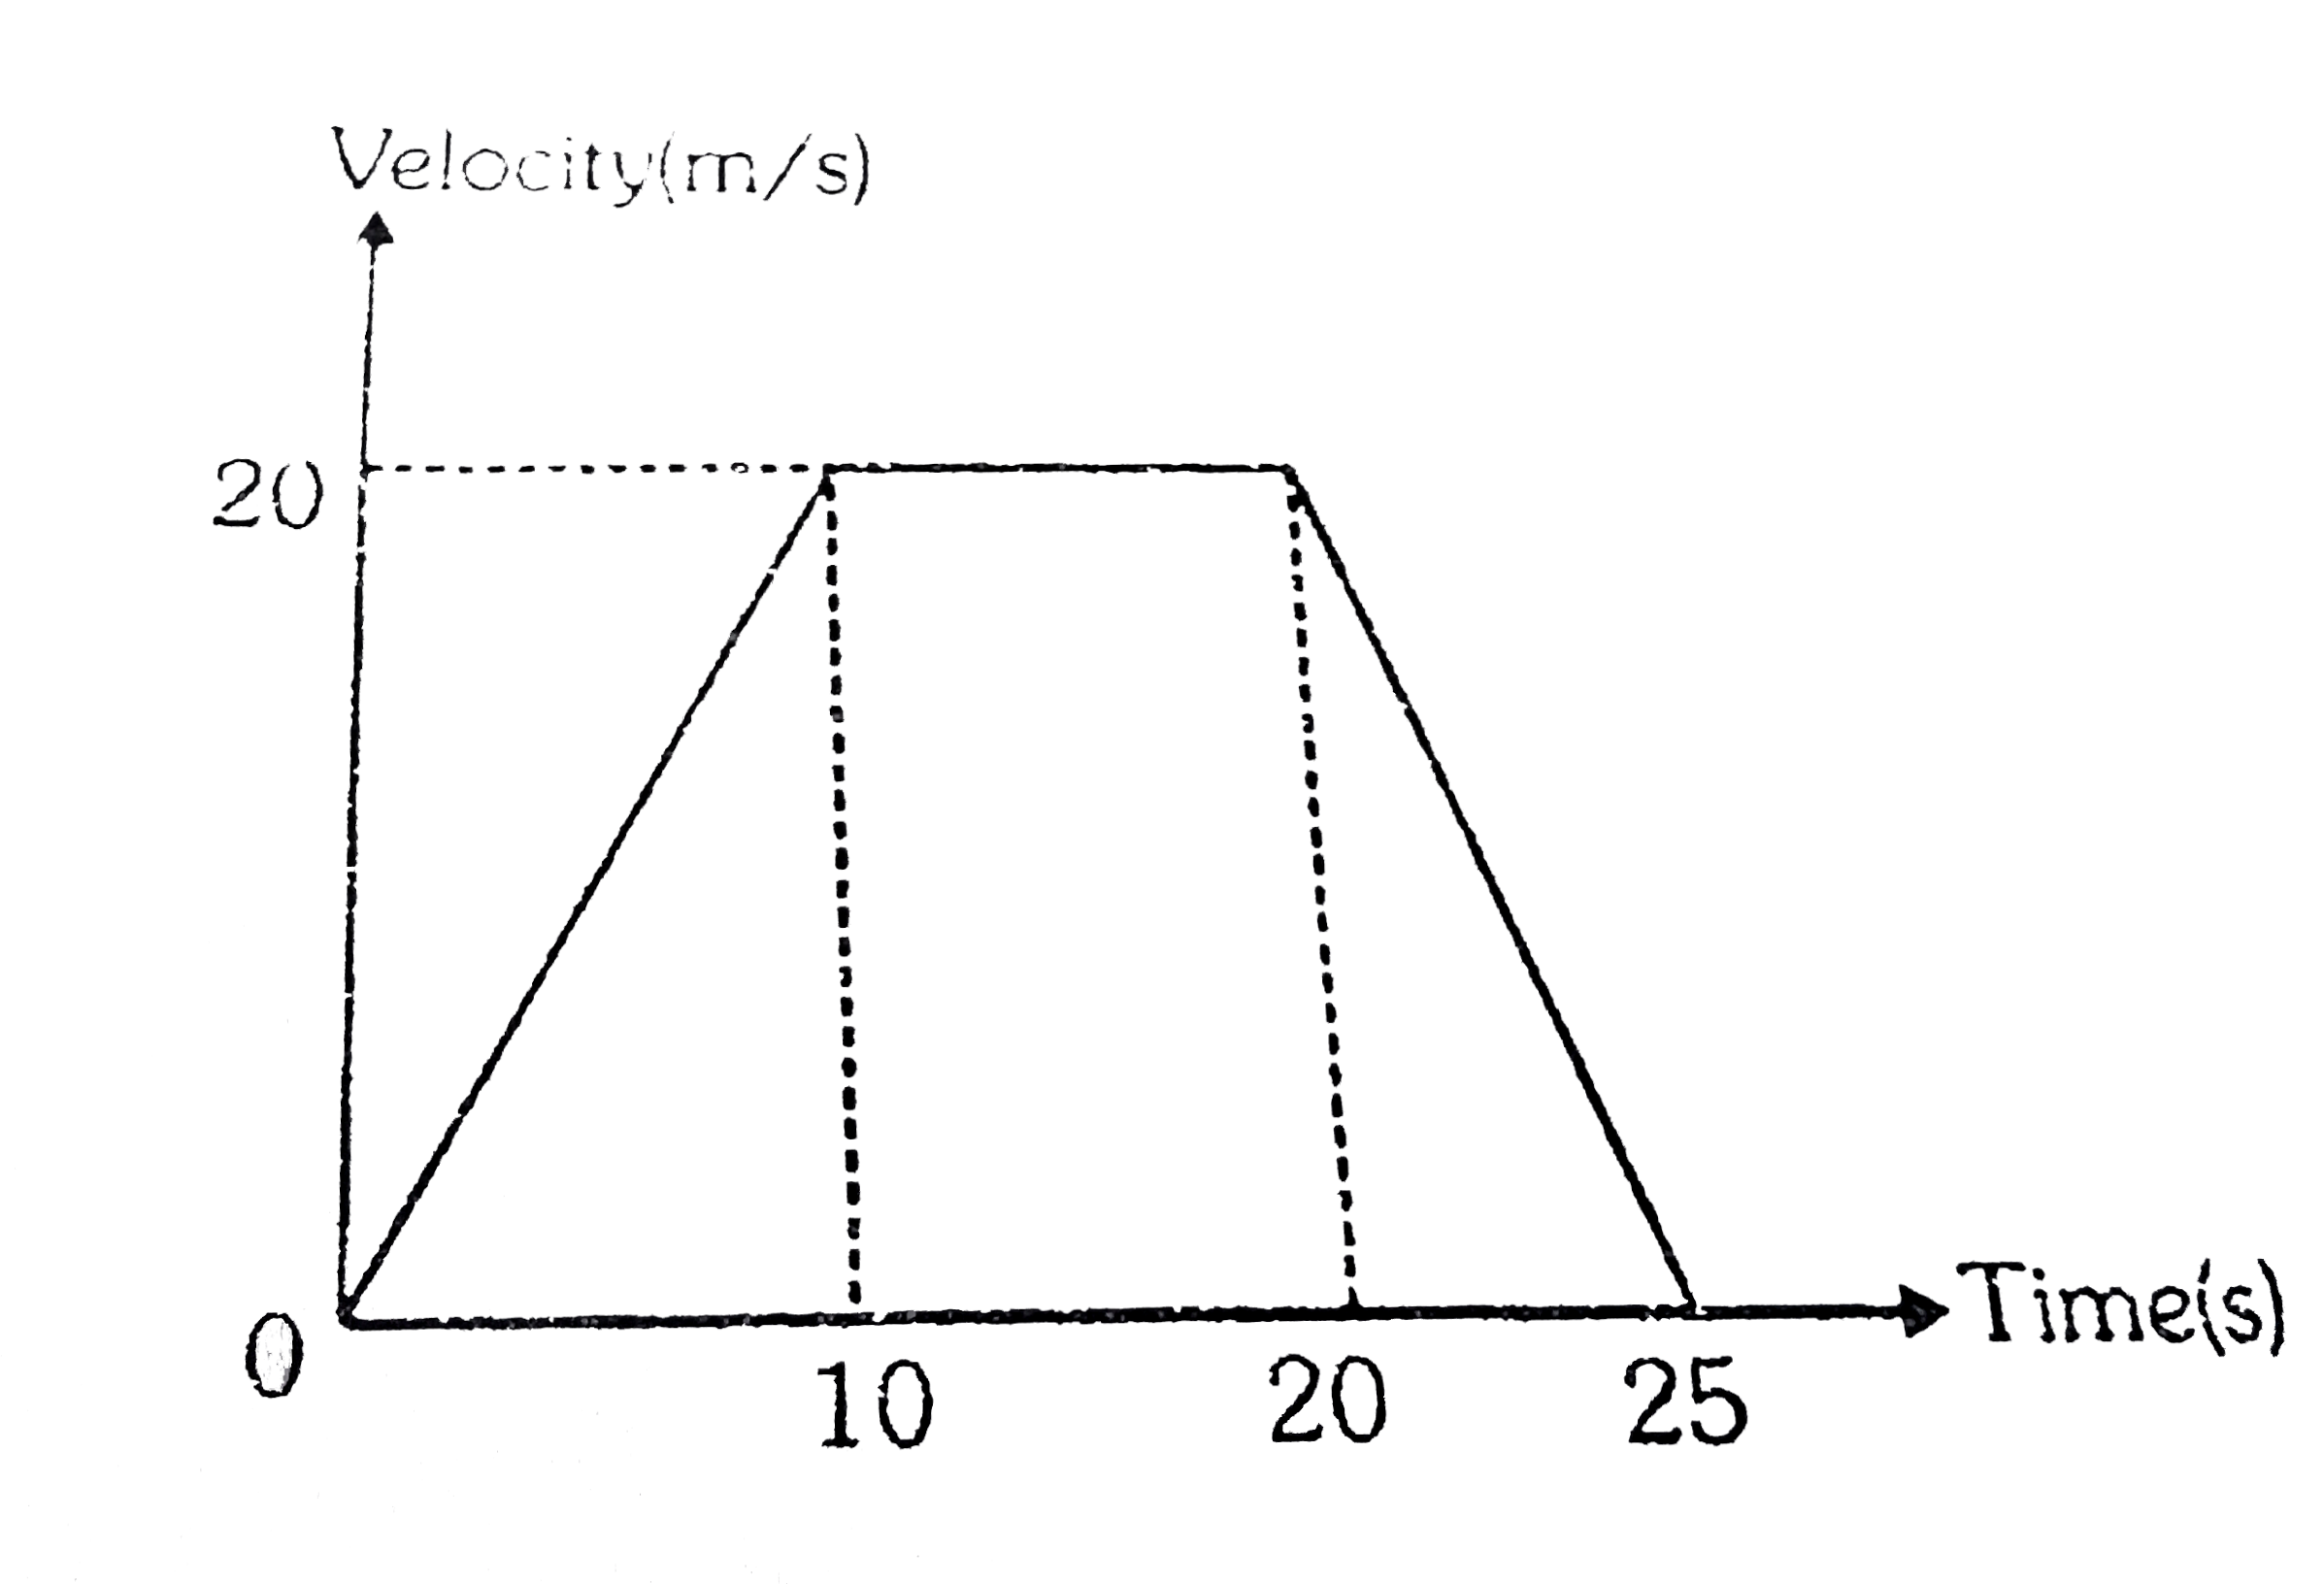
View SolutionThe velocity-time graph of a car moving along a straight road is shown in figure. The average velocity of the car is first 25 seconds is
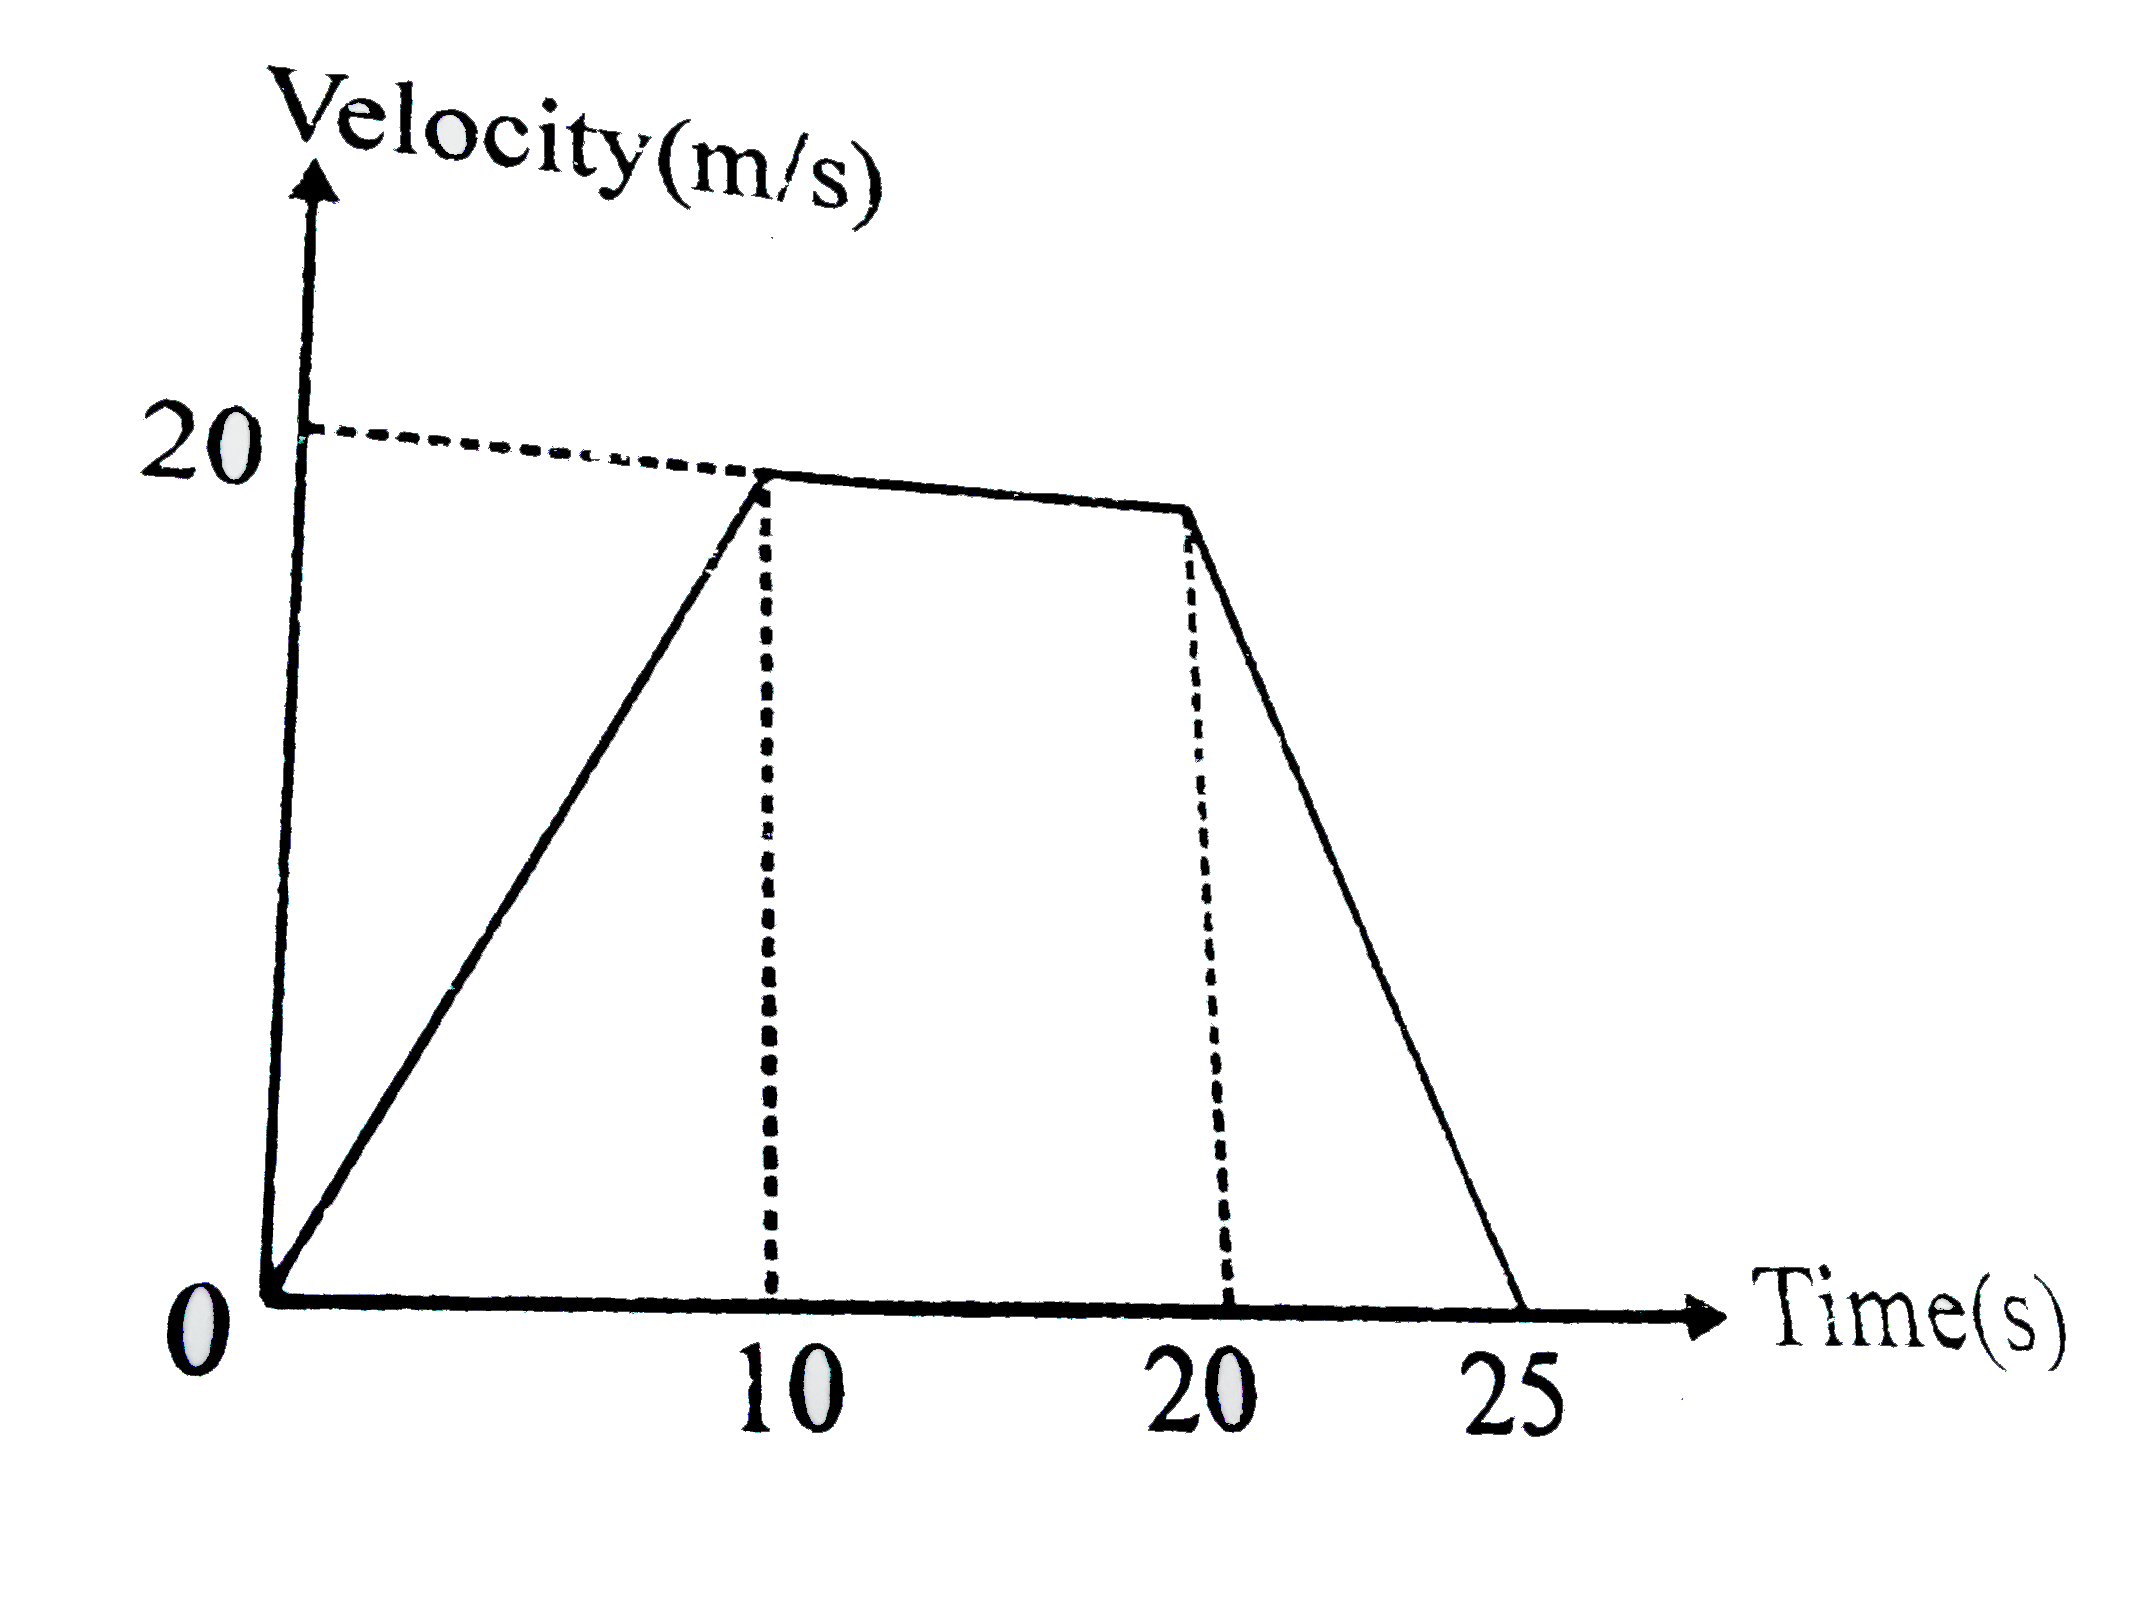
View SolutionThe velocity-time graph of a car moving along a straight road is shown in figure. The average velocity of the car in first 25 seconds is
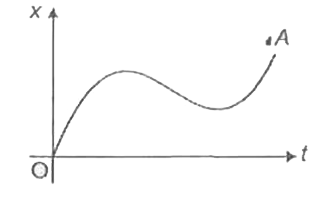
View SolutionThe position - time graph for a body moving along a straight line between O and A is shown in figure. During its motion between O and A, how many time body comes to rest?
View SolutionWhich of the following graph for a body moving along a straight line is possible ?
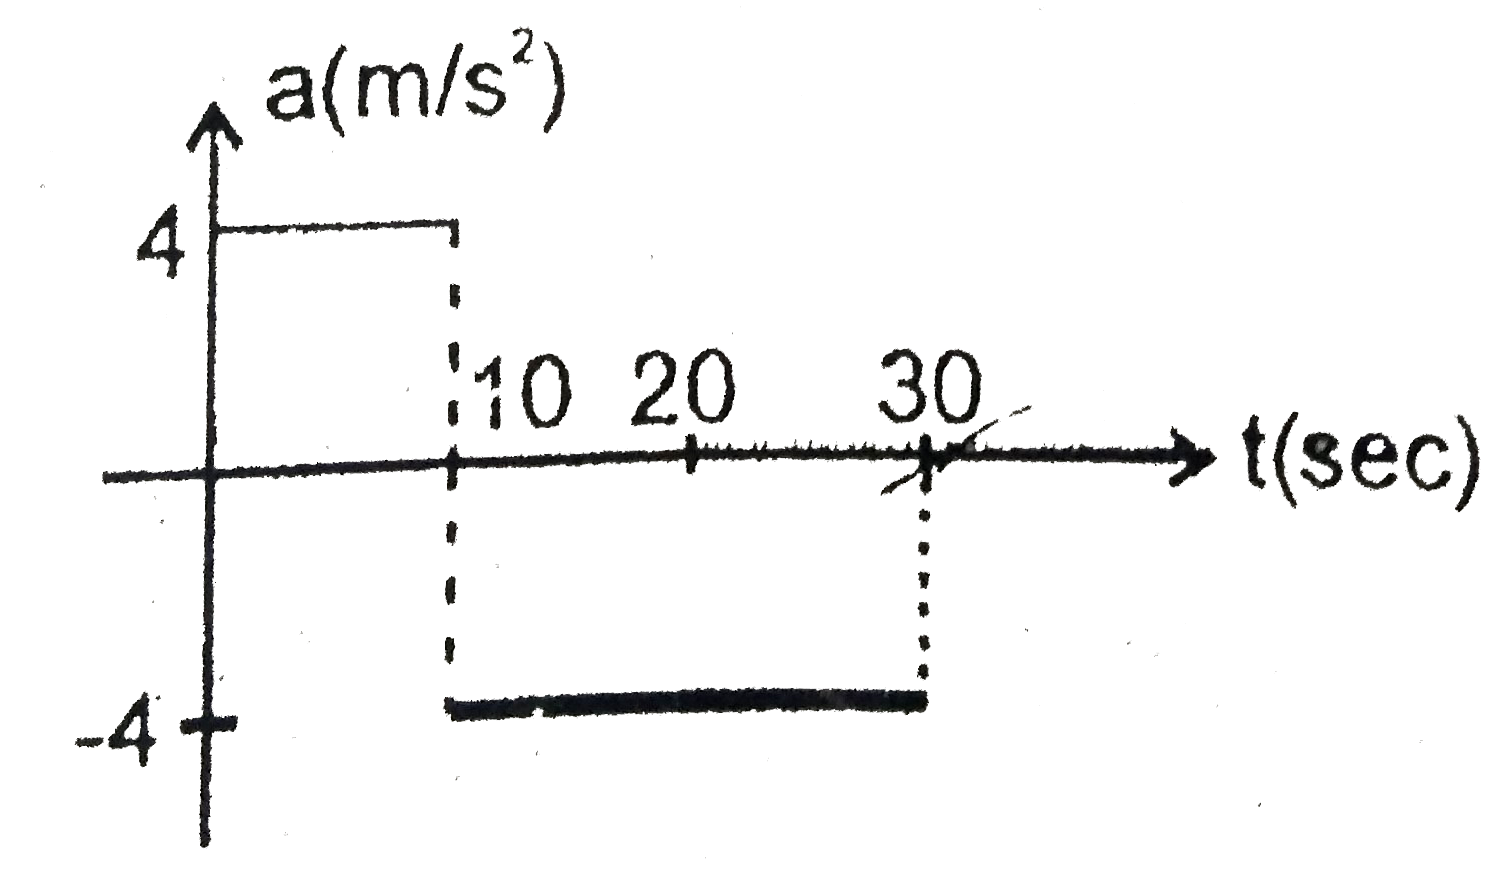
View SolutionThe acceleration versus time graph for a particle moving along a straight line is shown in the figure. If the particle starts from rest at t = 0, then its speed at t = 30 sec will be :
View Solution
