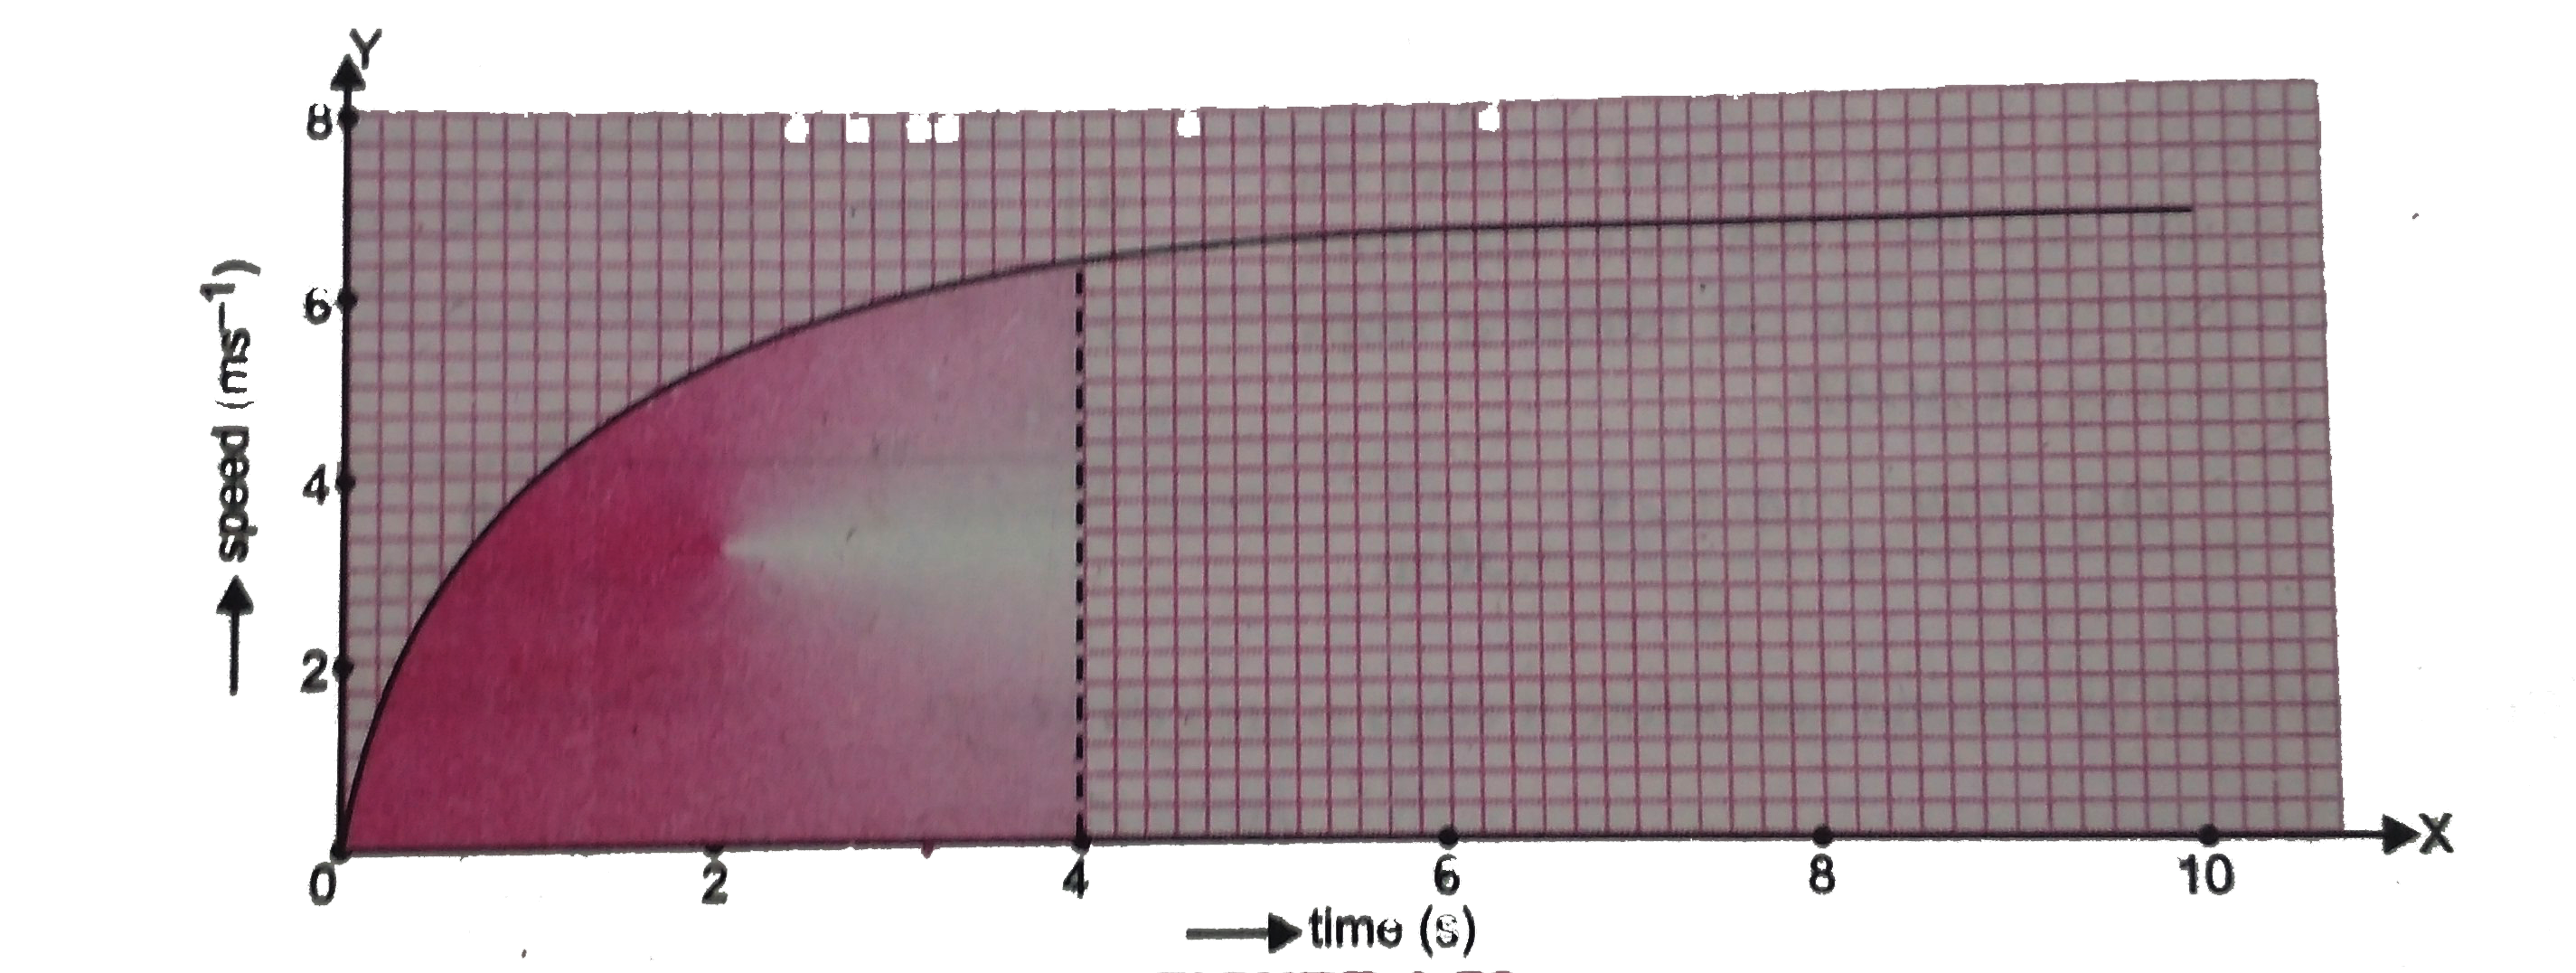
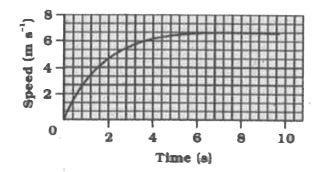
The speed-time graph of a car is shown in figure given below
![The speed-time graph of a car is shown in figure given below Speed-time graph] (a) Find how far does the car travel in the first 4 second. Shade the area on the graph that represents the distance travelled by the car during the period. (b) Which part of the graph represents uniform motion of the car ?](https://d10lpgp6xz60nq.cloudfront.net/physics_images/NVT_SCI_IX_C08_E02_144_Q01.png)
Speed-time graph]
(a) Find how far does the car travel in the first 4 second. Shade the area on the graph that represents the distance travelled by the car during the period.
(b) Which part of the graph represents uniform motion of the car ?Solution in Gujrati
(a) On the time axis 5 divisions = 2s On the speed axis 3 divisions =2ms−1∴5×3=15 small squares =2×2ms−1=4m
Total area under the speed-time graph for the first 4 seconds = 60 small squares
∴ Distance covered by the car in first 4 seconds =60×415=16m.
(b) After 6 second the graph represents uniform motion of the car.
Topper's Solved these Questions
- MOTION BOOK - KUMAR PRAKASHANCHAPTER - MOTION EXERCISE - TEXTBOOK EXAMPLES/NUMERICALS
14 Videos
- MOTION BOOK - KUMAR PRAKASHANCHAPTER - MOTION EXERCISE - ADDITIONAL NUMERICALS FOR PRACTICE
48 Videos
- MOTION BOOK - KUMAR PRAKASHANCHAPTER - MOTION EXERCISE - MATCH THE FOLLOWING
10 Videos
- GRAVITATIONBOOK - KUMAR PRAKASHANCHAPTER - GRAVITATIONEXERCISE - ACTIVITY 10.4
2 Videos
- QUESTION PAPER 01BOOK - KUMAR PRAKASHANCHAPTER - QUESTION PAPER 01EXERCISE - SECTION - D
5 Videos
Similar Questions
An object travels 16 m in 4s and then another 16 m in 2 s. What is the average speed of the object?
View SolutionA person completes 5 rounds (revolutions) on a circular path of radius 50 m. Find out the distance travelled by that person and magnitude (value) of displacement.
View Solution
View SolutionTake an empty plastic bottle . Close the mouth of the bottle with an airtight stopper . Put it in a bucket filled with watere . The bottle floats .
Push the bottle into the water. You feel an upward push. Try to push it further down. You will find it difficult to push deeper and deeper. Water exerts a force on the bottle in upward direction. Now release the bottle. It bounces back to the surface.
Does the force due to the gravitational attraction of the earth act on this bottle? If so, why doesn't the bottle stay immersed in water after it is released ?
View SolutionThe mass of a car is 1200 kg. It comes to rest due to retardation of 2ms−2 .
What would be the force (frictional force) acting between the car and road ?
View SolutionThe speed-time graph for a car is shown is Figure
(a) Find how far does the car travel in the first 4 seconds. Shade the area on the graph that represents the distance travelled by the car during this period.
(b) Which part of the graph represents uniform motion of the car ?
View SolutionThe speed-time graph for a car is shown is Figure

(a) Find how far does the car travel in the first 4 seconds. Shade the area on the graph that represents the distance travelled by the car during this period.
(b) Which part of the graph represents uniform motion of the car ?
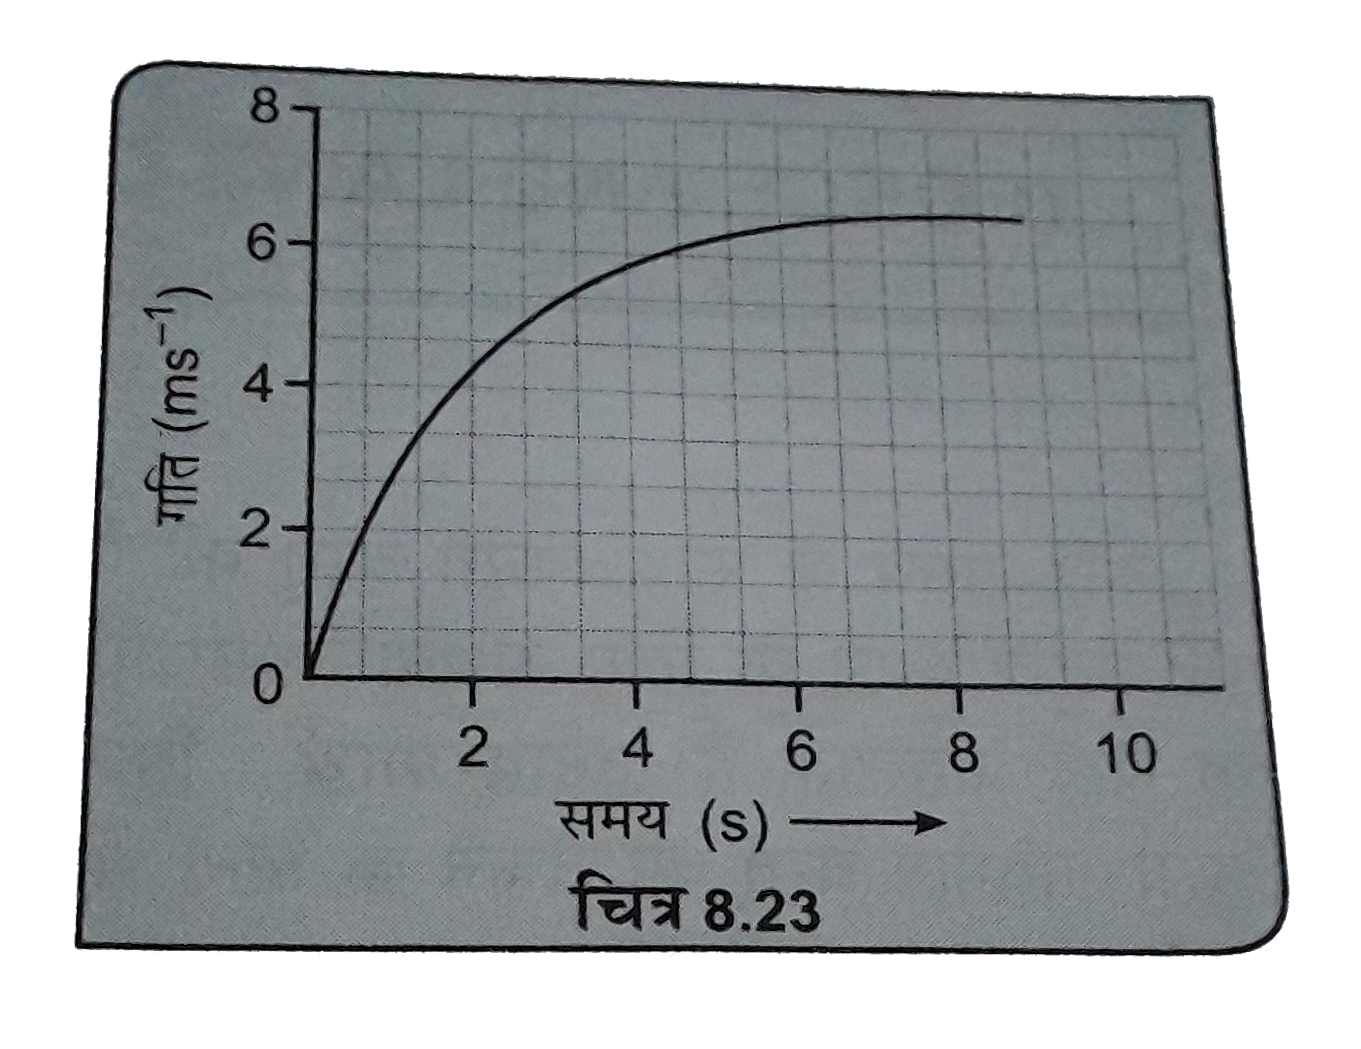
View Solutionकिसी कार का चाल-समय चित्र में दर्शाया गया है ।
(a) पहले 4 s में कार कितनी दूरी तय करती है ? इस अवधि में कार द्वारा तय की गई दूरी को ग्राफ में छायांकित क्षेत्र द्वारा दर्शाइए ।
(b) ग्राफ का कौन-सा भाग कार की एकसमान गति को दर्शाता है ?
View SolutionThe speed-time graph for a car is shown is Fig.
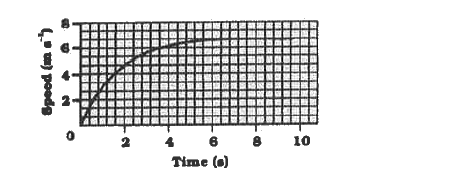
Find how far does the car travel in the first 4 seconds. Shade the area on the graph that represents the distance travelled by the car during the period.
View SolutionThe speed-time graph for a car is shown is Fig.
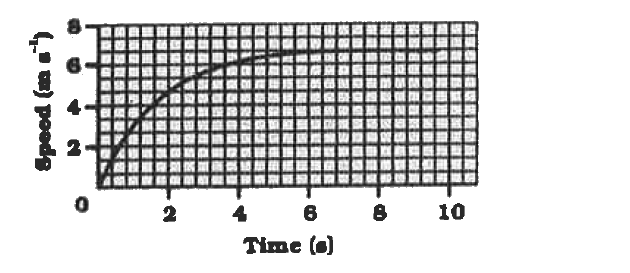
Which part of the graph represents uniform motion of the car?
View SolutionThe speed time graph for a car is shown in fig 8.12
Find out how far the car travels in the first 4 seconds. Shade the area on the graph that represents the distance travelled by the car during the period.
View SolutionThe speed time graph for a car is shown in fig 8.12
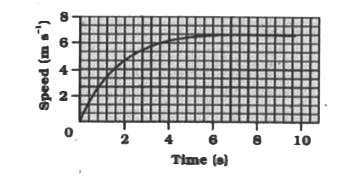
Which part of the graph represents uniform motion of the car?
View SolutionThe speed-time graph for a car is shown is Figure

(a) Find how far does the car travel in the first 4 seconds. Shade the area on the graph that represents the distance travelled by the car during this period.
(b) Which part of the graph represents uniform motion of the car ?
View SolutionSpeed - time graph for a car is show in the fig 1.13:Which part of the graph represents uniform motion of the car ?
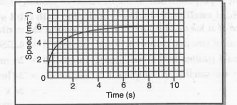
View SolutionThe speed-time graph for a car is shown in Fig.8.12. Find how far does the car travel in the first 4 seconds. Shade the area on the graph that represents the distance travelled by the car during the period.

View Solution
