The stress strain graph for materials A and B are as shown in the graphs are drawn to the same scale, which graph represents property of ductile materials? Justify your answer.

The graph is material A represents the property of ductile material because of its greater plastic range.
Topper's Solved these Questions
- ELASTICITY BOOK - CHHAYA PUBLICATIONCHAPTER - ELASTICITY EXERCISE - EXAMINATION ARCHIVE WITH SOLUTIONS (NEET)
2 Videos
- DOPPLER EFFECT IN SOUND BOOK - CHHAYA PUBLICATIONCHAPTER - DOPPLER EFFECT IN SOUND EXERCISE - CBSE SCANNER
2 Videos
- EXPANSION OF GASESBOOK - CHHAYA PUBLICATIONCHAPTER - EXPANSION OF GASESEXERCISE - CBSE Scanner
1 Videos
Similar Questions
Knowledge Check
The stress- strain graphs for materials A and B are as shown. Choose the correct alternative
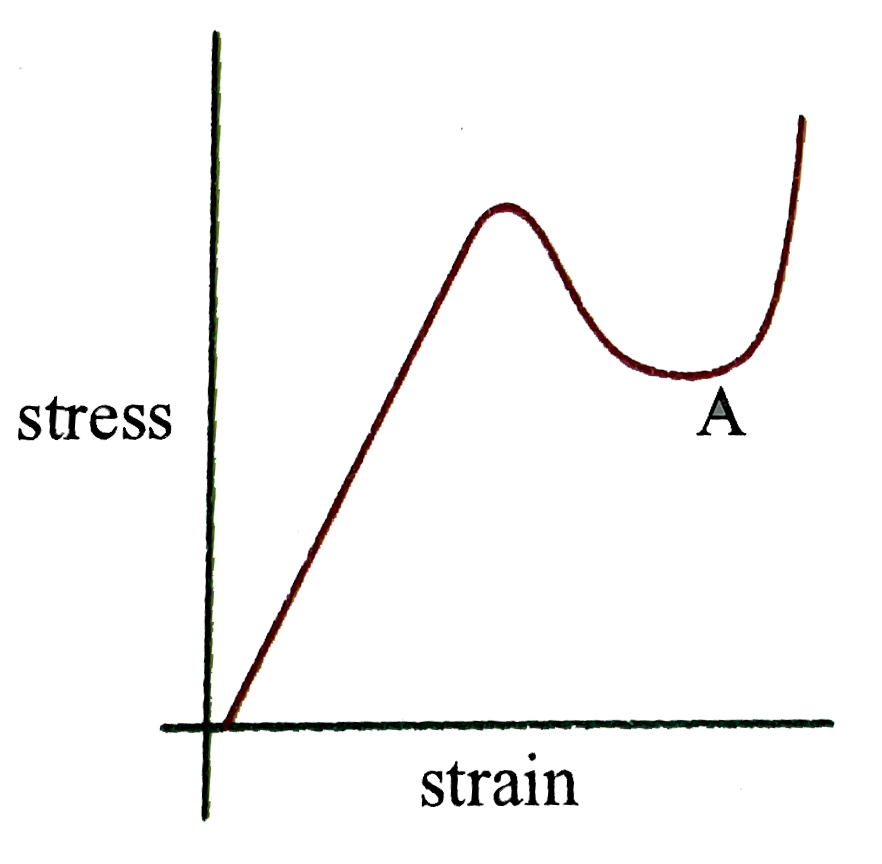
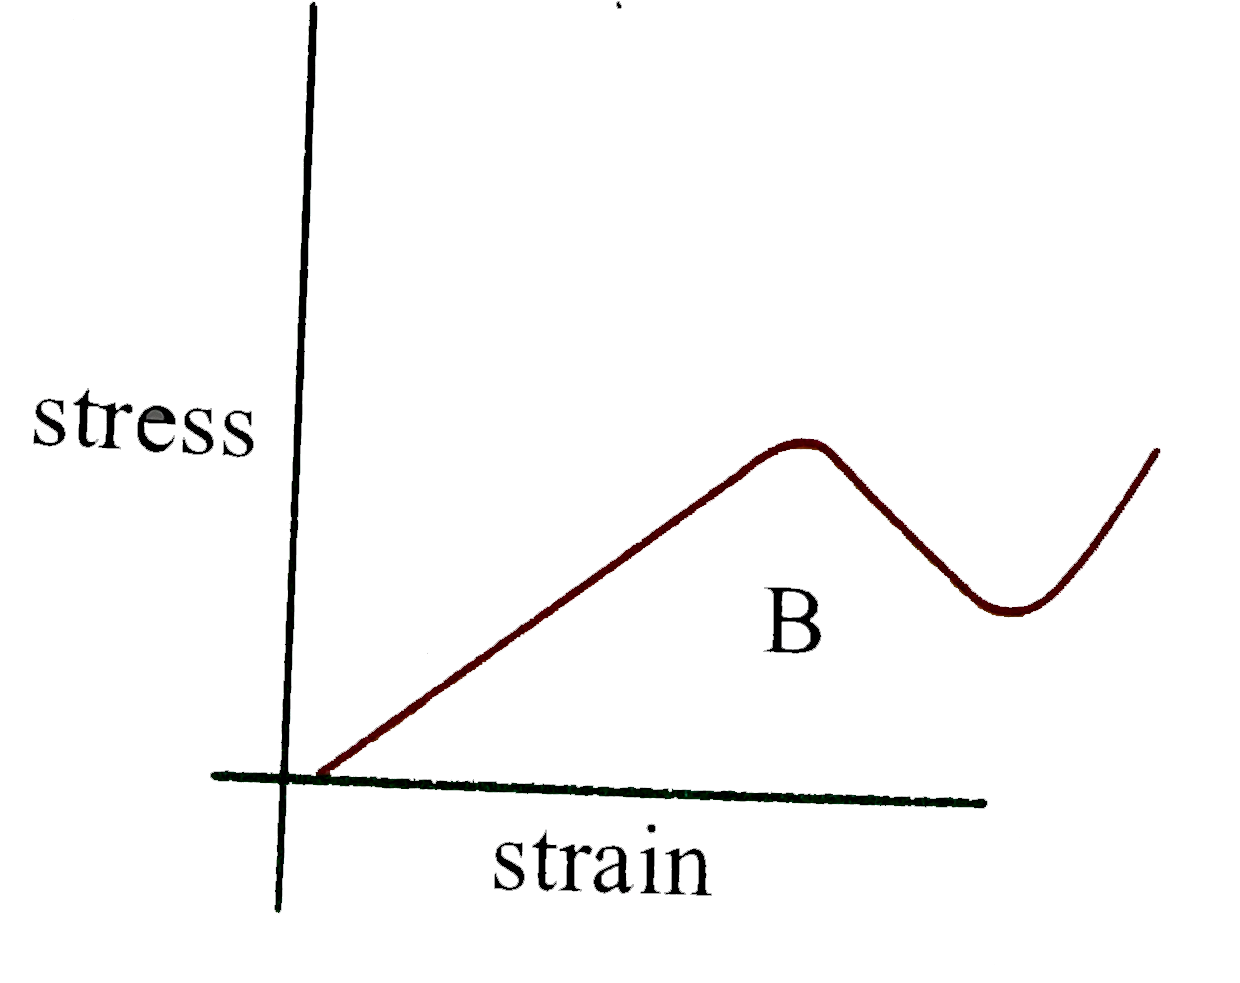 Amaterial A is stronger than material BBmaterial B is stronger than material ACYoung's modulus of A is greater than that of BDYoung's modulus of B is greater than that of A
Figure shows the stress-strain graphs for materials .A and B. From the graph it follows that
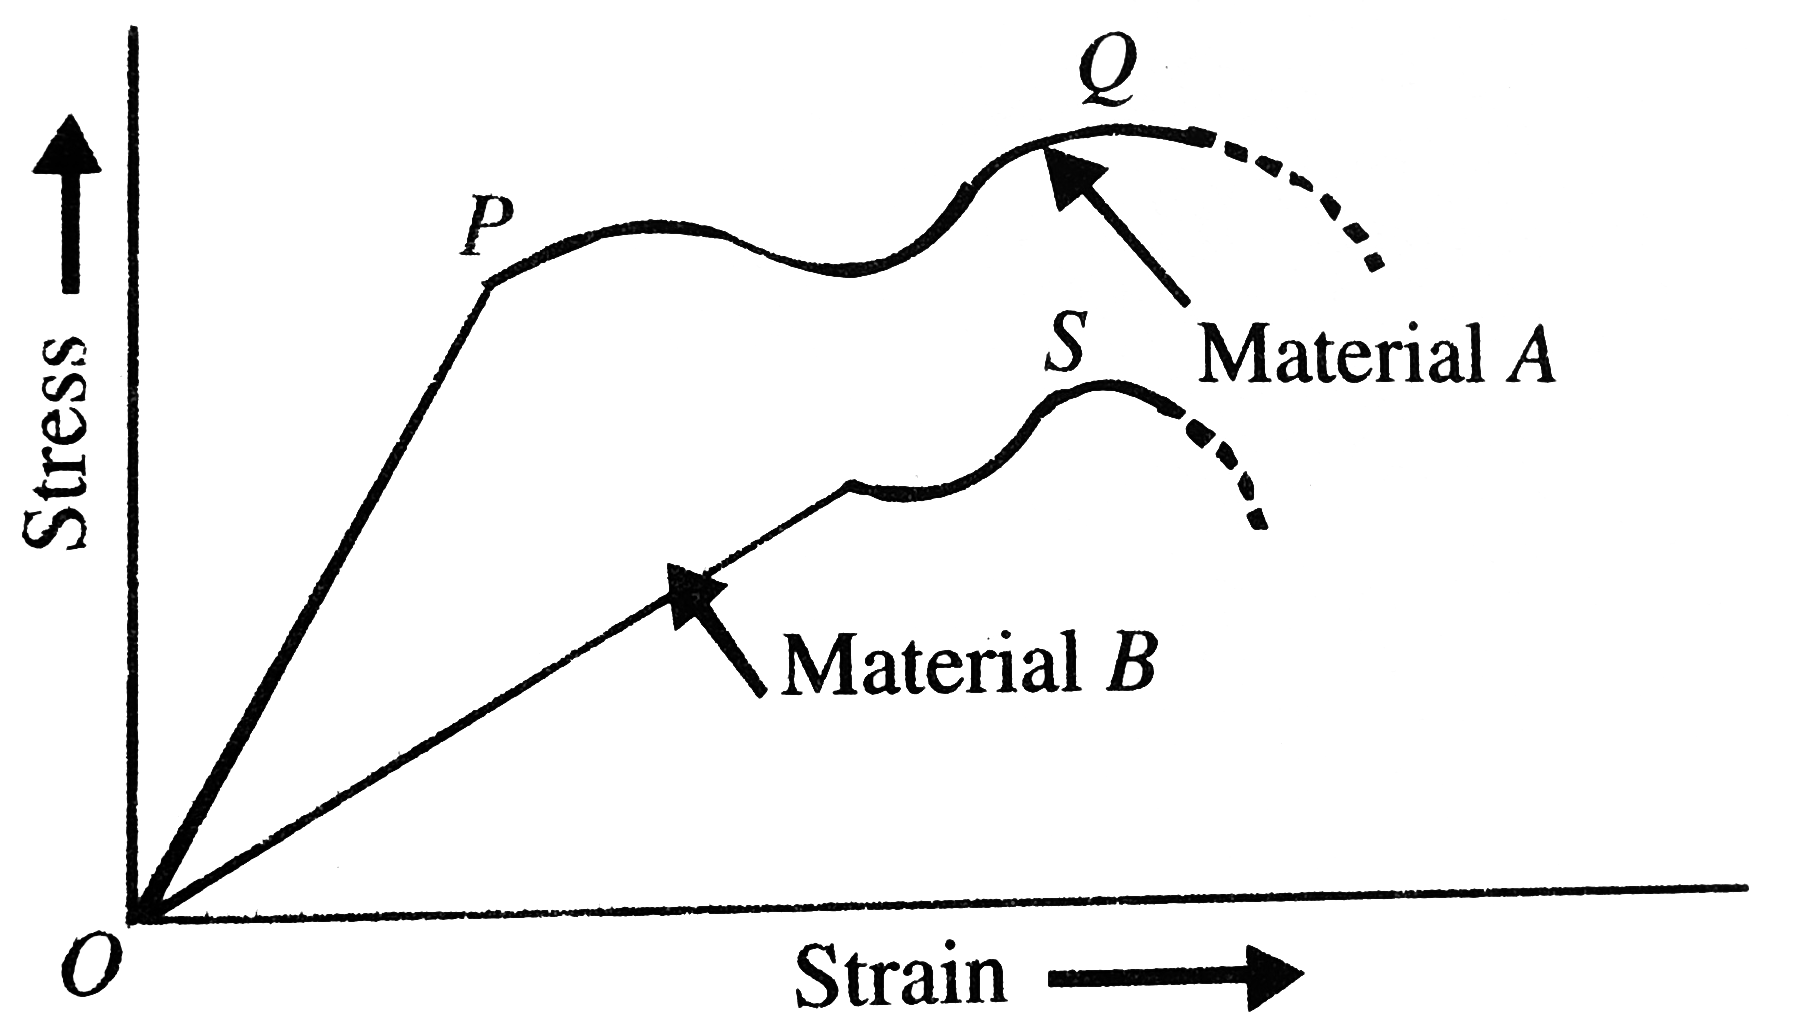 Ato material A has a higher Young's modulusBmaterial B is more ductileCmaterial A can withstand greater stressDmaterial B can withstand greater stress
The stress-strain graphs for two materials A and are shown in figure. The graphs are drawn to the same scale. Select the correct statement
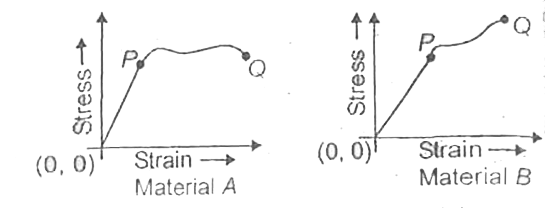
View SolutionThe stress-strain graphs for two materials A and B are shown in the figure. The graphs are drawn to the same scale.
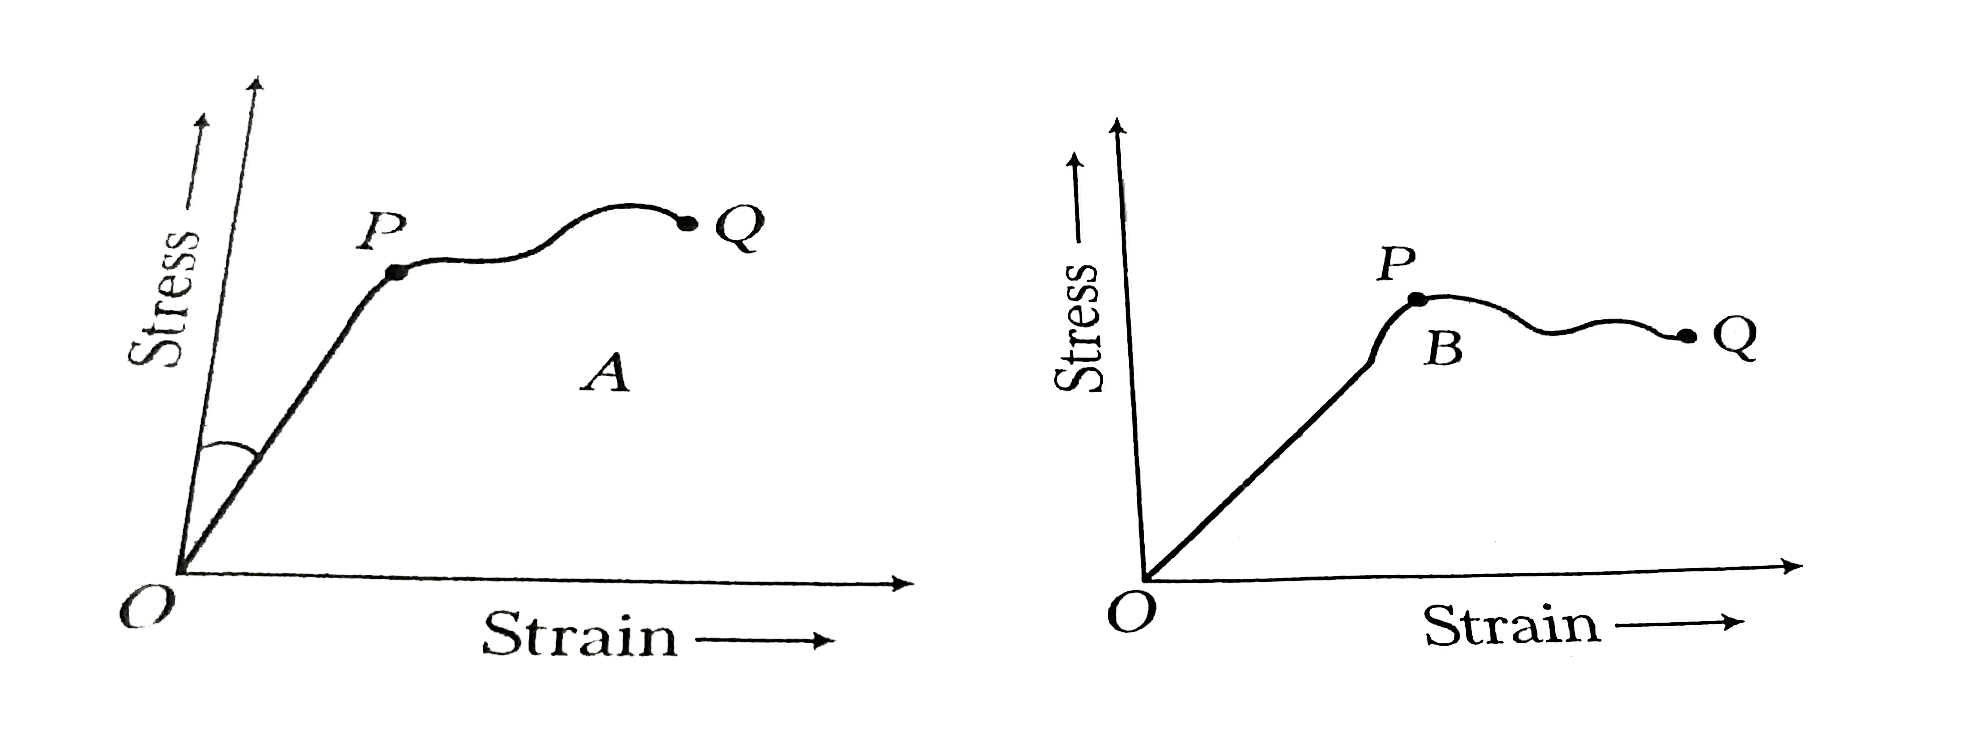
(a) Which material has a greater Young's modulus ?
(b) Which material is more ductile ?
(c) Which material is more brittle?
(d) Which of the two is the stronger material ?
View SolutionThe stress-strain graphs for two materials A and B are shown in the figure. The graphs are drawn to the same scale.

(a) Which material has a greater Young's modulus ?
(b) Which material is more ductile ?
(c) Which material is more brittle?
(d) Which of the two is the stronger material ?
View SolutionThe stress versus strain graphs for two materials A and B are shown in Figure. ( The graphs are drawn to the same scale) (a) Which material has greater Young's modulus ? (b) Which material is more ductile ? ( c) Which is more brittle ? ( d) Which of the two is the strong material?
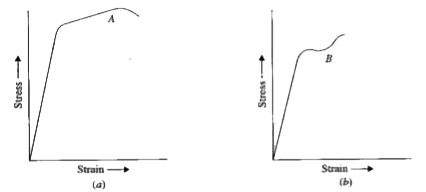
View SolutionFigure shows the stress-strain graphs for materials .A and B. From the graph it follows that

View SolutionFigure shows the stress-strain graphs for materials .A and B. From the graph it follows that

View Solution
