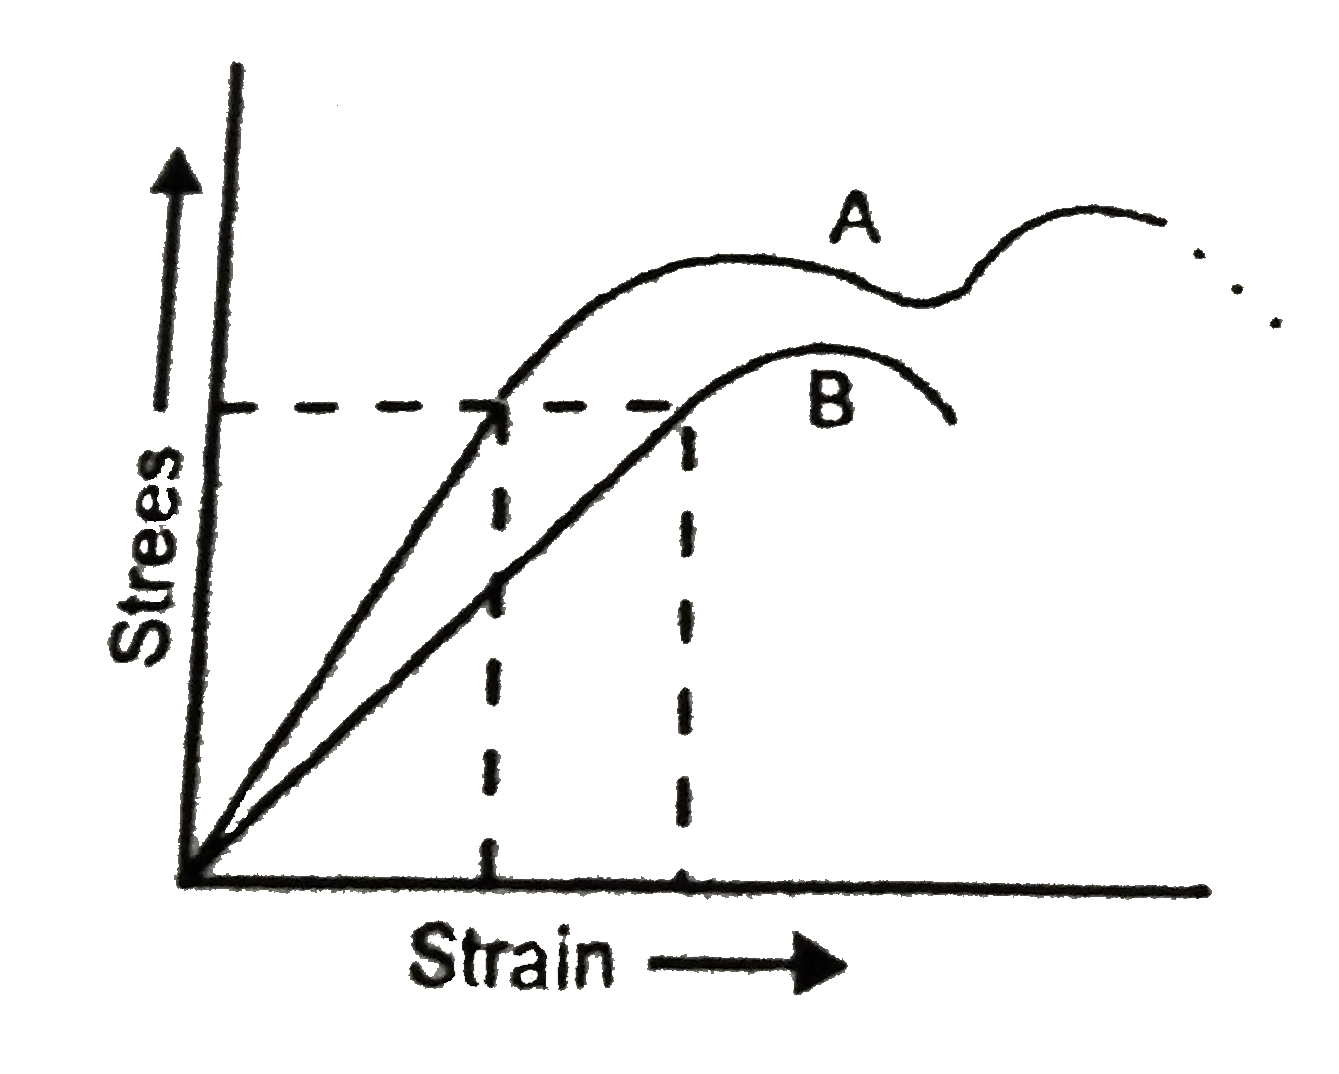
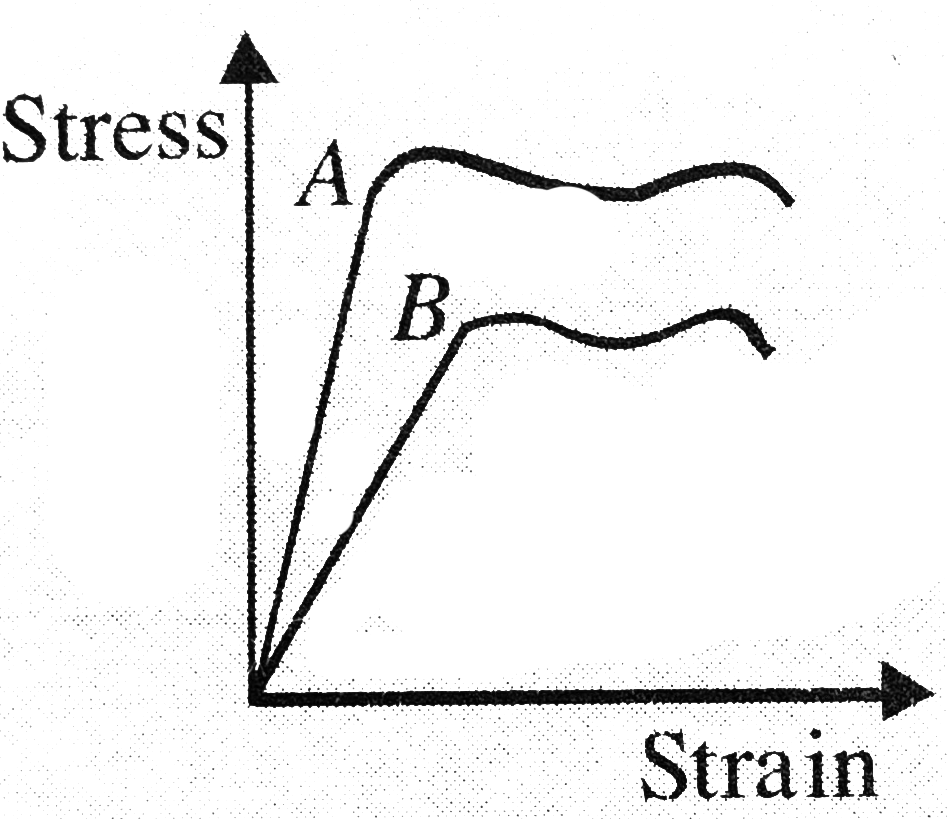
The stress-strain graphs for two materials A and B are shown in the figure. The graphs are drawn to the same scale.
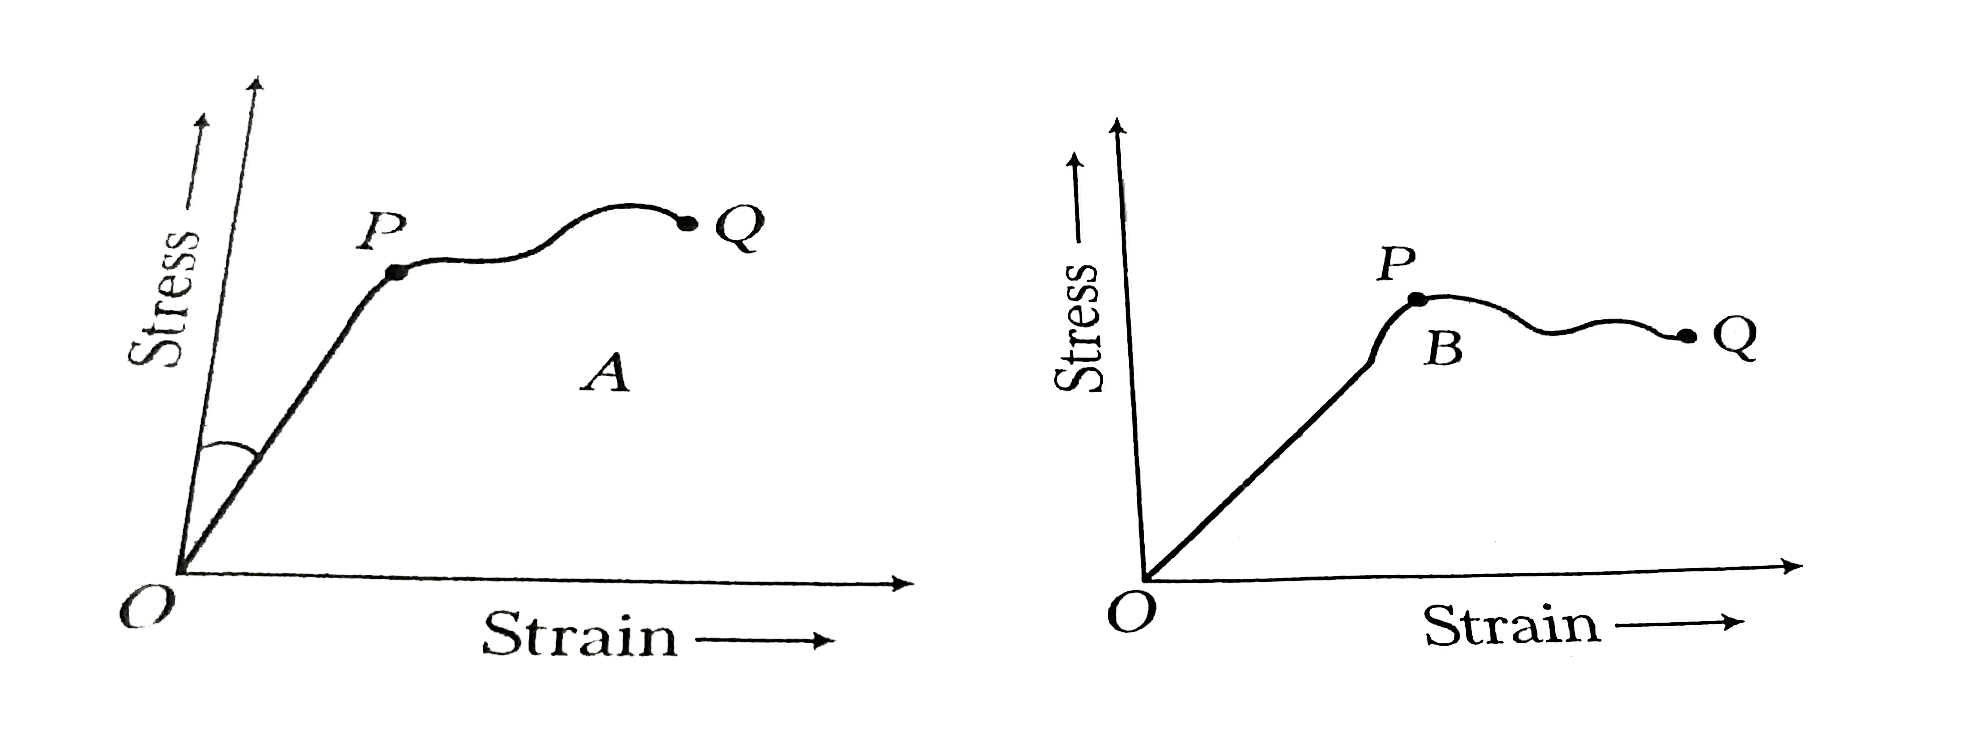
(a) Which material has a greater Young's modulus ?
(b) Which material is more ductile ?
(c) Which material is more brittle?
(d) Which of the two is the stronger material ?
(a) Material A has a greater Young's modulus because the slope of the linear portion of the stress-strain curve is greater for the material A.
(b) Material A is more ductile, because it has a greater plastic region (from elastic limit P to breaking point Q) than material B.
(c) Material B is more brittle , because it has a smaller plastic region.
(d) Material A is stronger , because it can withstand a greater stress before it breaks.
Topper's Solved these Questions
- BOOK - DC PANDEYCHAPTER - ELASTICITYEXERCISE - Check point 12.115videos
ELASTICITY
- BOOK - DC PANDEYCHAPTER - ELASTICITYEXERCISE - Check point 12.215videos
ELASTICITY
- BOOK - DC PANDEYCHAPTER - ELASTICITYEXERCISE - Level 2 Subjective10videos
ELASTICITY
- BOOK - DC PANDEYCHAPTER - CURRENT ELECTRICITYEXERCISE - All Questions434videos
CURRENT ELECTRICITY
- BOOK - DC PANDEYCHAPTER - ELECTROSTATICSEXERCISE - Integer17videos
ELECTROSTATICS
Similar Questions
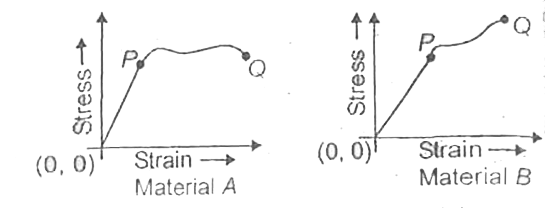
The stress-strain graphs for two materials A and are shown in figure. The graphs are drawn to the same scale. Select the correct statement
 View Solution
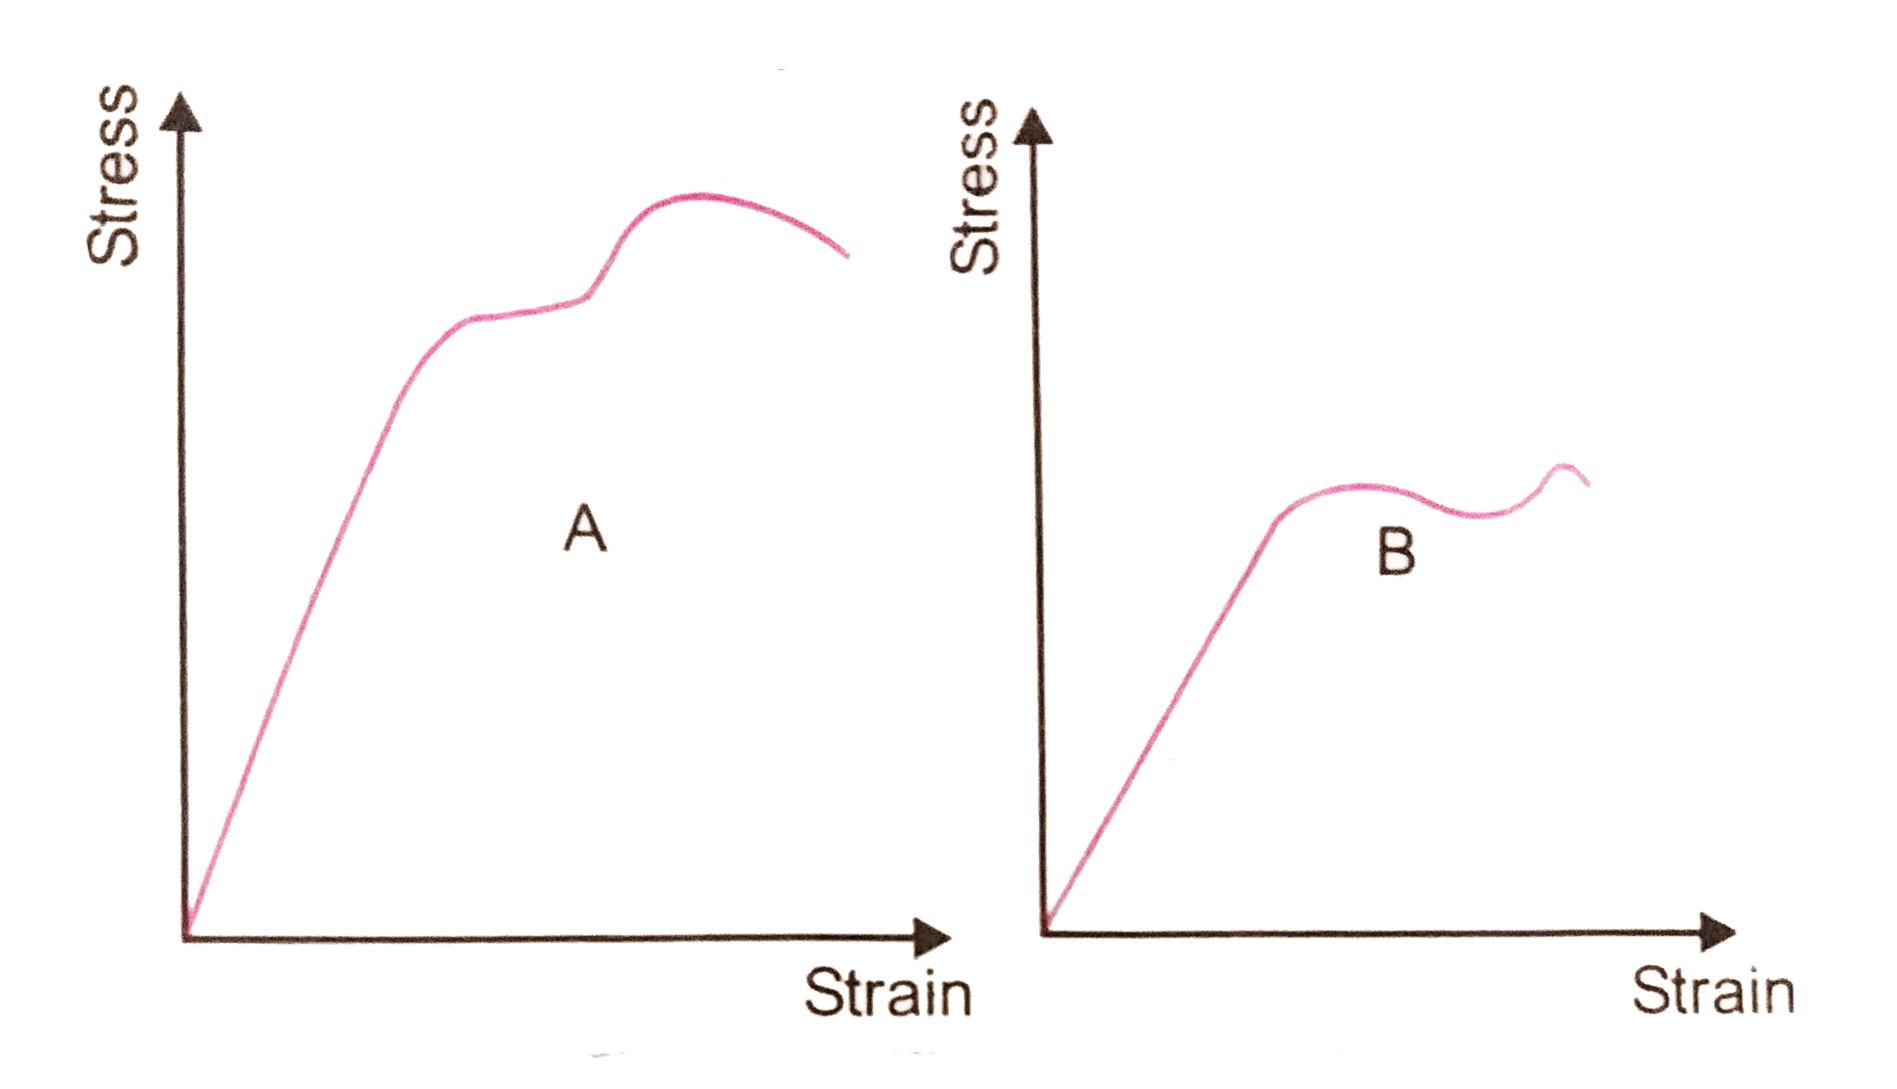
The stress versus strain graph for two materials A and B are shown in fig. the graph are on the same scale. ltbr> (a) Which materail has greater Young's modulus?
(b) which of the two is stronger materail?
 View Solution
Knowledge Check
- Question 1 - Select One or More
The stress- strain graphs for materials A and B are as shown. Choose the correct alternative
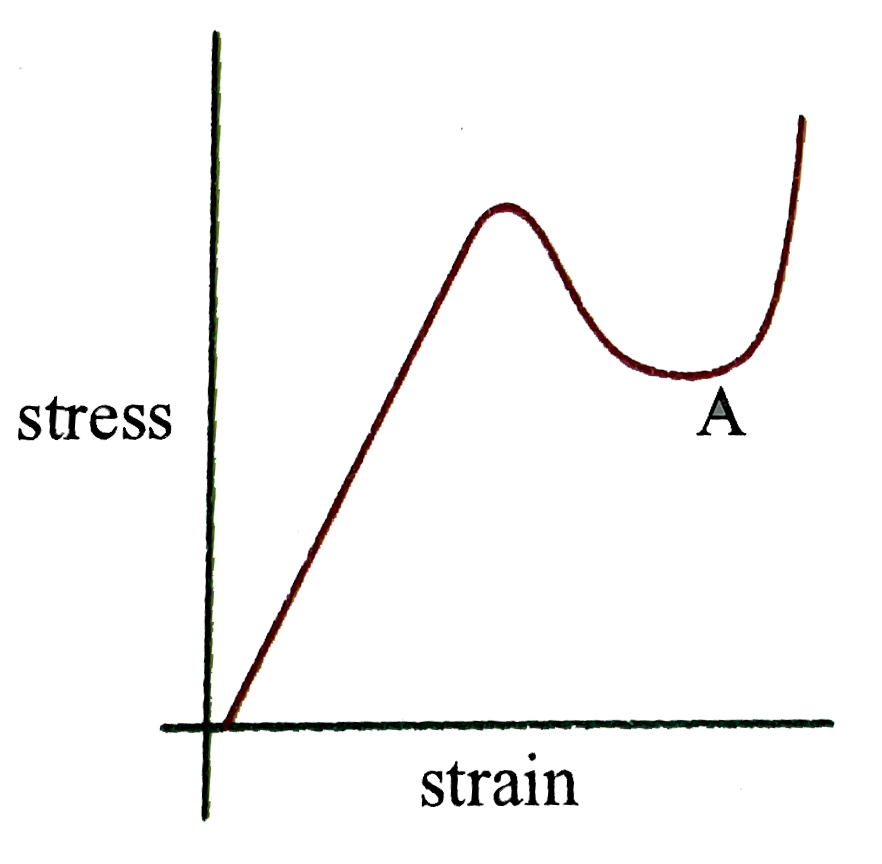
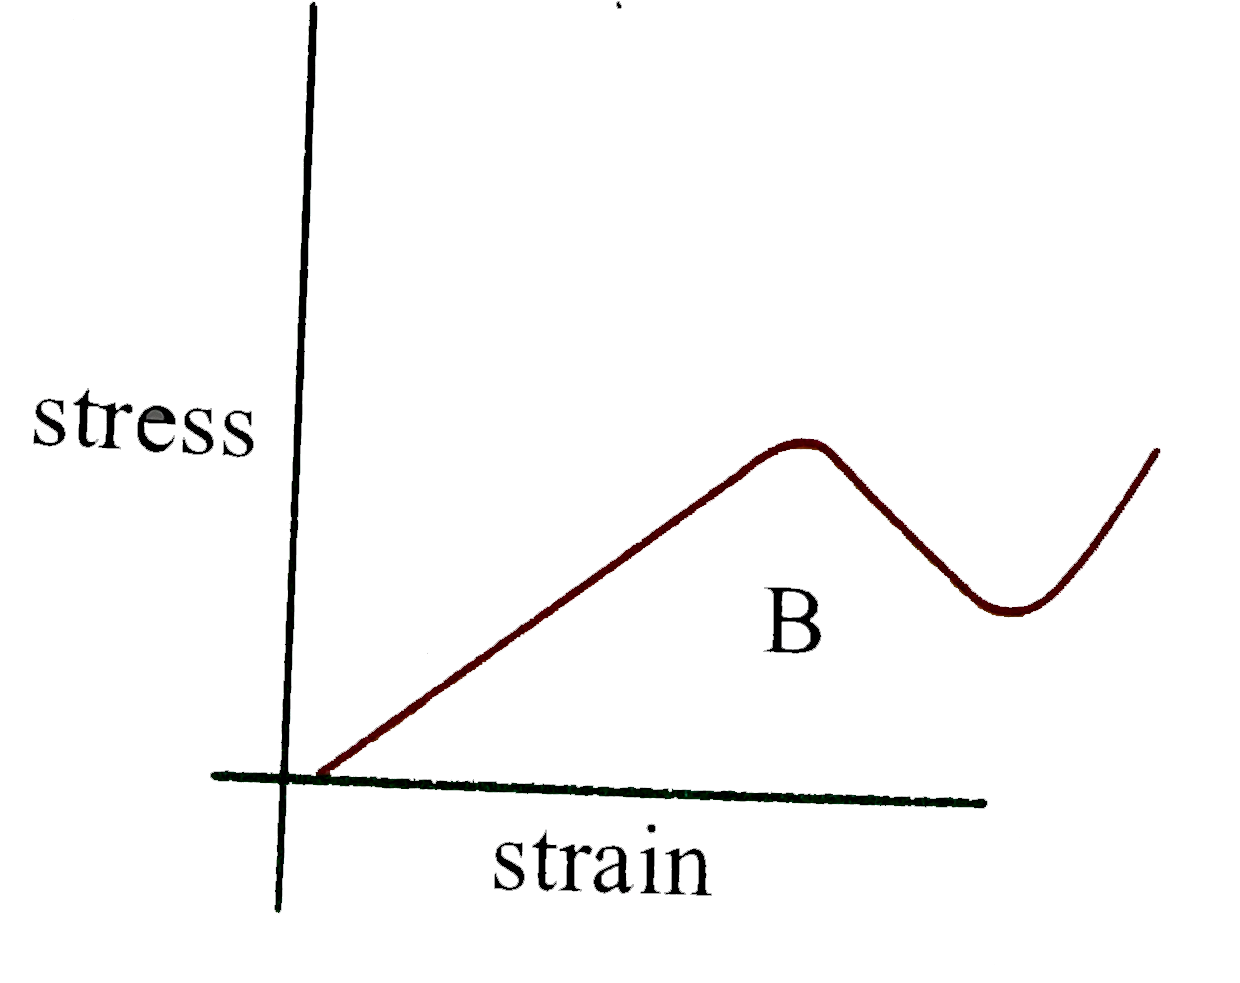 Amaterial A is stronger than material BBmaterial B is stronger than material ACYoung's modulus of A is greater than that of BDYoung's modulus of B is greater than that of A
 - Question 2 - Select One or More
The stress-strain graphs for two materials are shown in Fig. 7(EP).3 (assume scale).
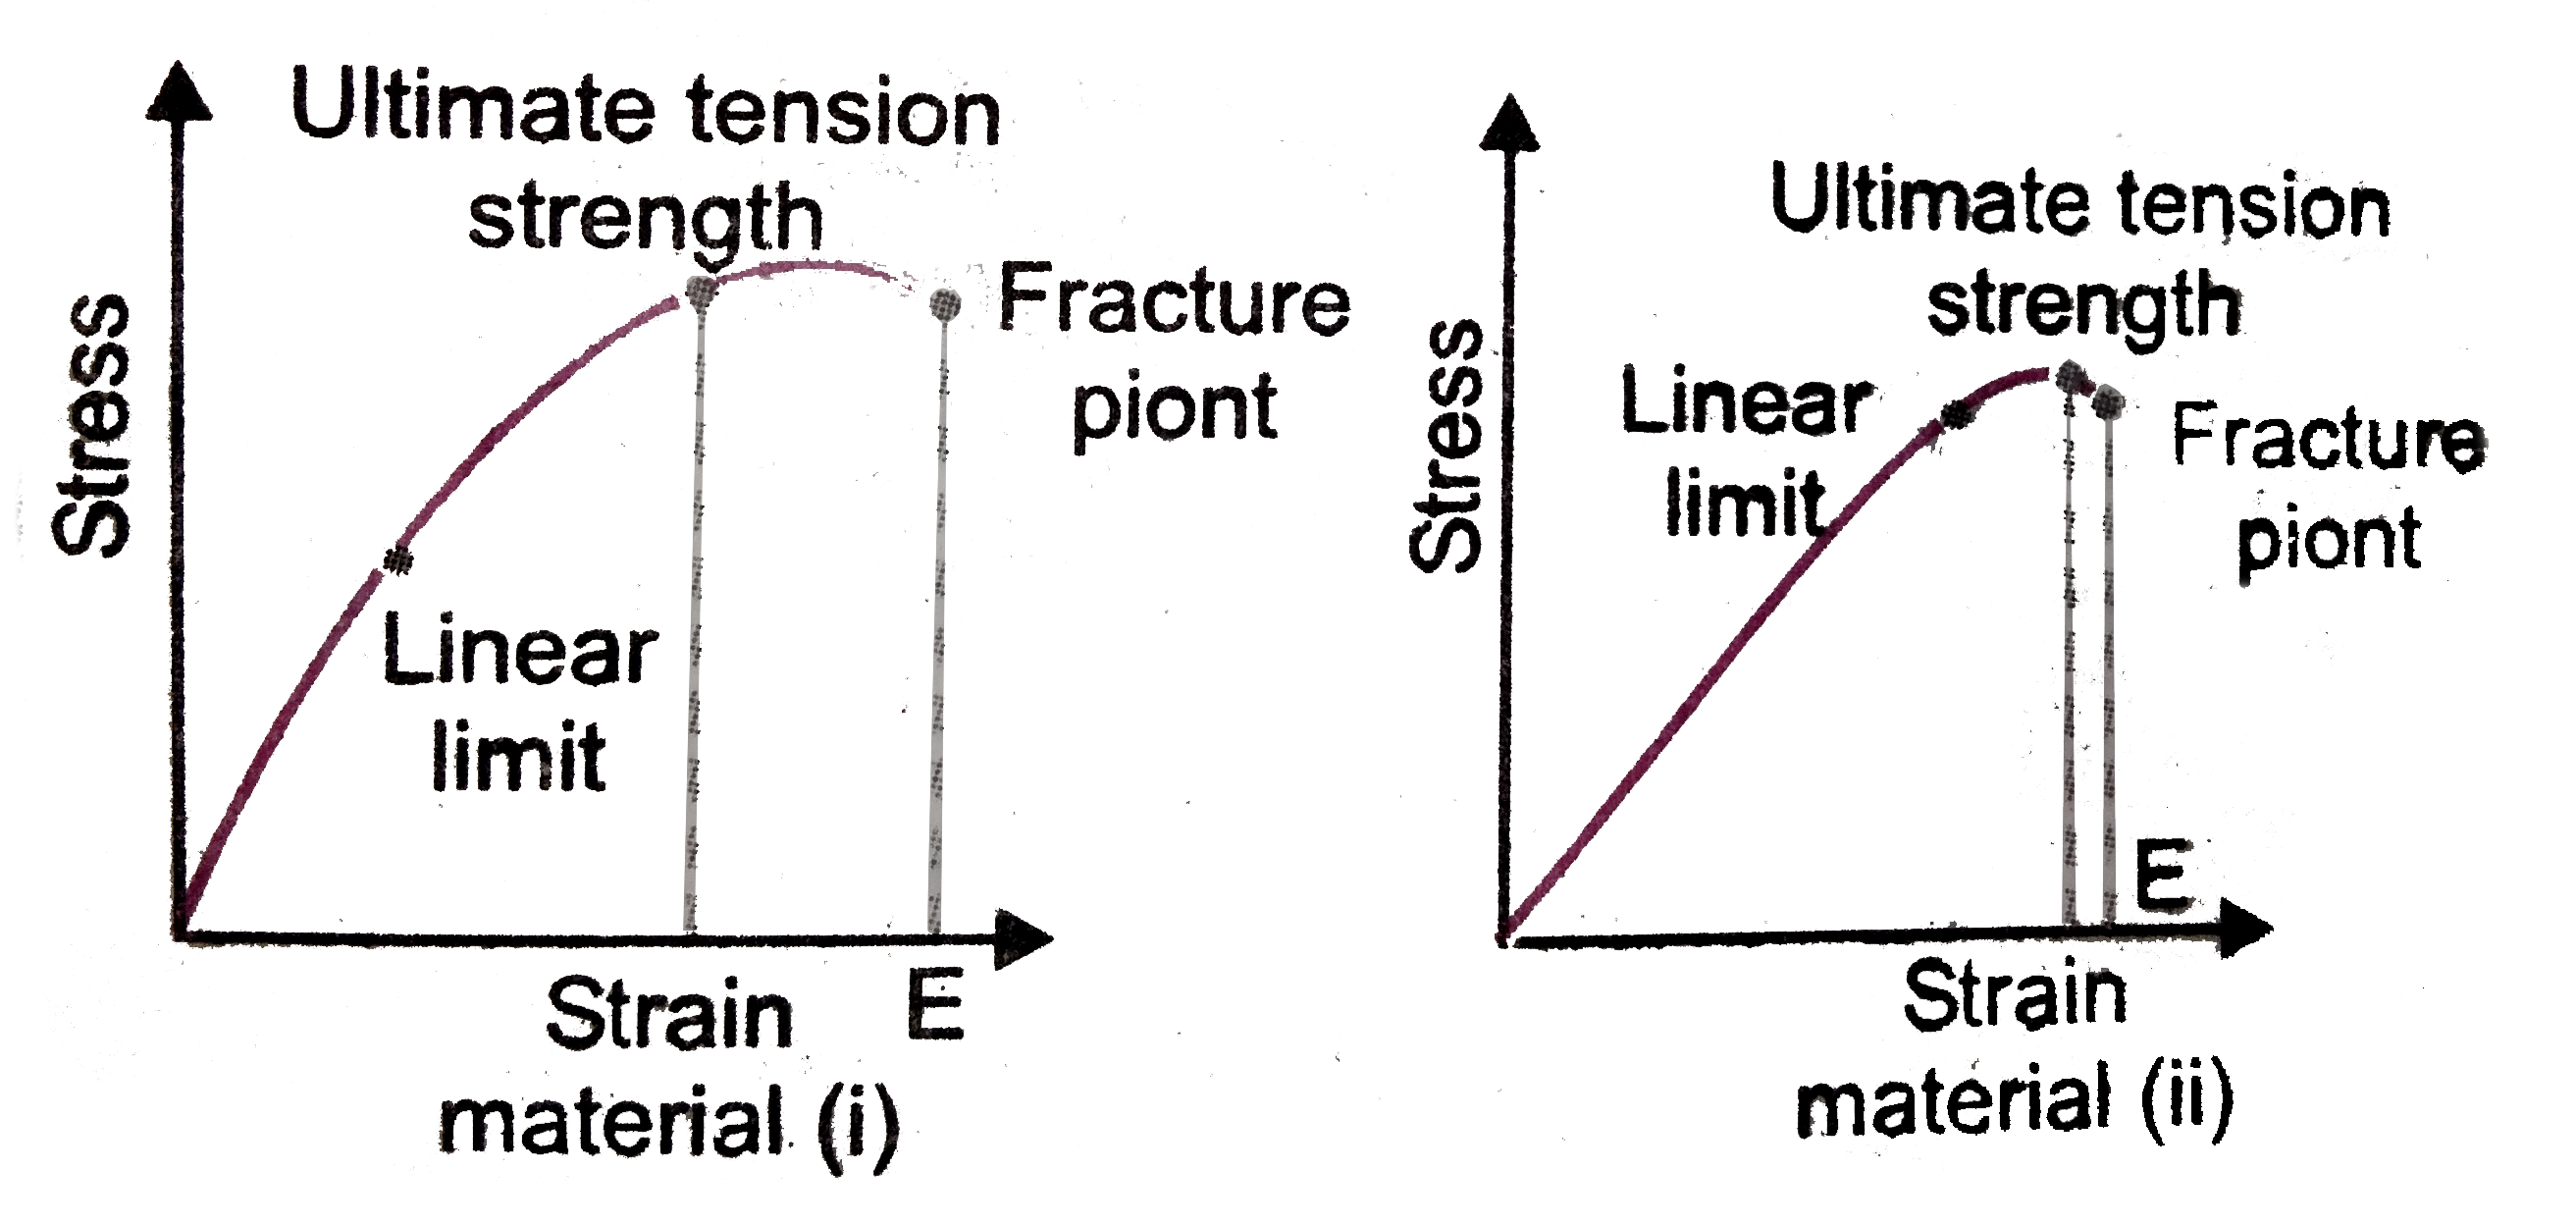 AMaterial (ii) is more elastic than material (i) and hence material (ii) is more brittle.BMaterial (i) and (ii) have the same elasticity and the same brittleness.CMaterial (ii) is elastic over a larger region of strain as compared to (i).DMaterial (ii) is more brittle than material (i).
 - Question 3 - Select One
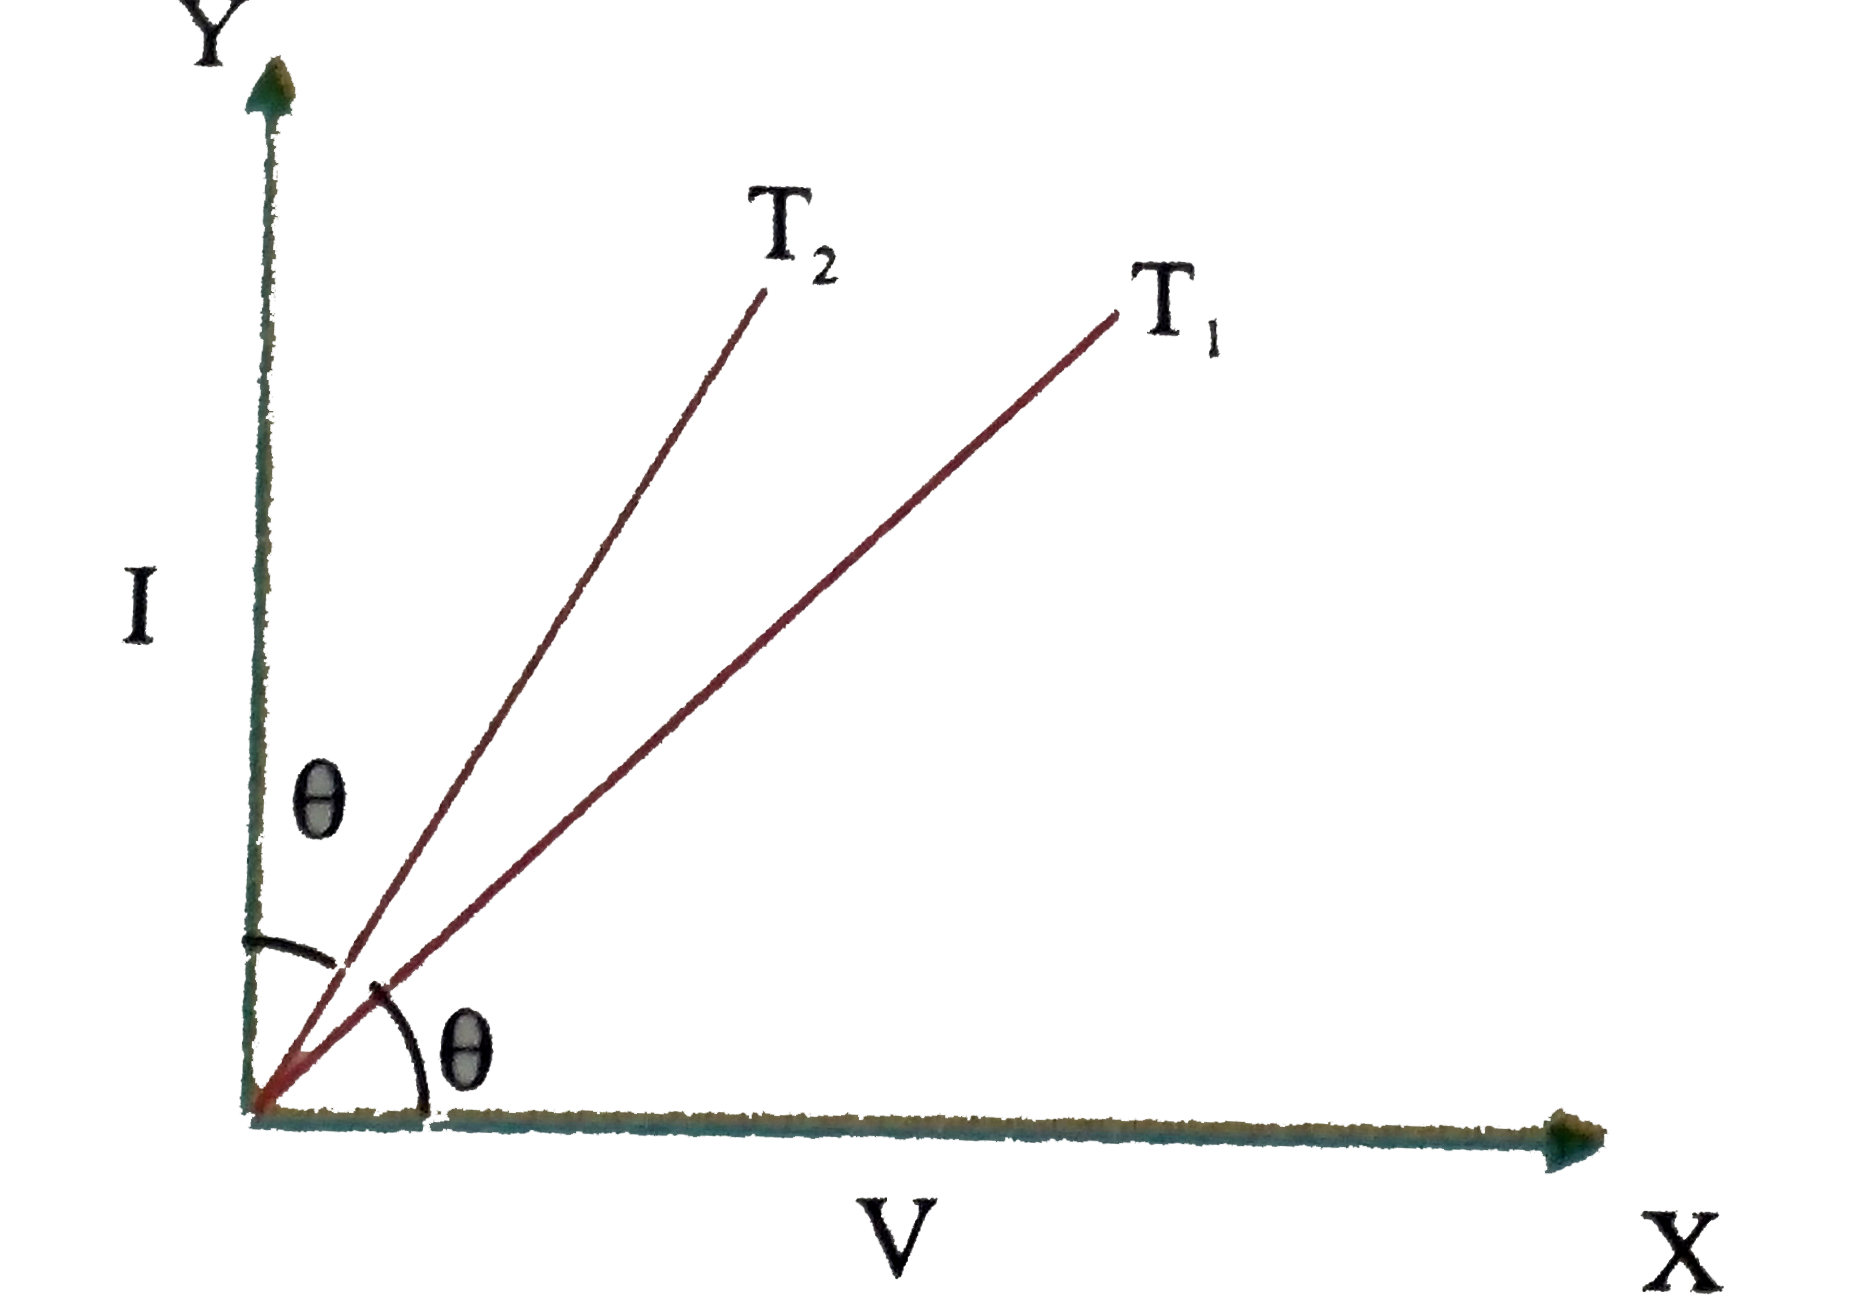
V−I graphs for a material is shown in the figure. The graphs are drawn at two different temperatures.AT1−T2∝cot2θBT1−T2∝sin2θCT1−T2∝tan2θDT1−T2∝cos2θ
Which material is best conductor?
View SolutionIn the figure shown the straing versus stress graph for two values of young's modulus ?
(i) which material is more ductile ? Explain.
(ii) Which material is more brittle ? Explain.
(iii) Which material is stronger ? Explain.View SolutionThe stress and strain graphs for two materials, A and B are shown here. Answer the following:
 give reasonsView Solution
Which of these is a thermoplastic material?
View Solution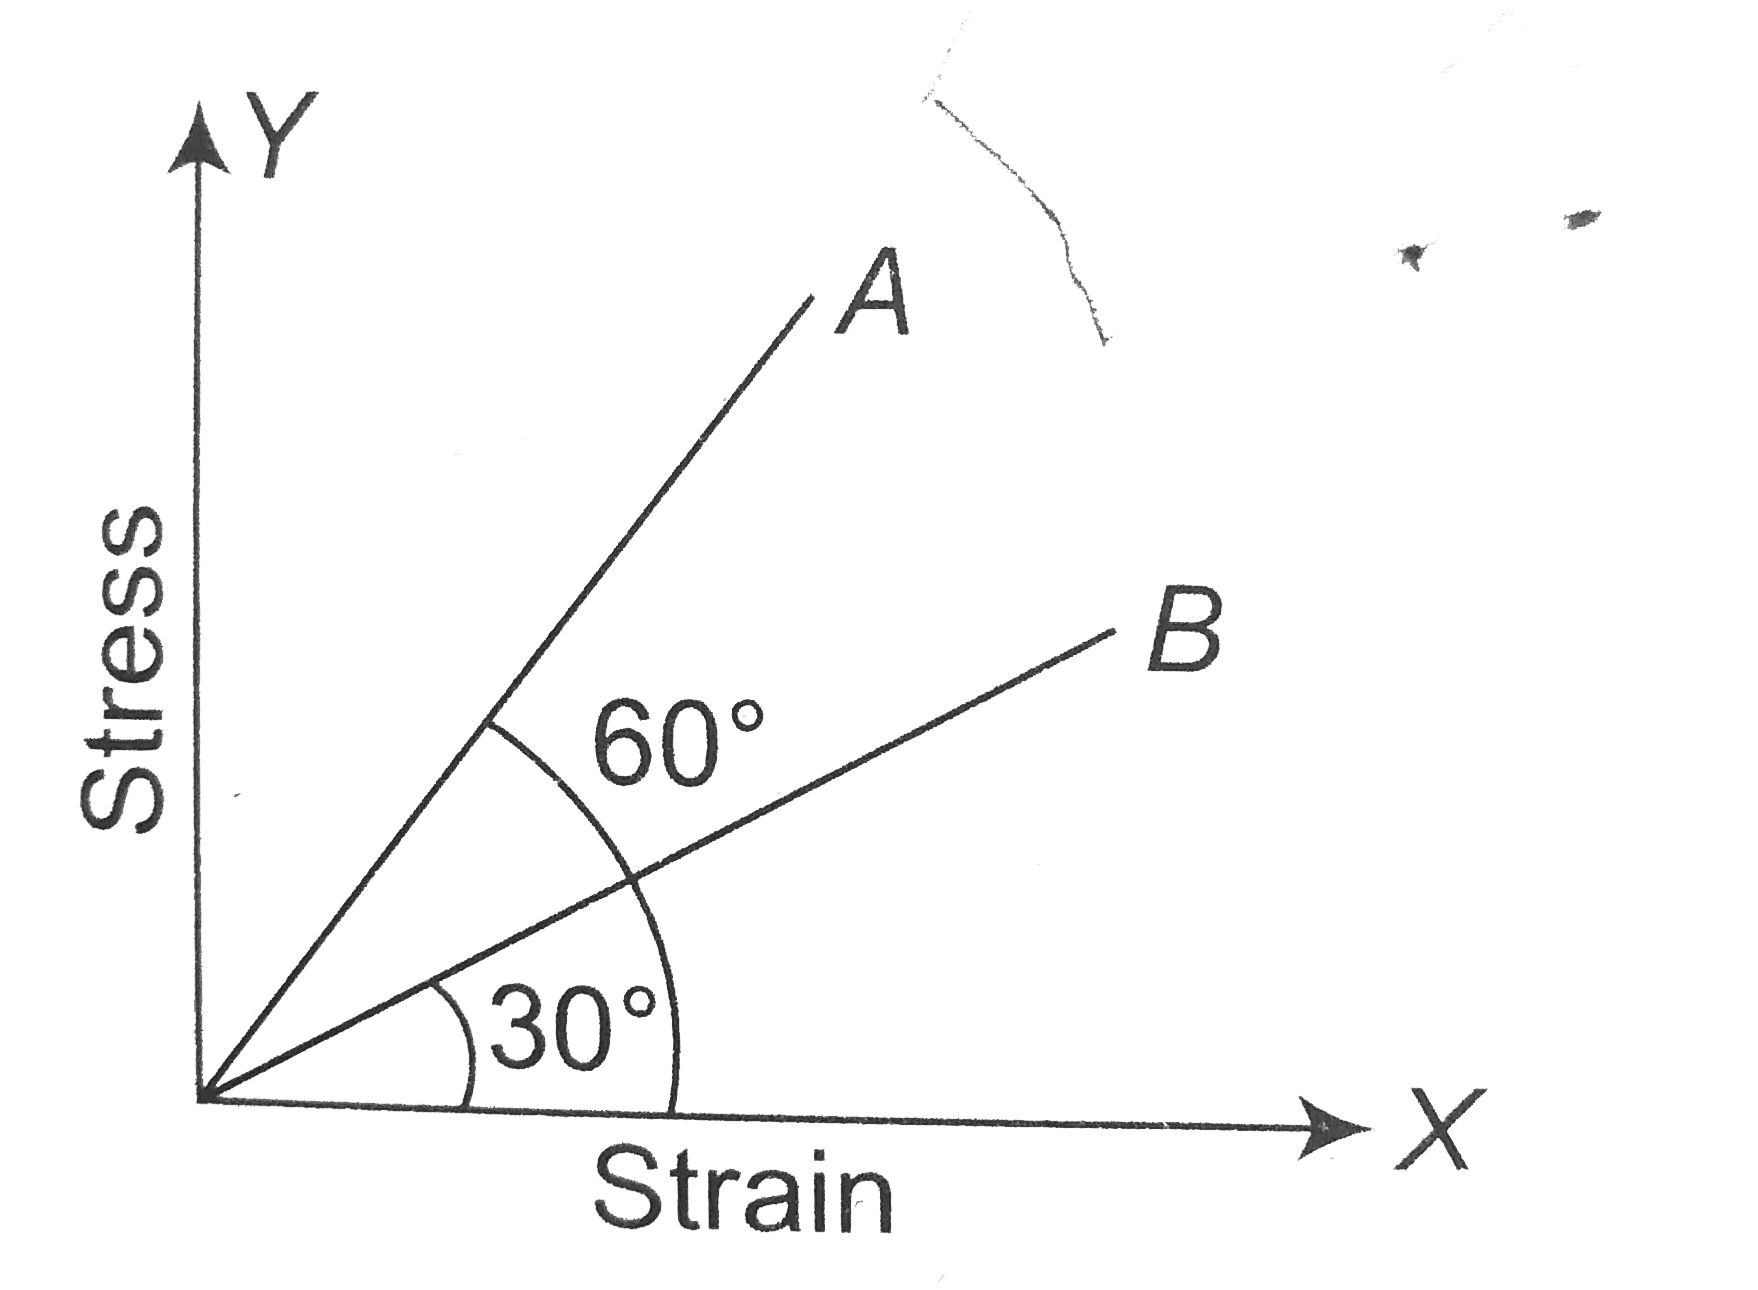
The stress versus strain graphs for wires of two materials A and B are as shown in the figure. If YA and YB are the Young's moduli of the materials thenView Solution
