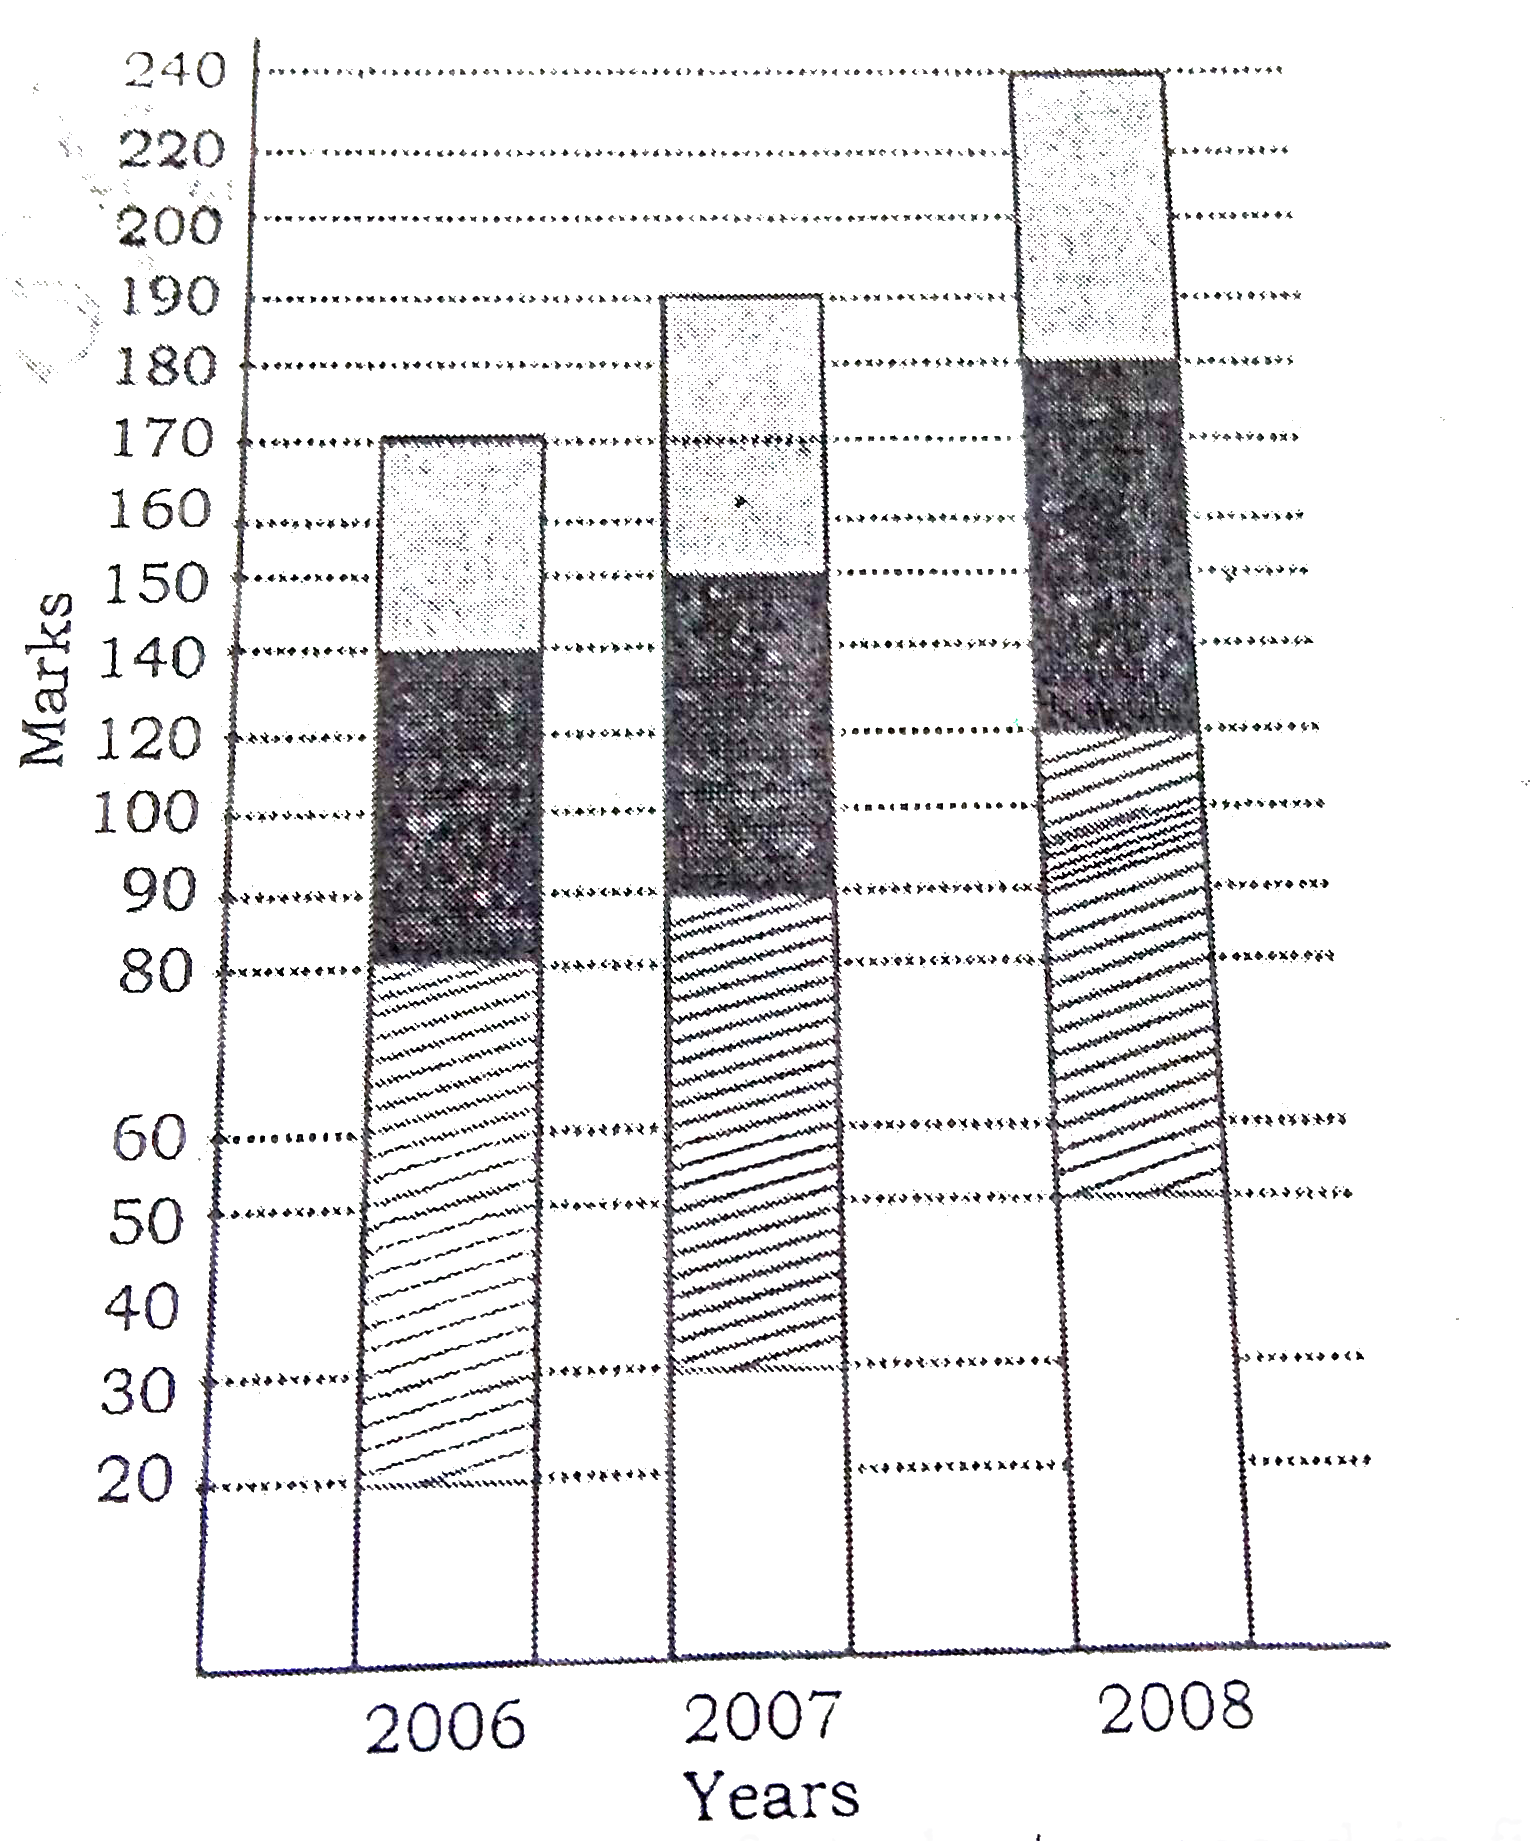
The subdivided bar diagram given below depicts the result of B com students of a college for 3 years Study the graph and answer the given questions

वर्ष 2007 में प्रथम श्रेणी में पास होने वाले छात्रों का % बताये ।
151519%
111317%
1623%
1212%
Total number of students in year 2007=190
Students who passed in first division=30
Required percent =30190×100J=30019151519%
Topper's Solved these Questions
Similar Questions
सरल करें: 1+11+22+31+45
01:58View SolutionA एक काम को 6 दिनों में तथा B उसी काम को 9 दिनों में कर सकता है दोनों मिलकर उस काम को कितने दिन में पूरा करेंगे ?
02:21View SolutionThe subdivided bar diagram given below depicts the result of B com students of a college for 3 years Study the graph and answer the given questions

वर्ष 2008 में उत्तीर्ण छात्रो का % बताये ।02:11View SolutionThe subdivided bar diagram given below depicts the result of B com students of a college for 3 years Study the graph and answer the given questions

किस वर्ष में वाणिज्य विषय का सर्वश्रेष्ठ परिणाम रहा ।01:31View SolutionDetermine the point of symmetry of a regular hexagon.
02:45View SolutionDtermine the images of the following figure about the given line :
02:17View SolutionMatch the following Column A to Column B
 05:41View Solution
Match the following Column A to Column B
 03:28View Solution
Match the following Column A to Column B
 02:31View Solution
Find the area of figure given below.
 02:21View Solution
Find the perimeter of the figure given below.
 02:03View Solution
Find the area of the figure given below.
 02:10View Solution
The area of the shaded part in the figure given below is ______.
 02:17View Solution
The inequation represented by the graph given below is :
02:10View SolutionThe inequation that best describes the graph given below is _________
04:23View Solution

