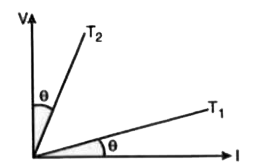
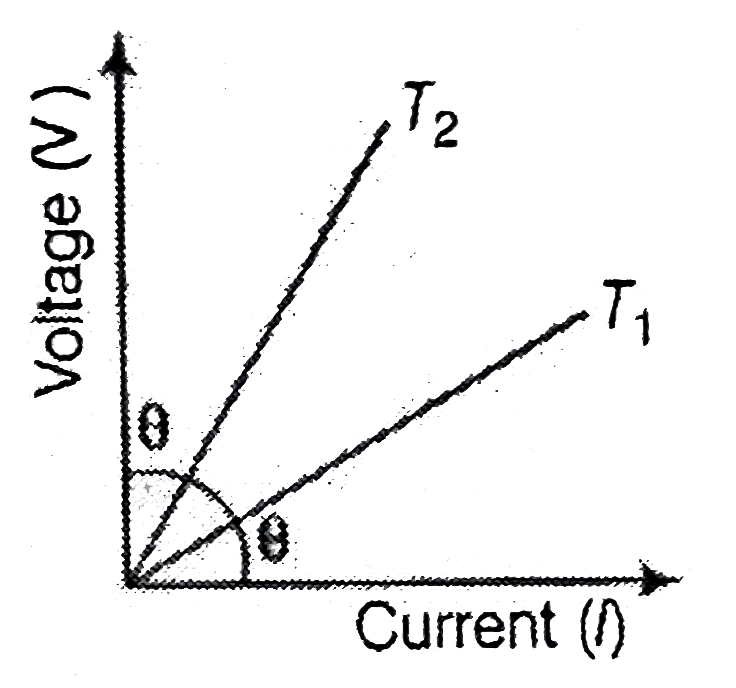
The V - I graph for a conductor at temperatures T1 and T2 are as shown in the fig, then T2−T1 is proportional to :
tan2θ
cos2θ
cot2θ
sin2θ
The correct Answer is:C
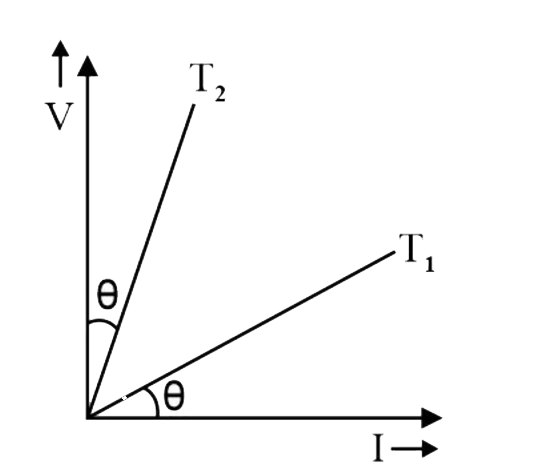
R1=tanθ=R0(1+αT1)
R2=cotθ=R0(1+αT2)
cotθ−tanθ=R0(T2−T1).α
cosθsinθ−sinθcosθ=R0.α(T2−T1)
cos2θ−sin2θsinθcosθ=R0α(T2−T1)
⇒2cos2θsin2θ=R0α(T2−T1)
∴(T2−T1)∝cot2θ
Topper's Solved these Questions
- CURRENT ELECTRICITYBOOK - MODERN PUBLICATIONCHAPTER - CURRENT ELECTRICITYEXERCISE - MULTIPLE CHOICE QUESTIONS (PARAGRAPH QUESTIONS)
2 Videos
- CURRENT ELECTRICITYBOOK - MODERN PUBLICATIONCHAPTER - CURRENT ELECTRICITYEXERCISE - MULTIPLE CHOICE QUESTIONS (LEVEL-II)
8 Videos
- CURRENT ELECTRICITYBOOK - MODERN PUBLICATIONCHAPTER - CURRENT ELECTRICITYEXERCISE - RECENT COMPETITIVE QUESTIONS
32 Videos
- ATOMS, MOLECULES AND NUCLEIBOOK - MODERN PUBLICATIONCHAPTER - ATOMS, MOLECULES AND NUCLEIEXERCISE - Recent Competitive Questions
40 Videos
- DESCRIPTION OF MOTION IN ONE DIMENSION BOOK - MODERN PUBLICATIONCHAPTER - DESCRIPTION OF MOTION IN ONE DIMENSION EXERCISE - Revision Test
45 Videos
Similar Questions
Assertion : Current versus potential difference (i-V) graph for a conductor at two different temperatures T1 and T2 is shown in figure. Hence T1>T2.
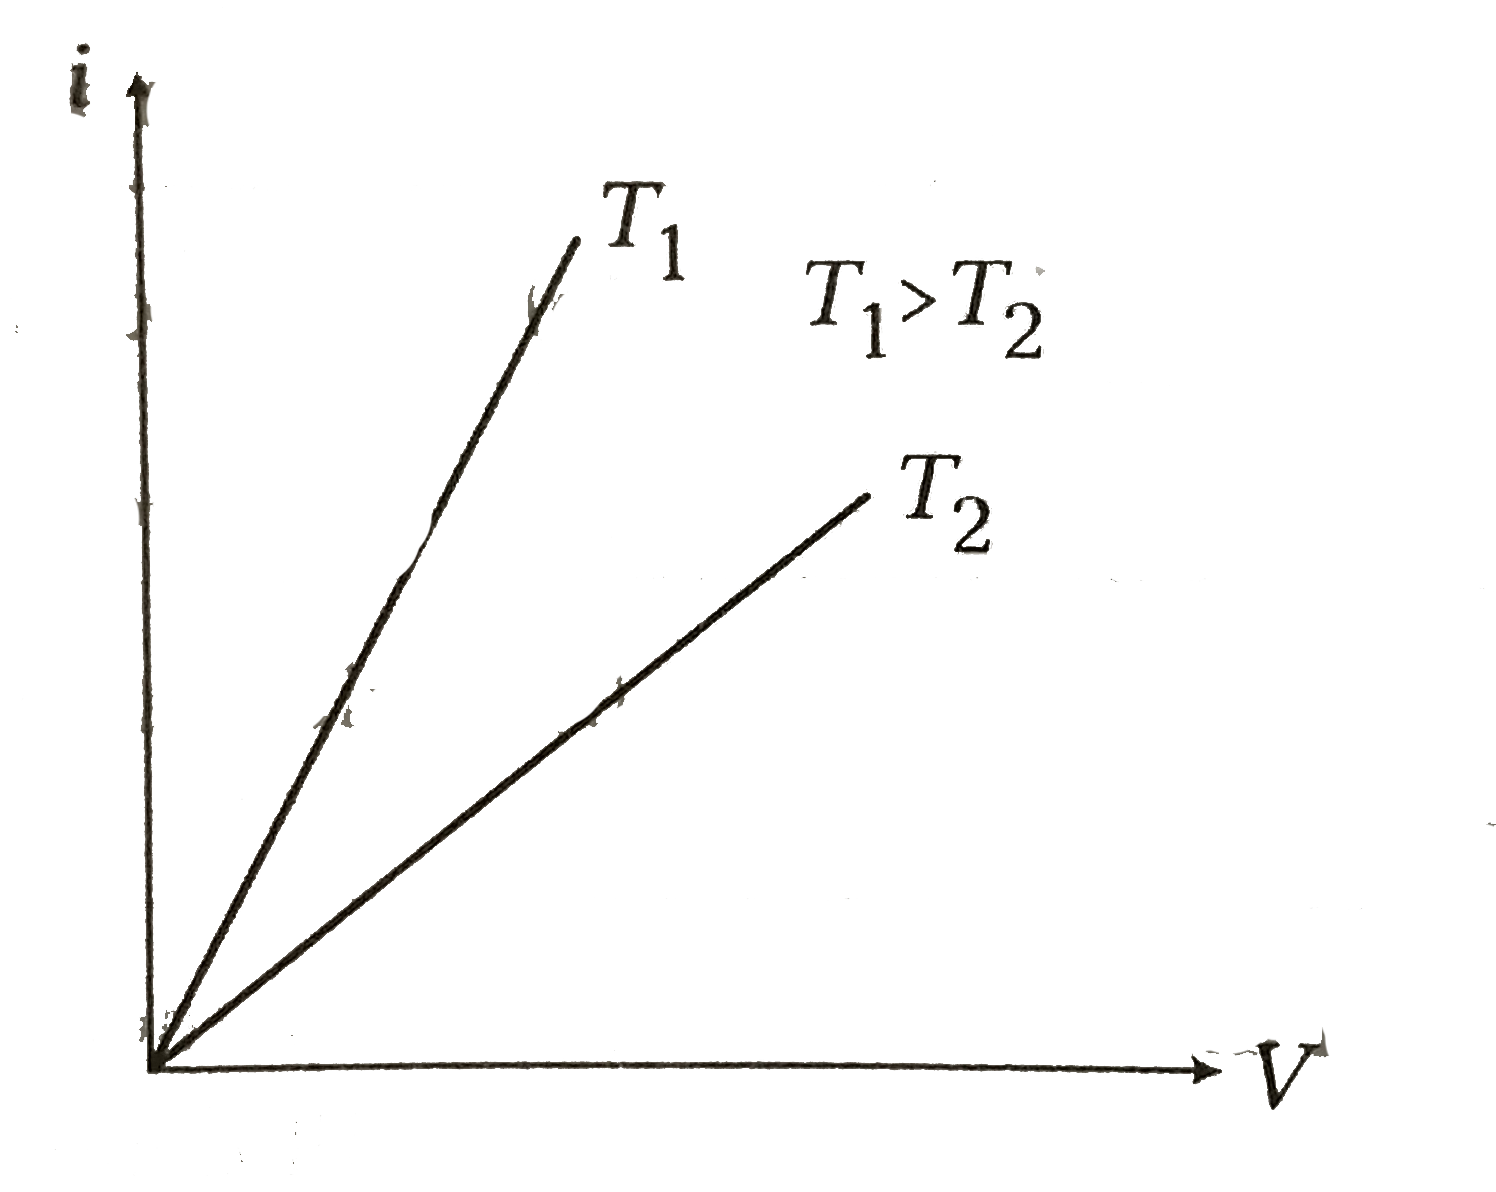
Reason : Resistance of a conductor increases with rise in temperature.
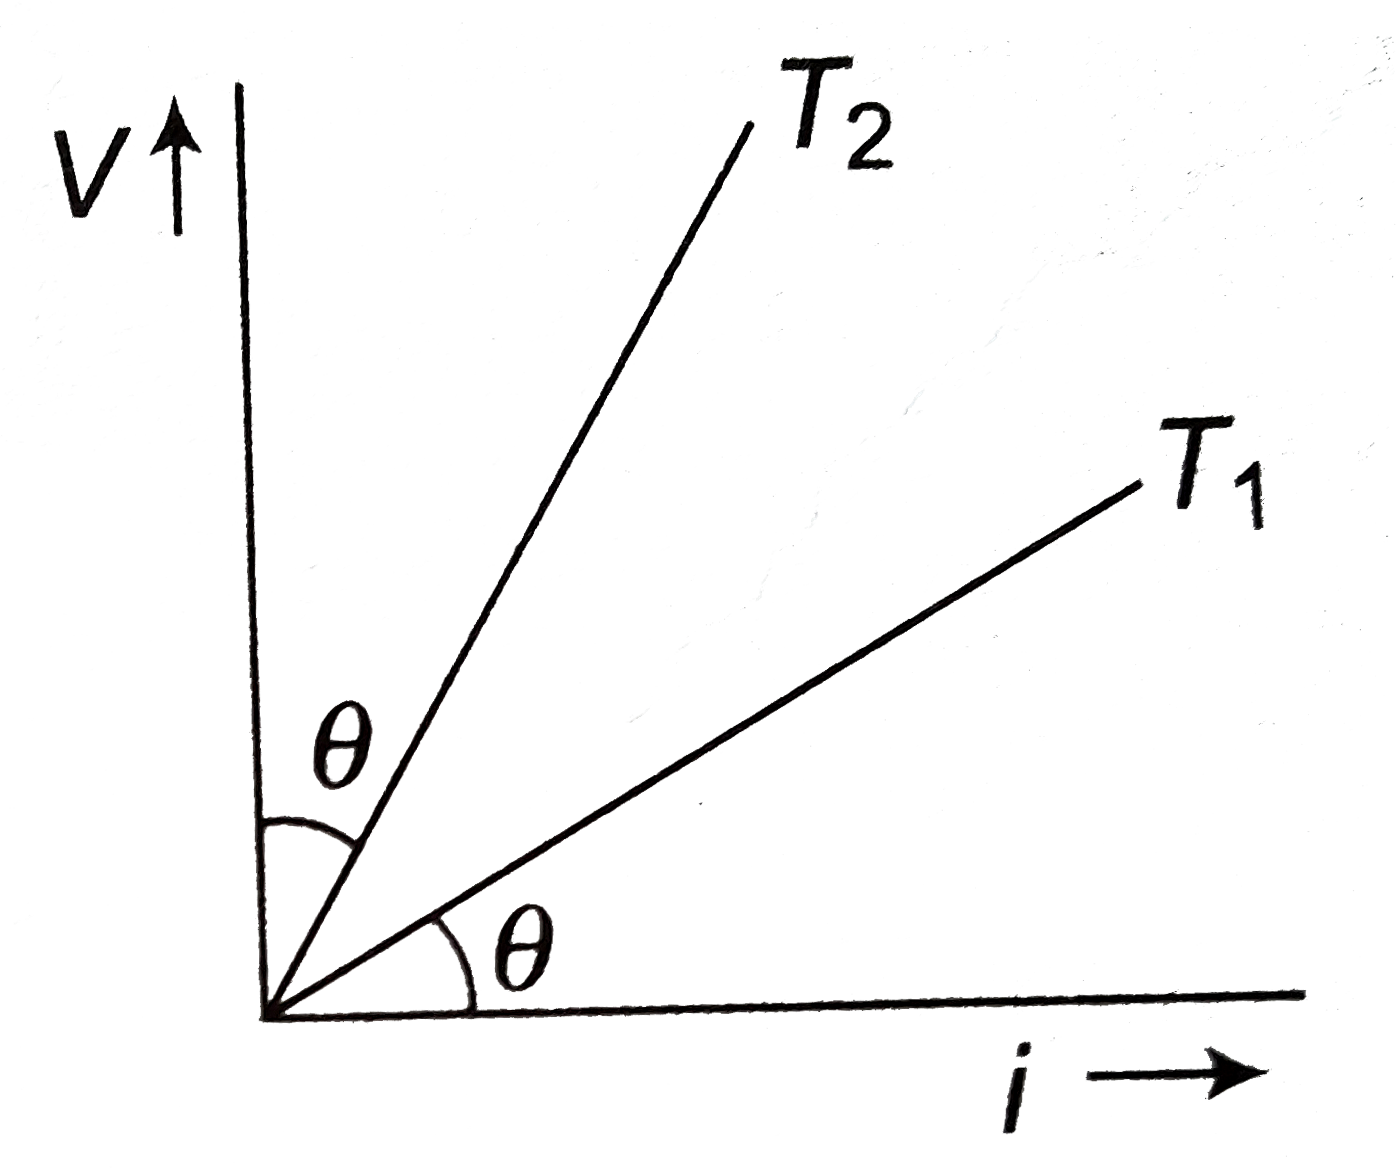
View SolutionThe V−i graph for a conductor at temeratures T1 and T2 are as shown in the figure. (T2−T1) is alphaortional to.
 .
.
View Solution
Knowledge Check
The V - i graph for a conductor at temperature T1 and T2 are as shown in the figure. (T2−T1) is proportional to
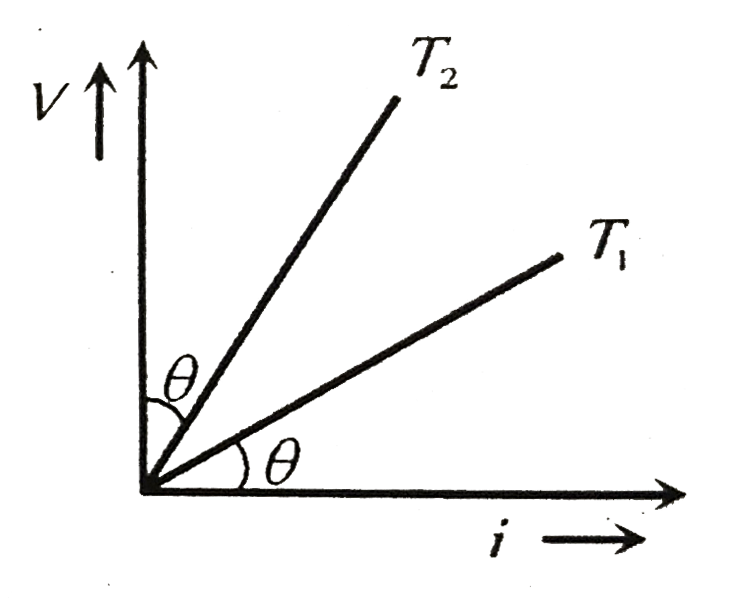 Acot2θBsinθCcot2θDtanθ
Assertion : Current versus potential difference (i-V) graph for a conductor at two different temperatures T1 and T2 is shown in figure. Hence T1>T2.

Reason : Resistance of a conductor increases with rise in temperature.Acos2θBsin2θCcot2θDtan2θThe V-l graph for a conductor at temperatures T1 and T2 are as shown in the figure. The term T2−T1 is proportional to
 Acos2θBsin2θCcot2θDtan2θ
The V - I graphs for a conductor at temperature T1andT2 are shown in the figure (T2−T1) is proportional to
View SolutionThe voltage V and current I graph for a conductor at two different temperatures T1 and T2 are shown in the figure. The relation between T1 and T2 is
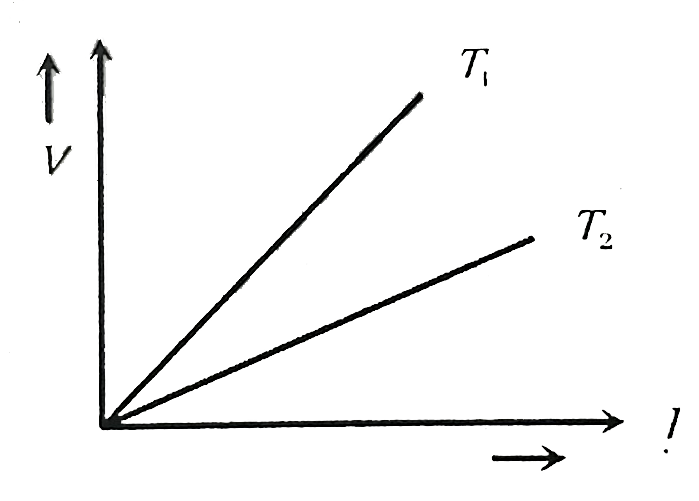
View SolutionThe voltage V and current I v graphs for a conductor at two different temperatures T1andT2 are shown in the figure. The relation between T1andT2 is

View SolutionThe voltage V and current I v graphs for a conductor at two different temperatures T1andT2 are shown in the figure. The relation between T1andT2 is

View SolutionAssertion : Current versus potential difference (i-V) graph for a conductor at two different temperatures T1 and T2 is shown in figure. Hence T1>T2.

Reason : Resistance of a conductor increases with rise in temperature.
View Solution
