Assertion : Current versus potential difference (i-V) graph for a conductor at two different temperatures T1 and T2 is shown in figure. Hence T1>T2.
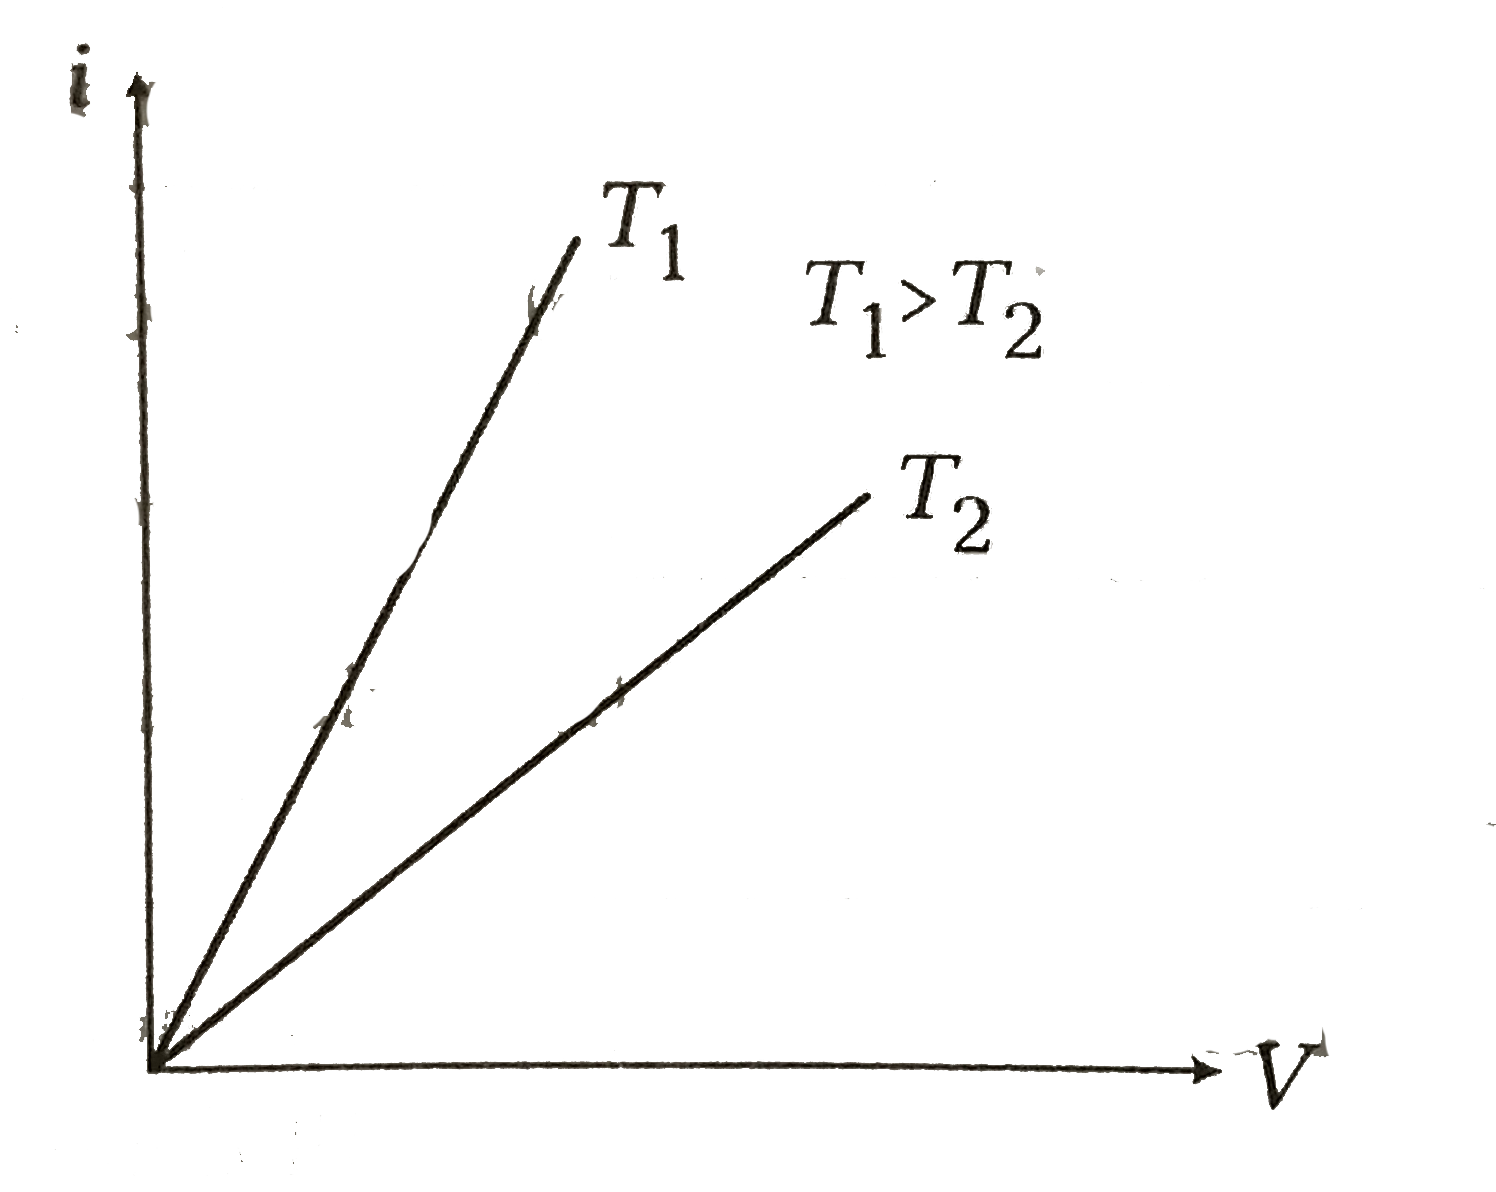
Reason : Resistance of a conductor increases with rise in temperature.
If both Assertion and Reason are true and Reason is the correct explanation of Assertion.
If both Assertion and Reason are true and Reason is not correct explanation of Assertion.
If Assertion is true but Reason is false.
If Assertion is false but Reason is true.
The correct Answer is:D
Step by step video & image solution for Assertion : Current versus potential difference (i-V) graph for a conductor at two different temperatures T_(1) and T_(2) is shown in figure. Hence T_(1)gt T_(2). Reason : Resistance of a conductor increases with rise in temperature. by Physics experts to help you in doubts & scoring excellent marks in Class 12 exams.
Updated on:21/07/2023Topper's Solved these Questions
- CURRENT ELECTRICITYBOOK - DC PANDEY ENGLISHCHAPTER - CURRENT ELECTRICITYEXERCISE - Match the columns
4 Videos
- CURRENT ELECTRICITYBOOK - DC PANDEY ENGLISHCHAPTER - CURRENT ELECTRICITYEXERCISE - Medical entrances gallery
97 Videos
- CURRENT ELECTRICITYBOOK - DC PANDEY ENGLISHCHAPTER - CURRENT ELECTRICITYEXERCISE - Taking it together
142 Videos
- COMMUNICATION SYSTEMBOOK - DC PANDEY ENGLISHCHAPTER - COMMUNICATION SYSTEMEXERCISE - Subjective
11 Videos
- ELECTROMAGNETIC INDUCTIONBOOK - DC PANDEY ENGLISHCHAPTER - ELECTROMAGNETIC INDUCTIONEXERCISE - Medical entrances gallery
25 Videos
Similar Questions
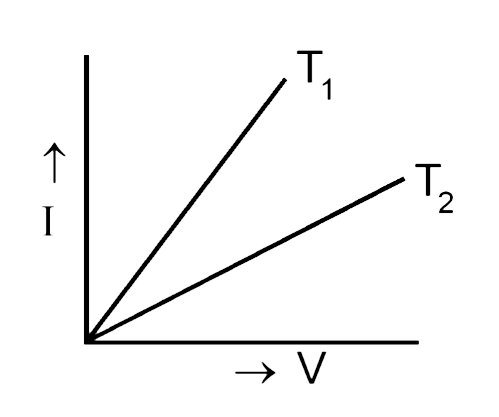
I-V graph for a metallie wire at two different tempearture, T1andT2 is as shown in the figure. Which of the two temperatures is lower and why ?

View SolutionThe current (I) and voltage (V) graphs for a given metallic wire at two different temperature (T1) and (T2) are shown in fig. It is concluded that
View Solution
Knowledge Check
The voltage V and current I v graphs for a conductor at two different temperatures T1andT2 are shown in the figure. The relation between T1andT2 is
 AT1>T2BT1<T2CT1=T2DT1=1T2
Assertion : Current versus potential difference (i-V) graph for a conductor at two different temperatures T1 and T2 is shown in figure. Hence T1>T2.

Reason : Resistance of a conductor increases with rise in temperature.Acos2θBsin2θCcot2θDtan2θThe isothermal diagram of a gas at three different temperatures T1,T2andT3, is show in the given figure .Then
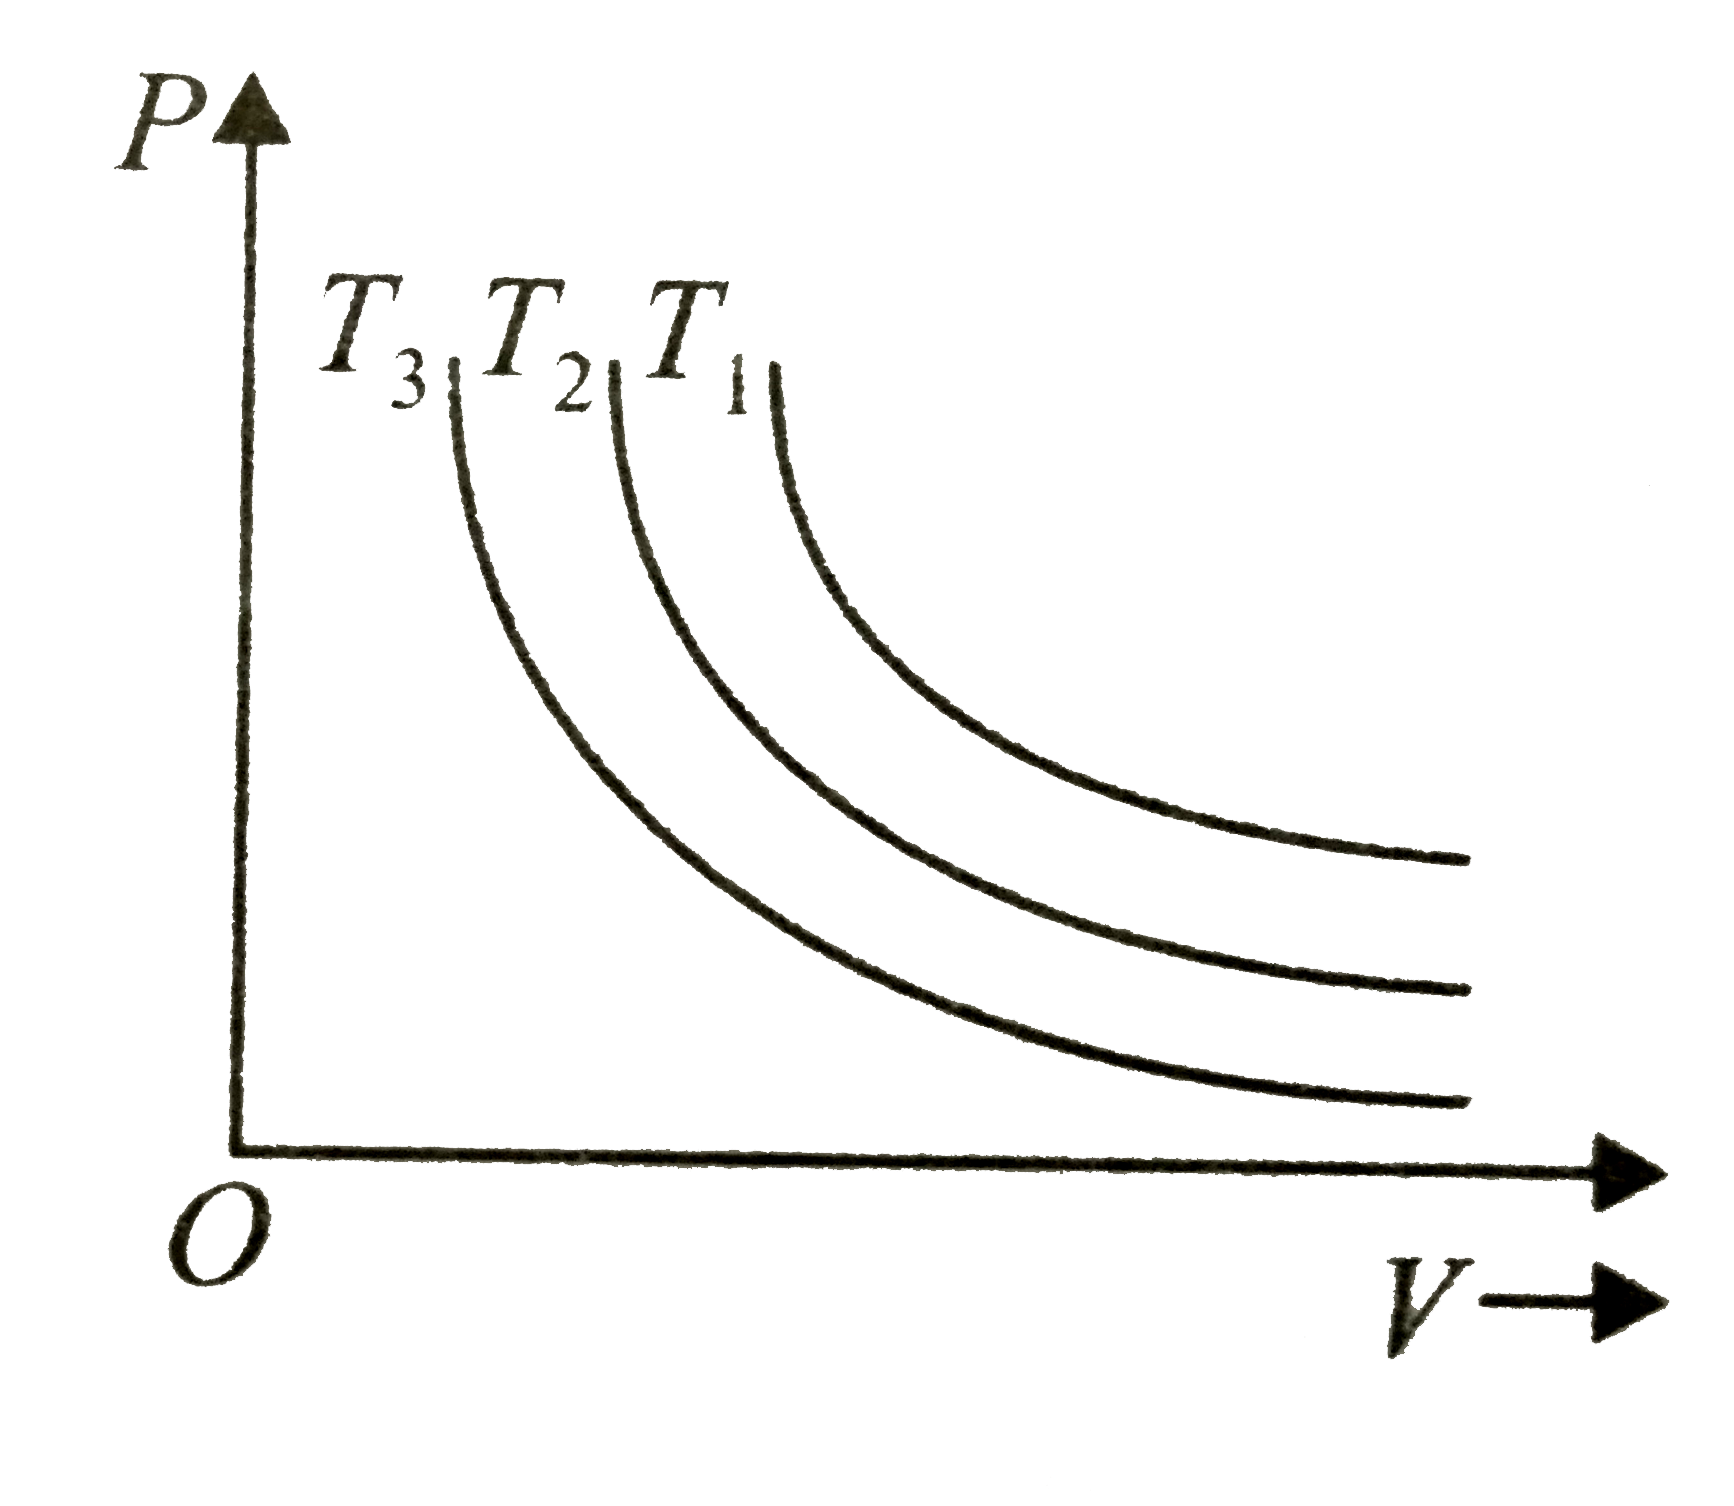 Aa.T1<T2<TBb. T1<T2>T3Cc.T1>T2>T3Dd.T1>T2<T3
The stress-strain graph for a metallic wire is shown at two different temperature, T1 and T2 which temperature is high T1 or T2 ?
View SolutionThe current - voltage graphs for a given metallic wire at two different temperatures T1andT2 are shown in the figure.
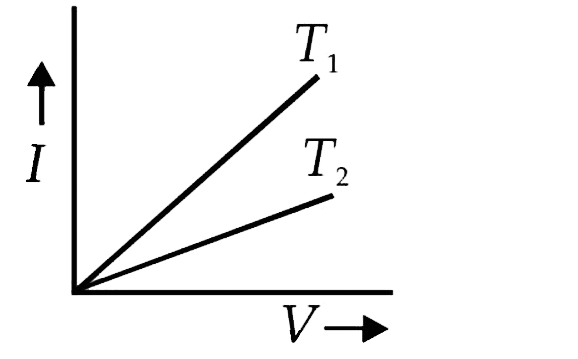
The temperature T2 is greater than T1.
View SolutionThe current - voltage graphs for a given metallic wire at two different temperatures T1andT2 are shown in the figure.

The temperature T2 is greater than T1.
View SolutionDraw a V-I graph for a conductor at two different temperatures. What conclusion do you draw from your graph for the variation of resistance of the conductor with temperature ?
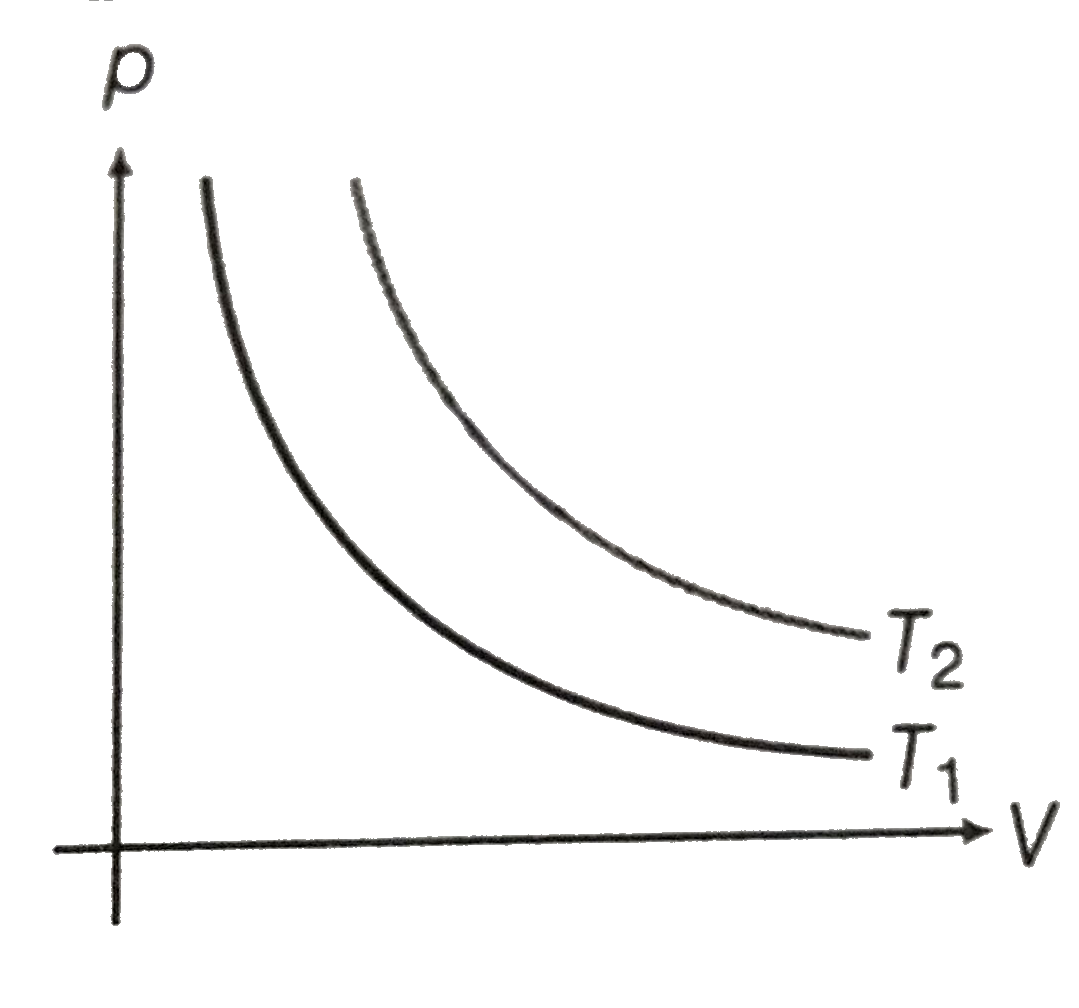
View SolutionThe p−V diagrams of same mass of a gas are drawn at two different temperatues T1 and T2 Explain whether T1>T2 or T2>T1.
View Solution
