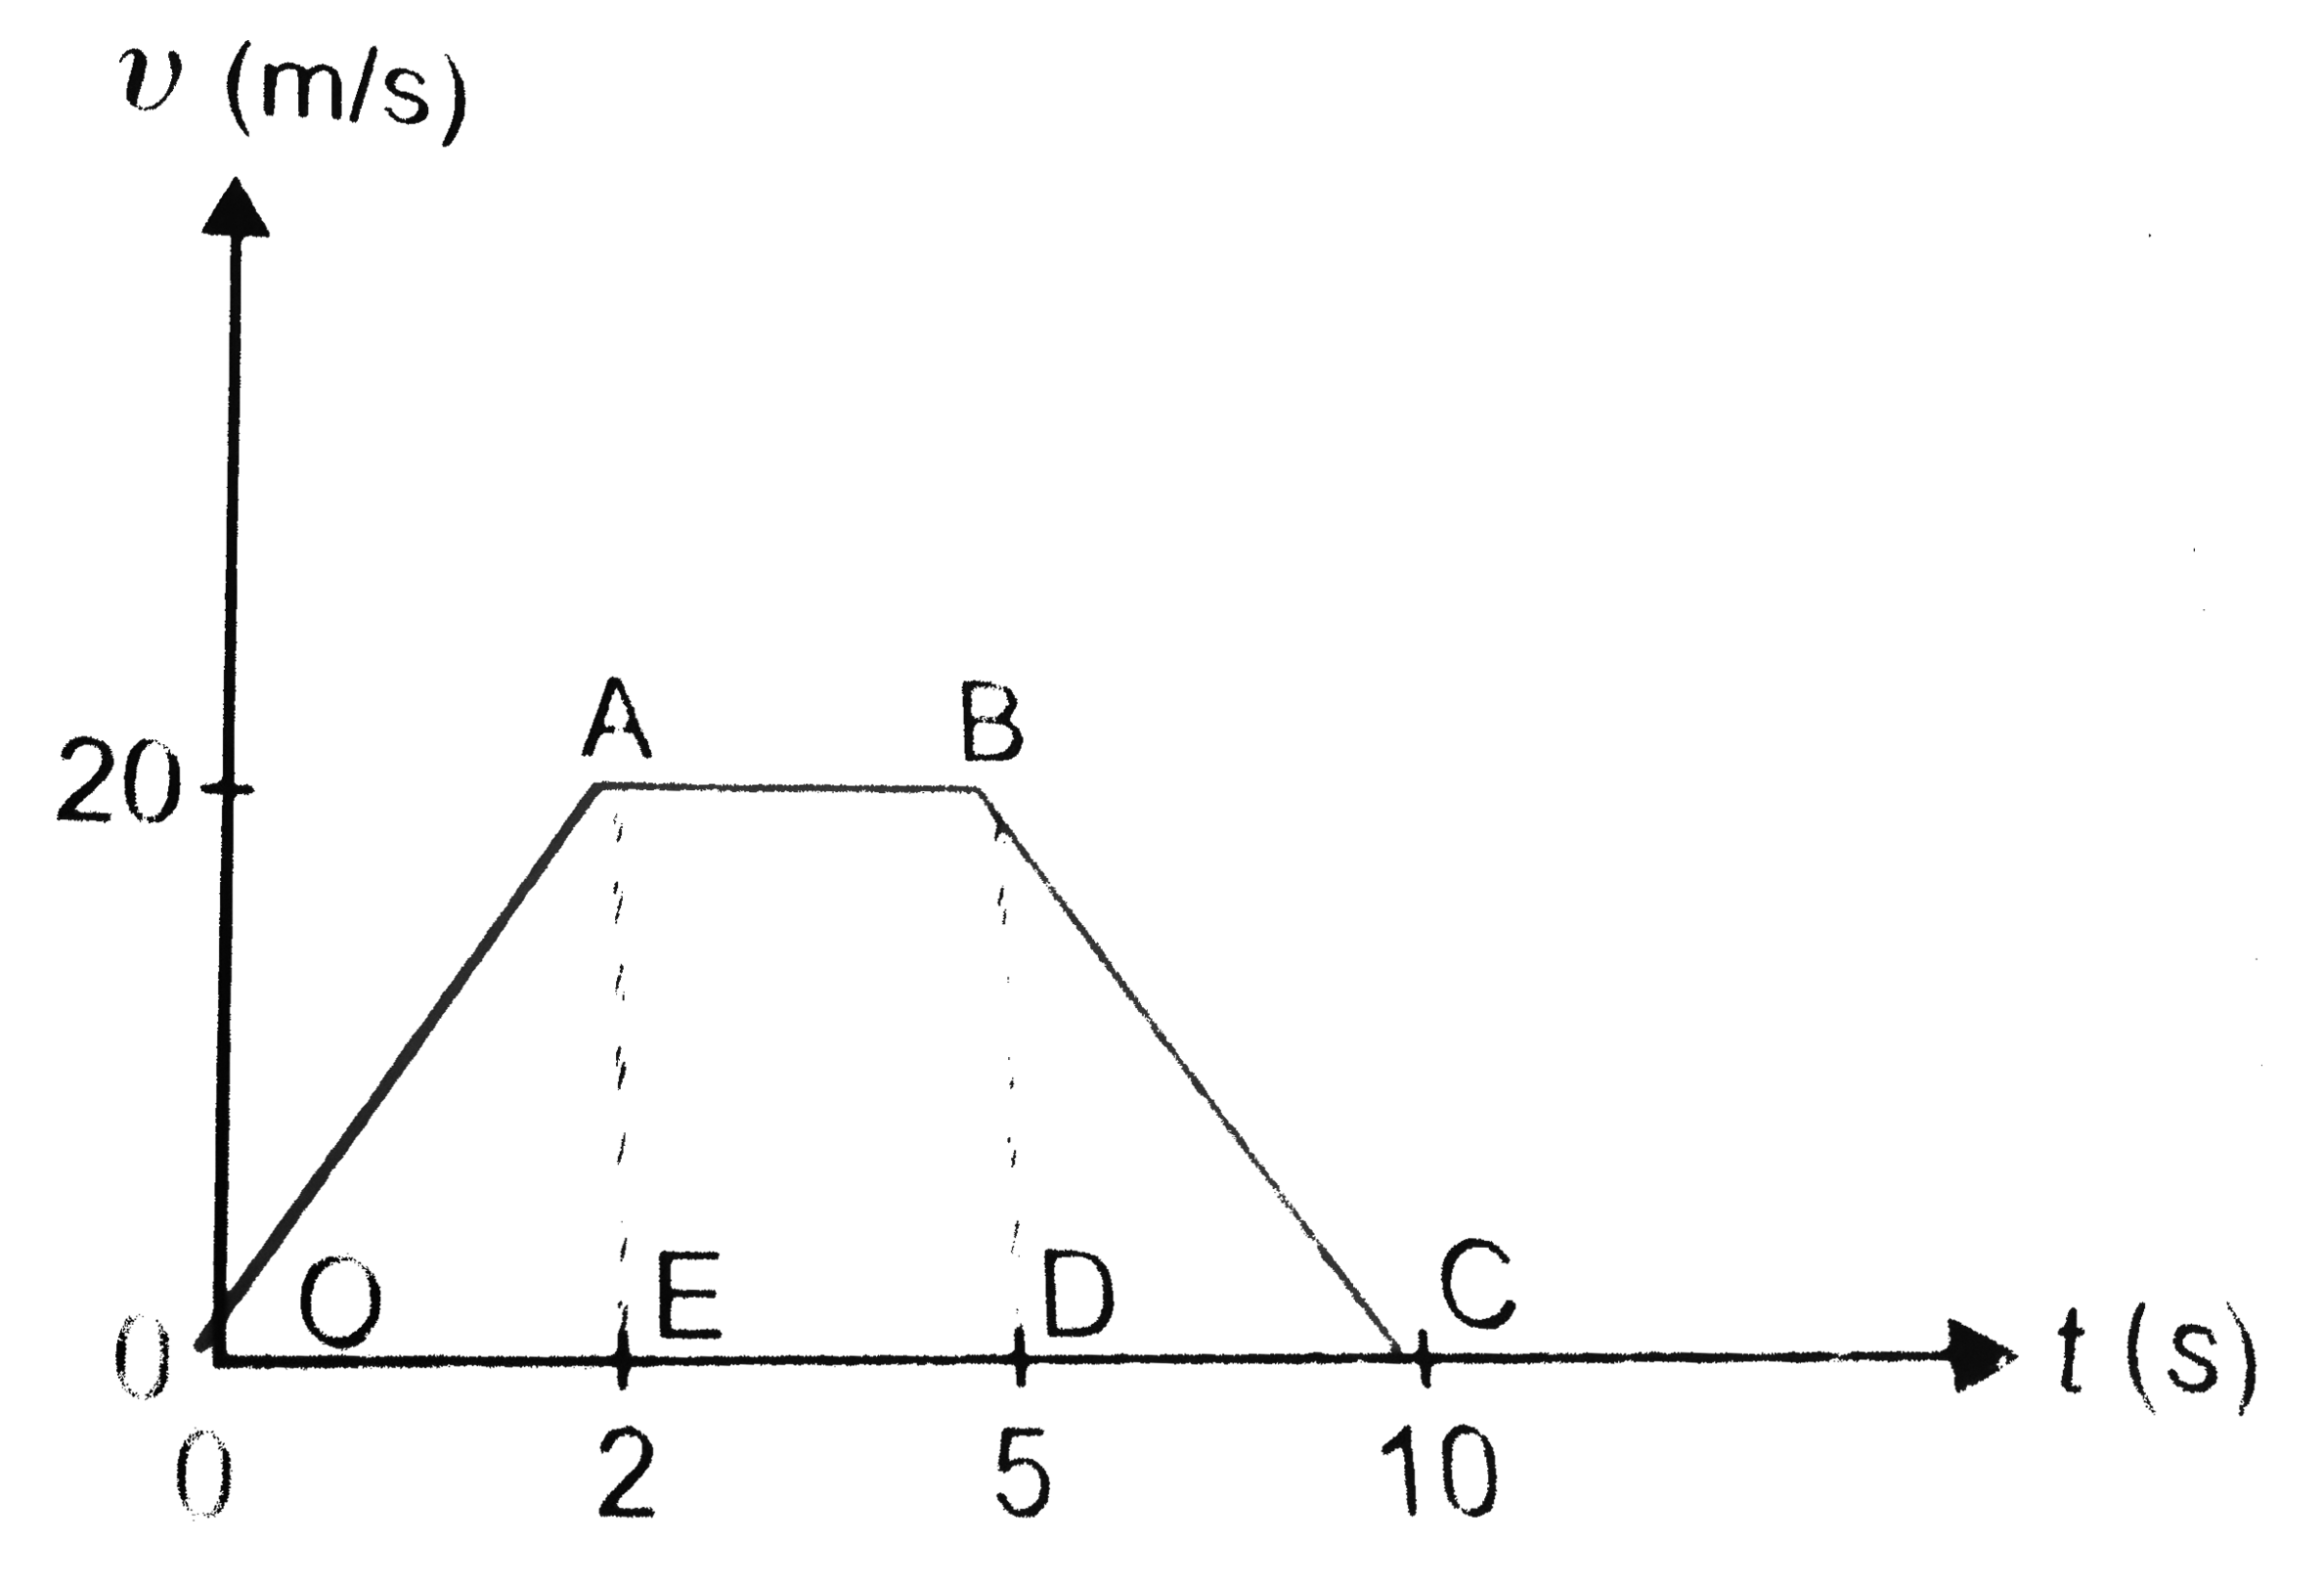
The velocity - time graph of an object moving along a straight line is as shown.
Calculate distance covered by object between t = 0 to t = 3 and t = 3 to t = 6.

t = 0 to t = 3,
velocity at t = 0,u = 0
velocity at t = 3 s, v=30ms−1
So, from velocity v=u+at
Acceleration a=ut=303=10ms−2
So distance convered between 0 to 3 s
s=ut+12at2
initial velocity u =0 and t = 3
s=ut+12at2=0×3+12×10(3)2
=0+12×10×9=12×90
s=45m
From 3 to 6 sec, velocity is same 30ms−1
So distance travelled, =30×3=60m
Total distance covered between 0 to 6 s.
=30+60=90m
(ii) At t = 3s, u=30ms−1, at t = 6 s, v=0ms−1
So from, v=u+at,0=30+a×3
a=−10ms−2
So, distance covered from t = 3 to t = 6 sec is,
v2=u2+2as
(0)2=(30)2−2×10×s
s=90020=45m
So total distance covered =90+45=135m
Topper's Solved these Questions
- BOOK - SURA PUBLICATIONCHAPTER - KINEMATICSEXERCISE - VALUE BASED QUESTIONS7videos
KINEMATICS
- BOOK - SURA PUBLICATIONCHAPTER - KINEMATICSEXERCISE - Creative Question (HOTS)12videos
KINEMATICS
- BOOK - SURA PUBLICATIONCHAPTER - KINEMATICSEXERCISE - LONG ANSWER QUESTIONS:9videos
KINEMATICS
- BOOK - SURA PUBLICATIONCHAPTER - HEAT AND THERMODYNAMICSEXERCISE - Value Based Question1videos
HEAT AND THERMODYNAMICS
- BOOK - SURA PUBLICATIONCHAPTER - KINETIC THEORY OF GASES EXERCISE - VALUE BASED QUESTIONS4videos
KINETIC THEORY OF GASES
Similar Questions
The velocity (u)-time (t) graph of an object moving along a straight line is as shown is Fig. 2 (b) . 30. Calculate the distance covered by object between (i)t=0→t=5s (ii) t=0→t=10s.
 .View Solution
The velocity (u)-time (t) graph of an object moving along a straight line is as shown is Fig. 2 (b) . 30. Calculate the distance covered by object between (i)t=0→t=5s (ii) t=0→t=10s.
 .View Solution
Knowledge Check
- Question 1 - Select One
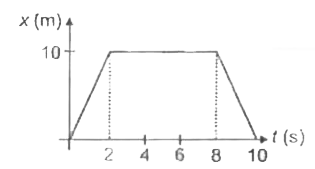
The position - time graph for a particle moving along a straight line is shown in figure. The total distance travelled by it in time t = 0 to t = 10 s is
 AZeroB10 mC20 mD80 m
 - Question 2 - Select One
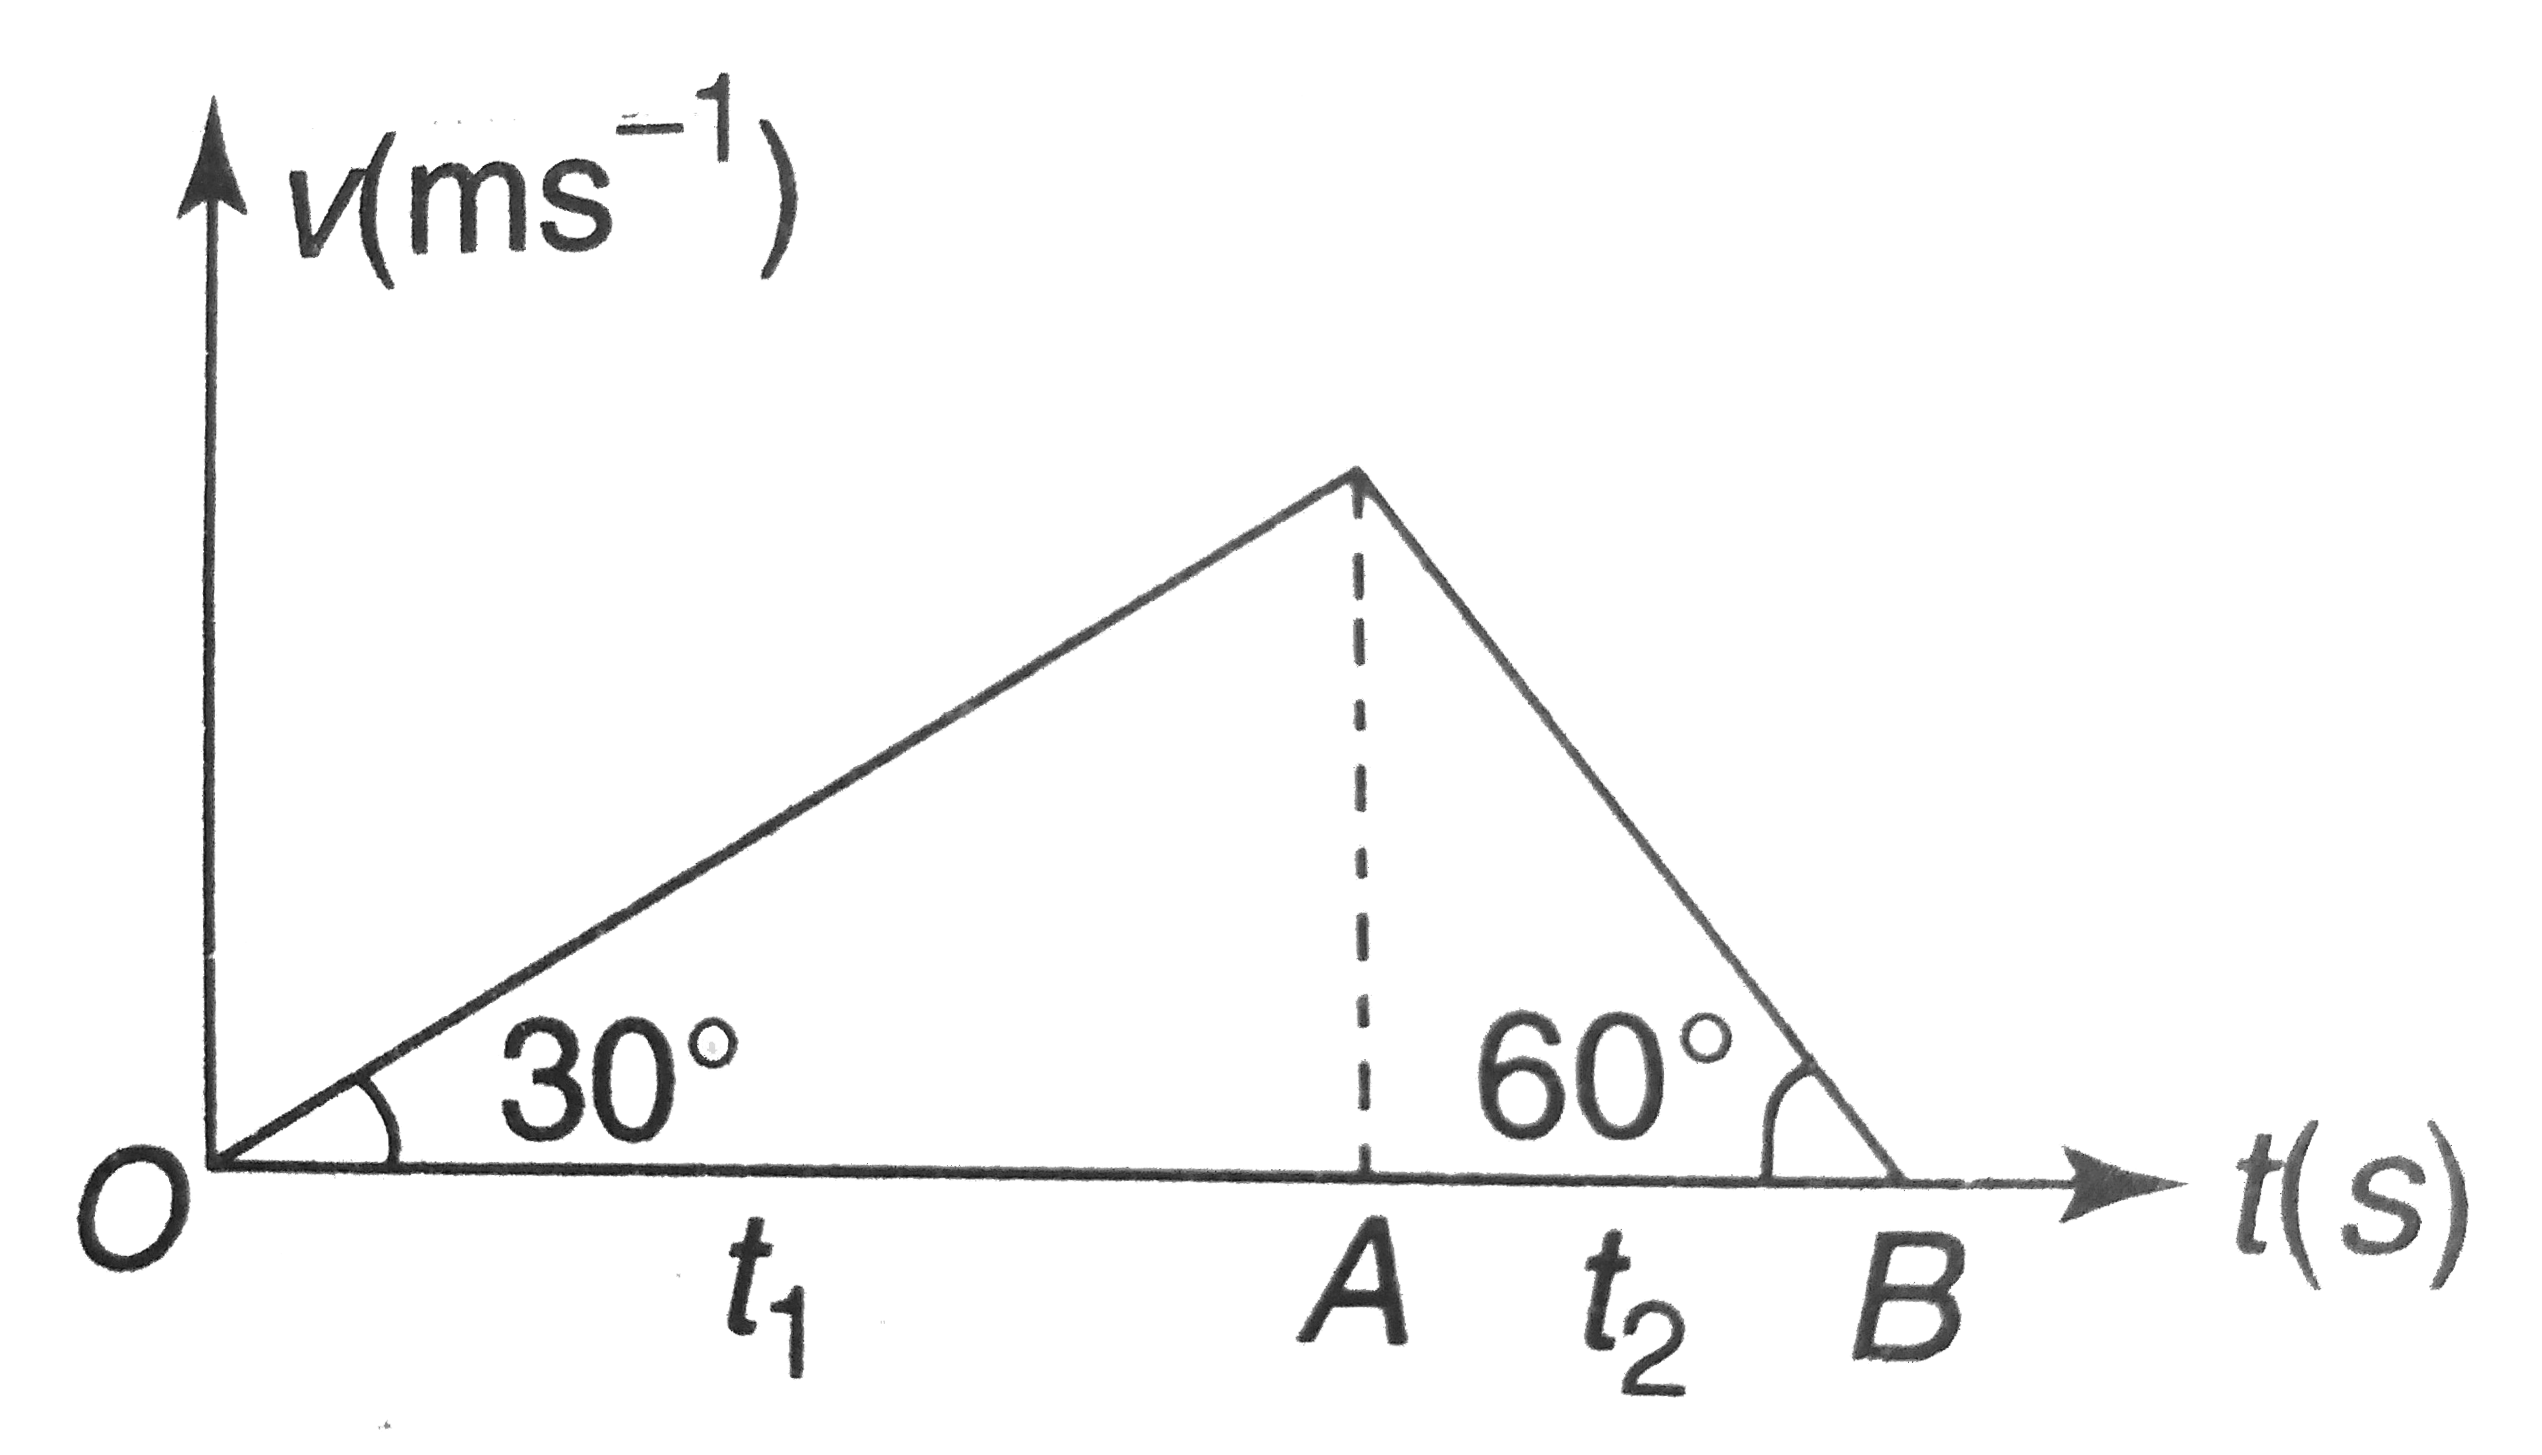
The velocity time graph of a body moving along a straight line is shown in figure. The ratio of the average velocities during the time t1 and t2 is.
 A1:1B2:1C3:1D1:3
The velocity (u)-time (t) graph of an object moving alon a straight line is as shown is Fig. 2 (b) . 30. Calculate the distance covered by object between (i)t=0→t=5s (ii) t=0→t=10s.
 .View Solution
The velocity-time graph of a particle moving along a straight line is shown id Fig. 2 (b) . 33. Calculate the distance covered between t=0 to t=10seconds. Also find displacement tn time 0→10seconds.
 .View Solution
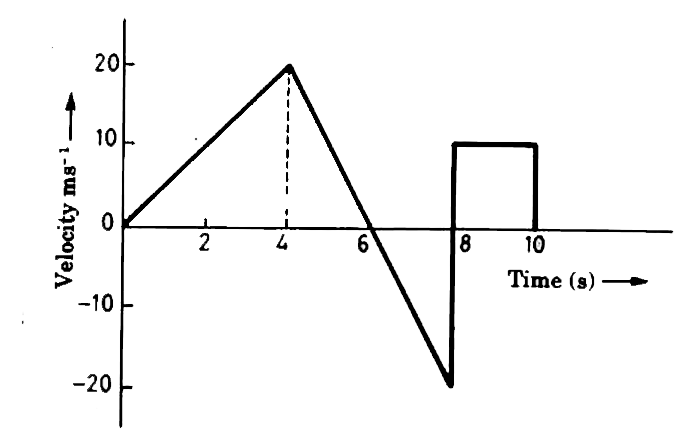
The velocity-time graph of an object moving along a straight line is as shown in Fig. 3.37. Find the net distance covered by the object in time interval between t=0 to t=10s. Also find the displacement in time 0 to 10 s.
 View Solution
The velocity versus time graph of a body moving along a straight path is shown below.
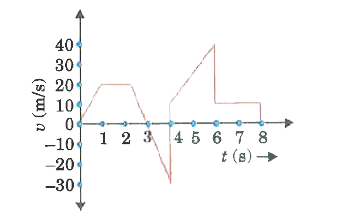
(i) Calculate the distance covered by the body from t=0 to t=8s.
(ii) find its net displacement from t=0 to 8 s.View SolutionThe position - time graph for a particle moving along a straight line is shown in figure. The total distance travelled by it in time t = 0 to t = 10 s is
 View Solution
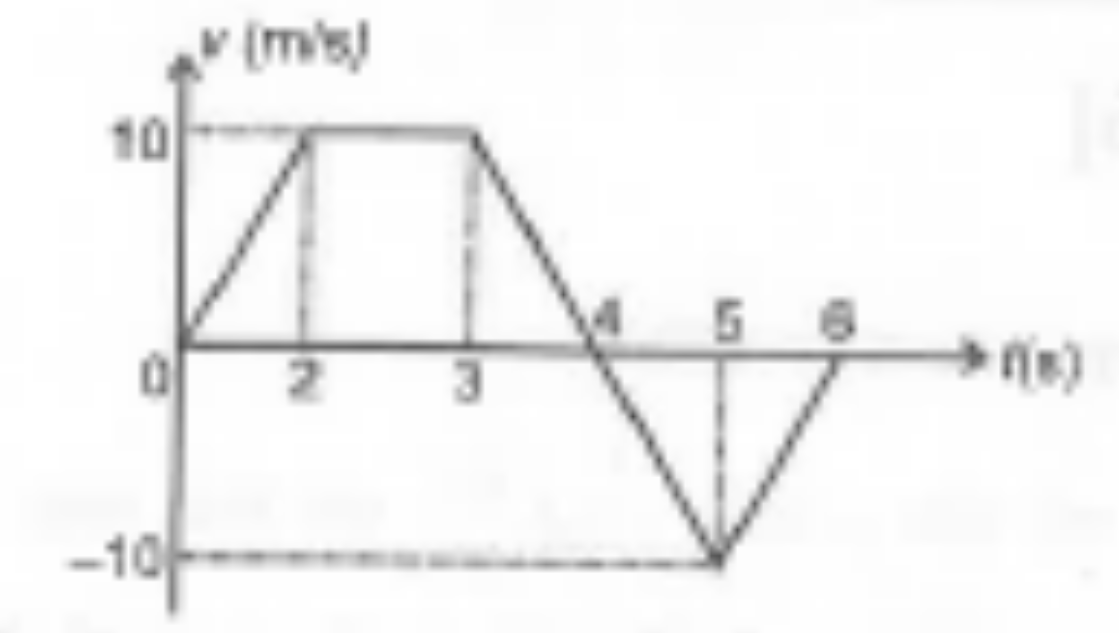
The velocity (v)-time (t) graph of a partide moving along a straight line is as shown in the figure. The displacement of the particle from t = 0 to t = 4 is
 View Solution

