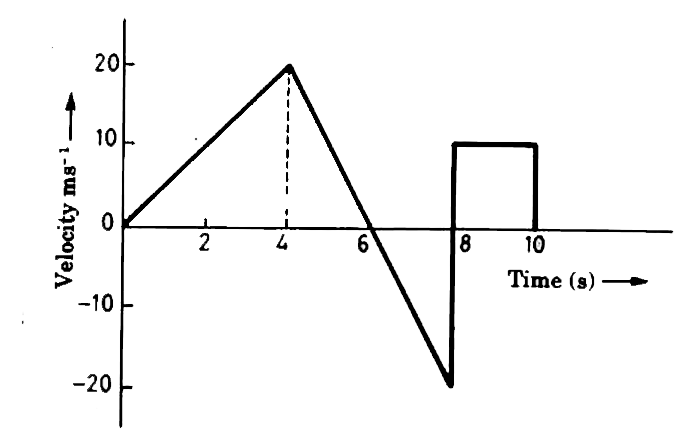
The velocity-time graph of a particle moving along a straight line is shown id Fig. 2 (b) . 33. Calculate the distance covered between t=0 to t=10seconds. Also find displacement tn time 0→10seconds.
 .
.
The area enclosed by velocity-time graph woth tiem asis measures the distance travelled in a give tiem . Displacement covered frp, 0→6sec is positive, from 6 to 8 sec in negative and from 8 to 10sec is positive. Whereas distance coverd is always covered in 10s ltbRgt =12×6×20+1222×20+210=100m ltbRgt Total dispalcement in 10s
=12x6×20−12×2×20+2×10=60m.
Topper's Solved these Questions
- BOOK - PRADEEPCHAPTER - KINEMATICSEXERCISE - 3 Problems for practice67videos
KINEMATICS
- BOOK - PRADEEPCHAPTER - KINEMATICSEXERCISE - 4 Problems for practice45videos
KINEMATICS
- BOOK - PRADEEPCHAPTER - KINEMATICSEXERCISE - 1 Problems for practice25videos
KINEMATICS
- BOOK - PRADEEPCHAPTER - GRAVIATIONEXERCISE - Assertion-Reason Type Questions19videos
GRAVIATION
- BOOK - PRADEEPCHAPTER - LAWS OF MOTIONEXERCISE - Assertion- Reason Type Questions17videos
LAWS OF MOTION
Similar Questions
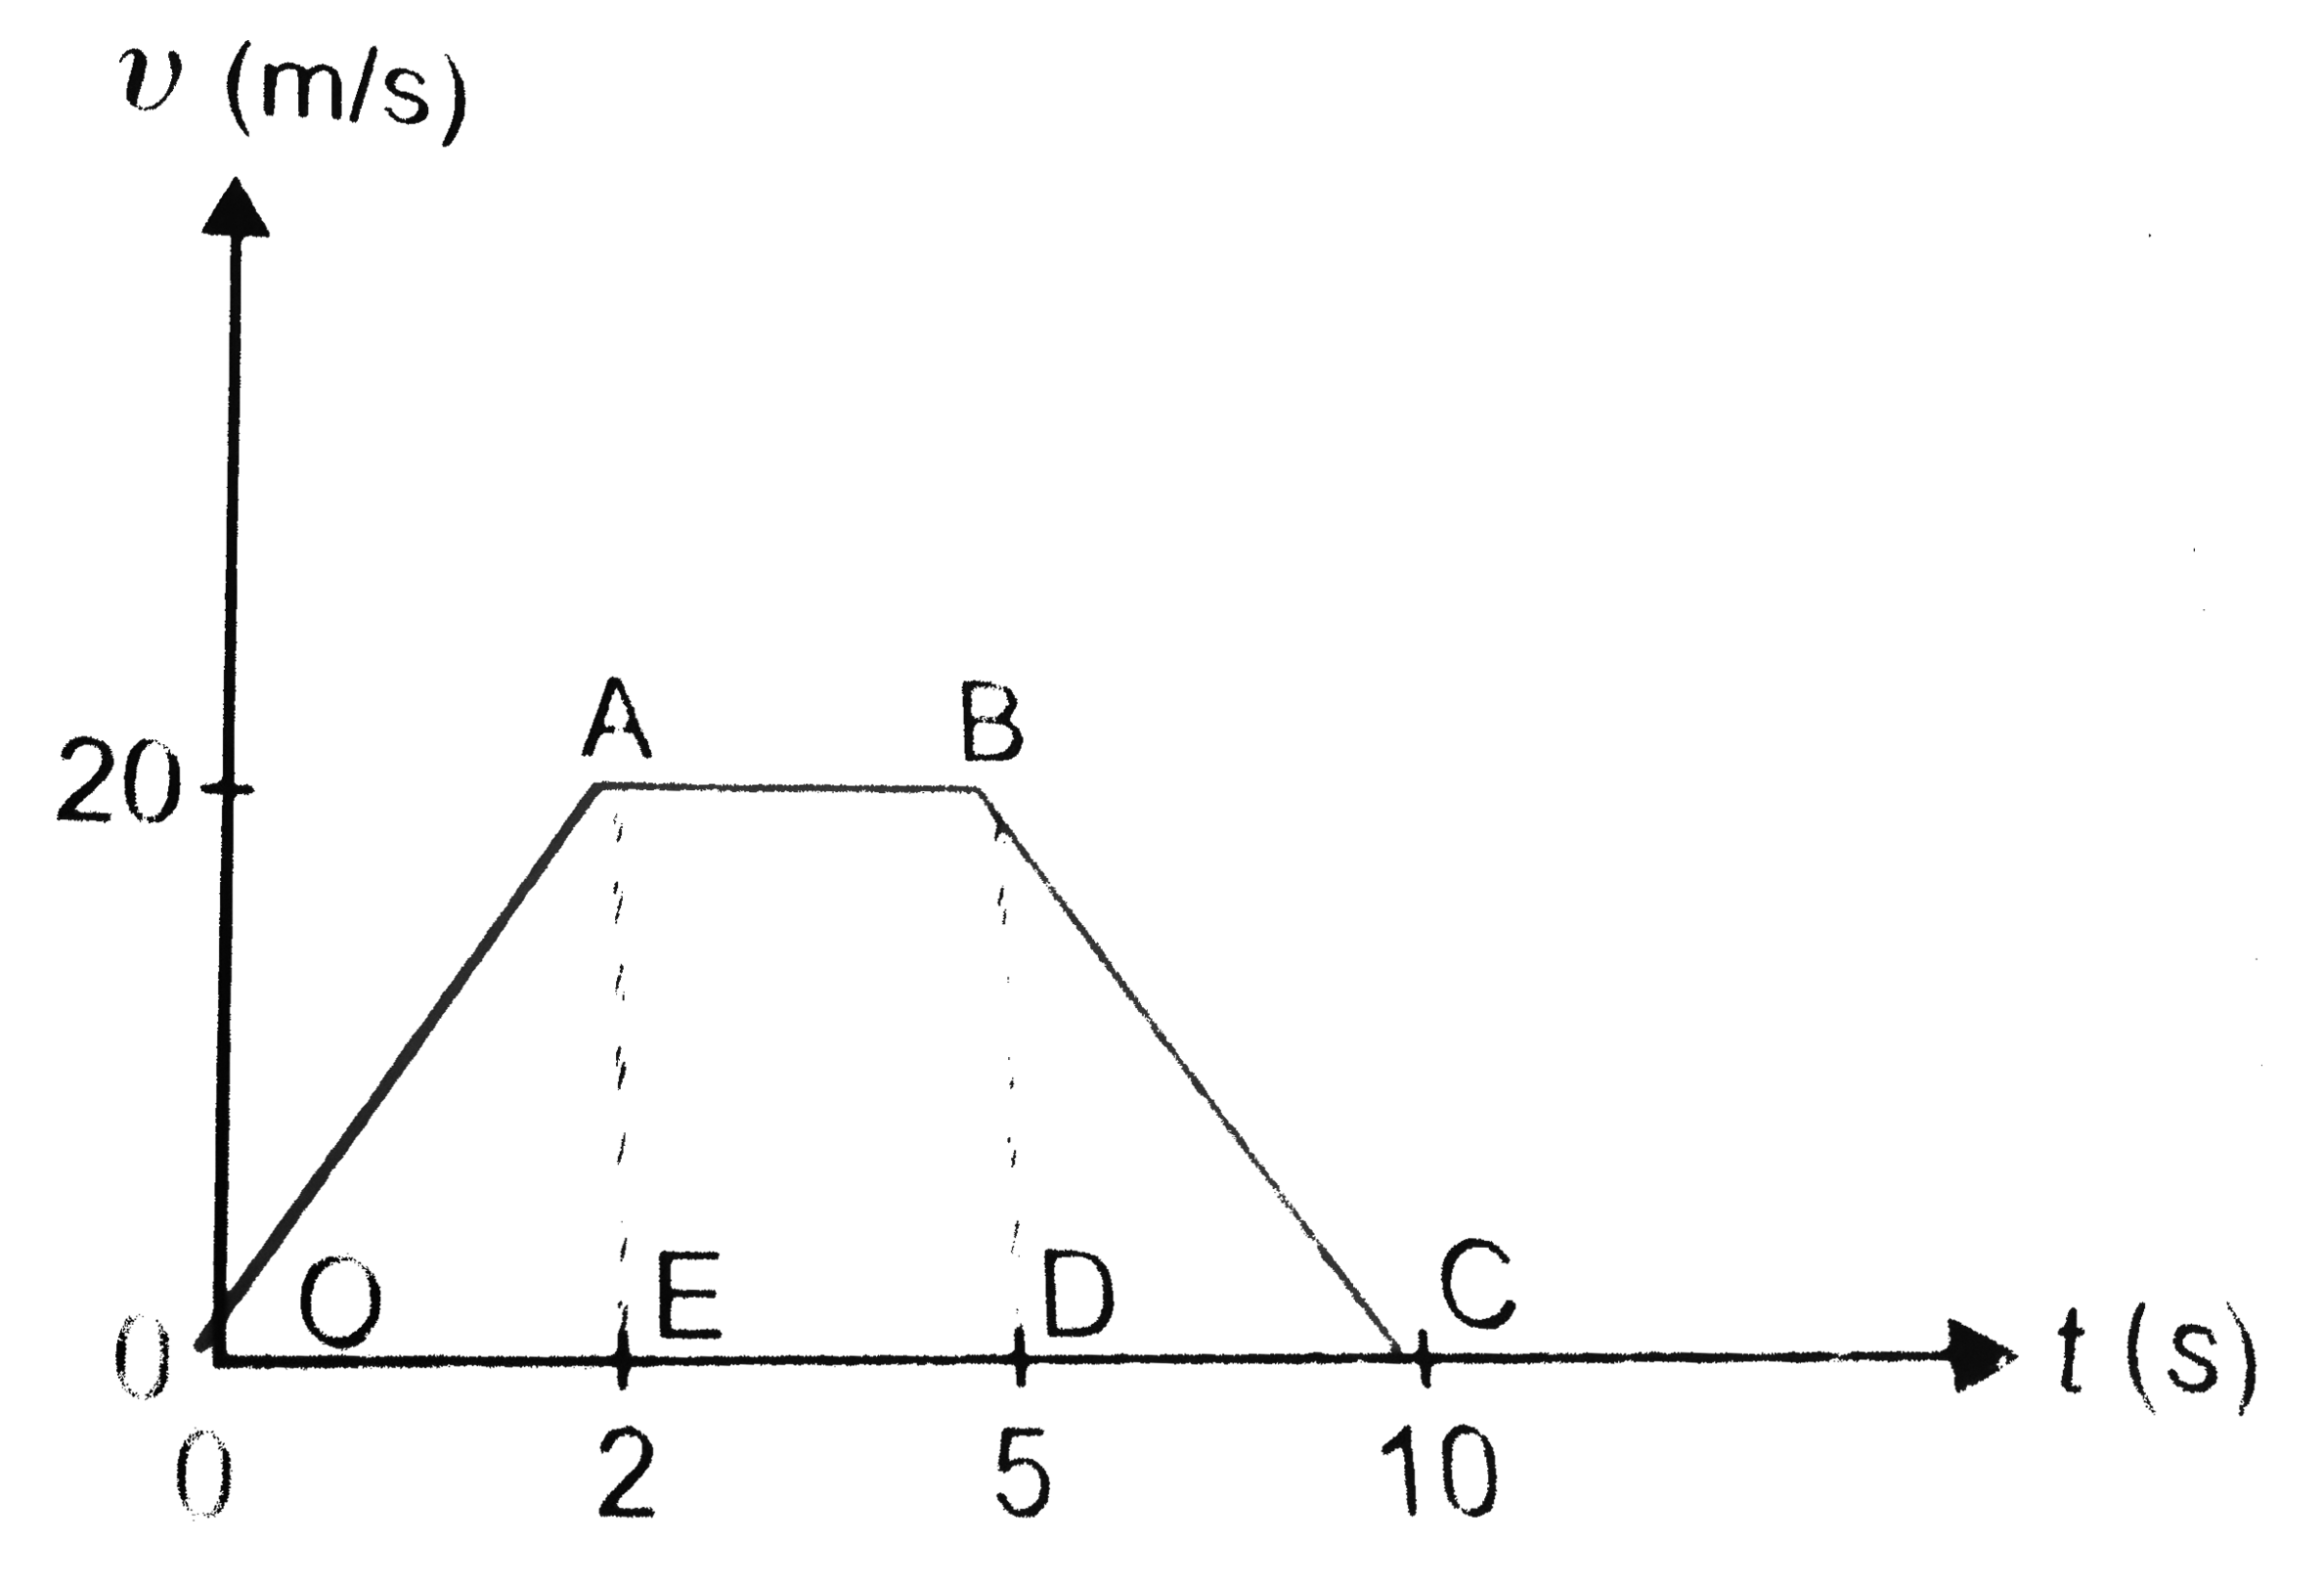
The velocity (u)-time (t) graph of an object moving along a straight line is as shown is Fig. 2 (b) . 30. Calculate the distance covered by object between (i)t=0→t=5s (ii) t=0→t=10s.
 .View Solution
The velocity (u)-time (t) graph of an object moving along a straight line is as shown is Fig. 2 (b) . 30. Calculate the distance covered by object between (i)t=0→t=5s (ii) t=0→t=10s.
 .View Solution
Knowledge Check
- Question 1 - Select One
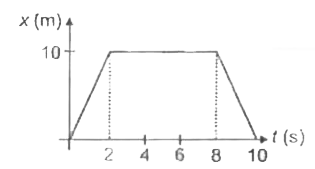
The position - time graph for a particle moving along a straight line is shown in figure. The total distance travelled by it in time t = 0 to t = 10 s is
 AZeroB10 mC20 mD80 m
 - Question 2 - Select One
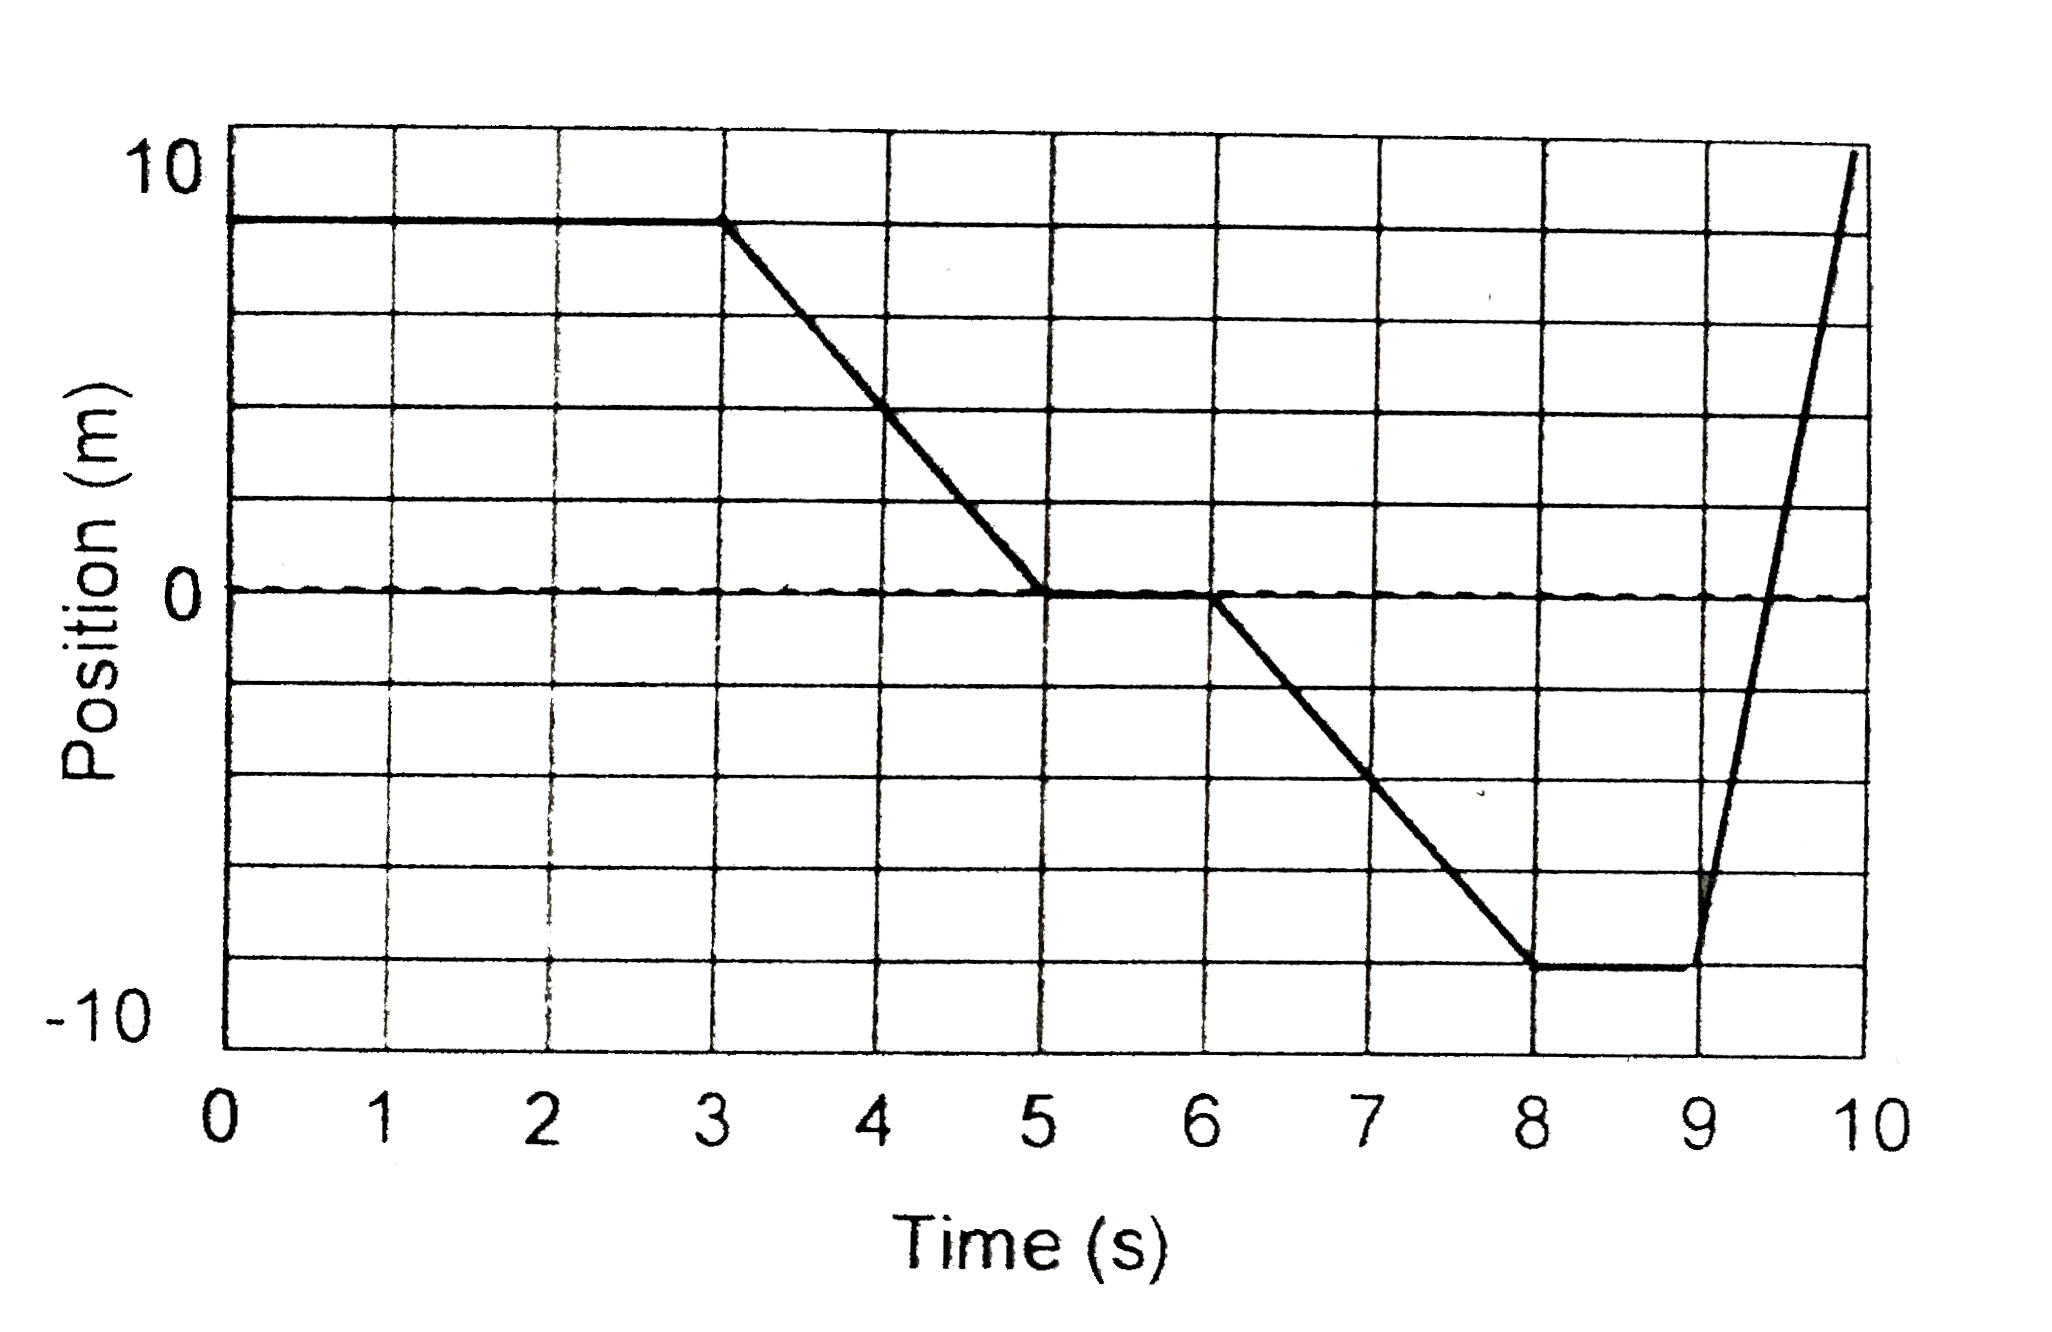
The position versus time graph of a particle moving along a straight line is shown. What is the total distance travelled by the particle from t=0s to t=10s?A2mB18 mC26mD34m
The velocity (u)-time (t) graph of an object moving alon a straight line is as shown is Fig. 2 (b) . 30. Calculate the distance covered by object between (i)t=0→t=5s (ii) t=0→t=10s.
 .View Solution
The velocity-time graph of an object moving along a straight line is as shown in Fig. 3.37. Find the net distance covered by the object in time interval between t=0 to t=10s. Also find the displacement in time 0 to 10 s.
 View Solution
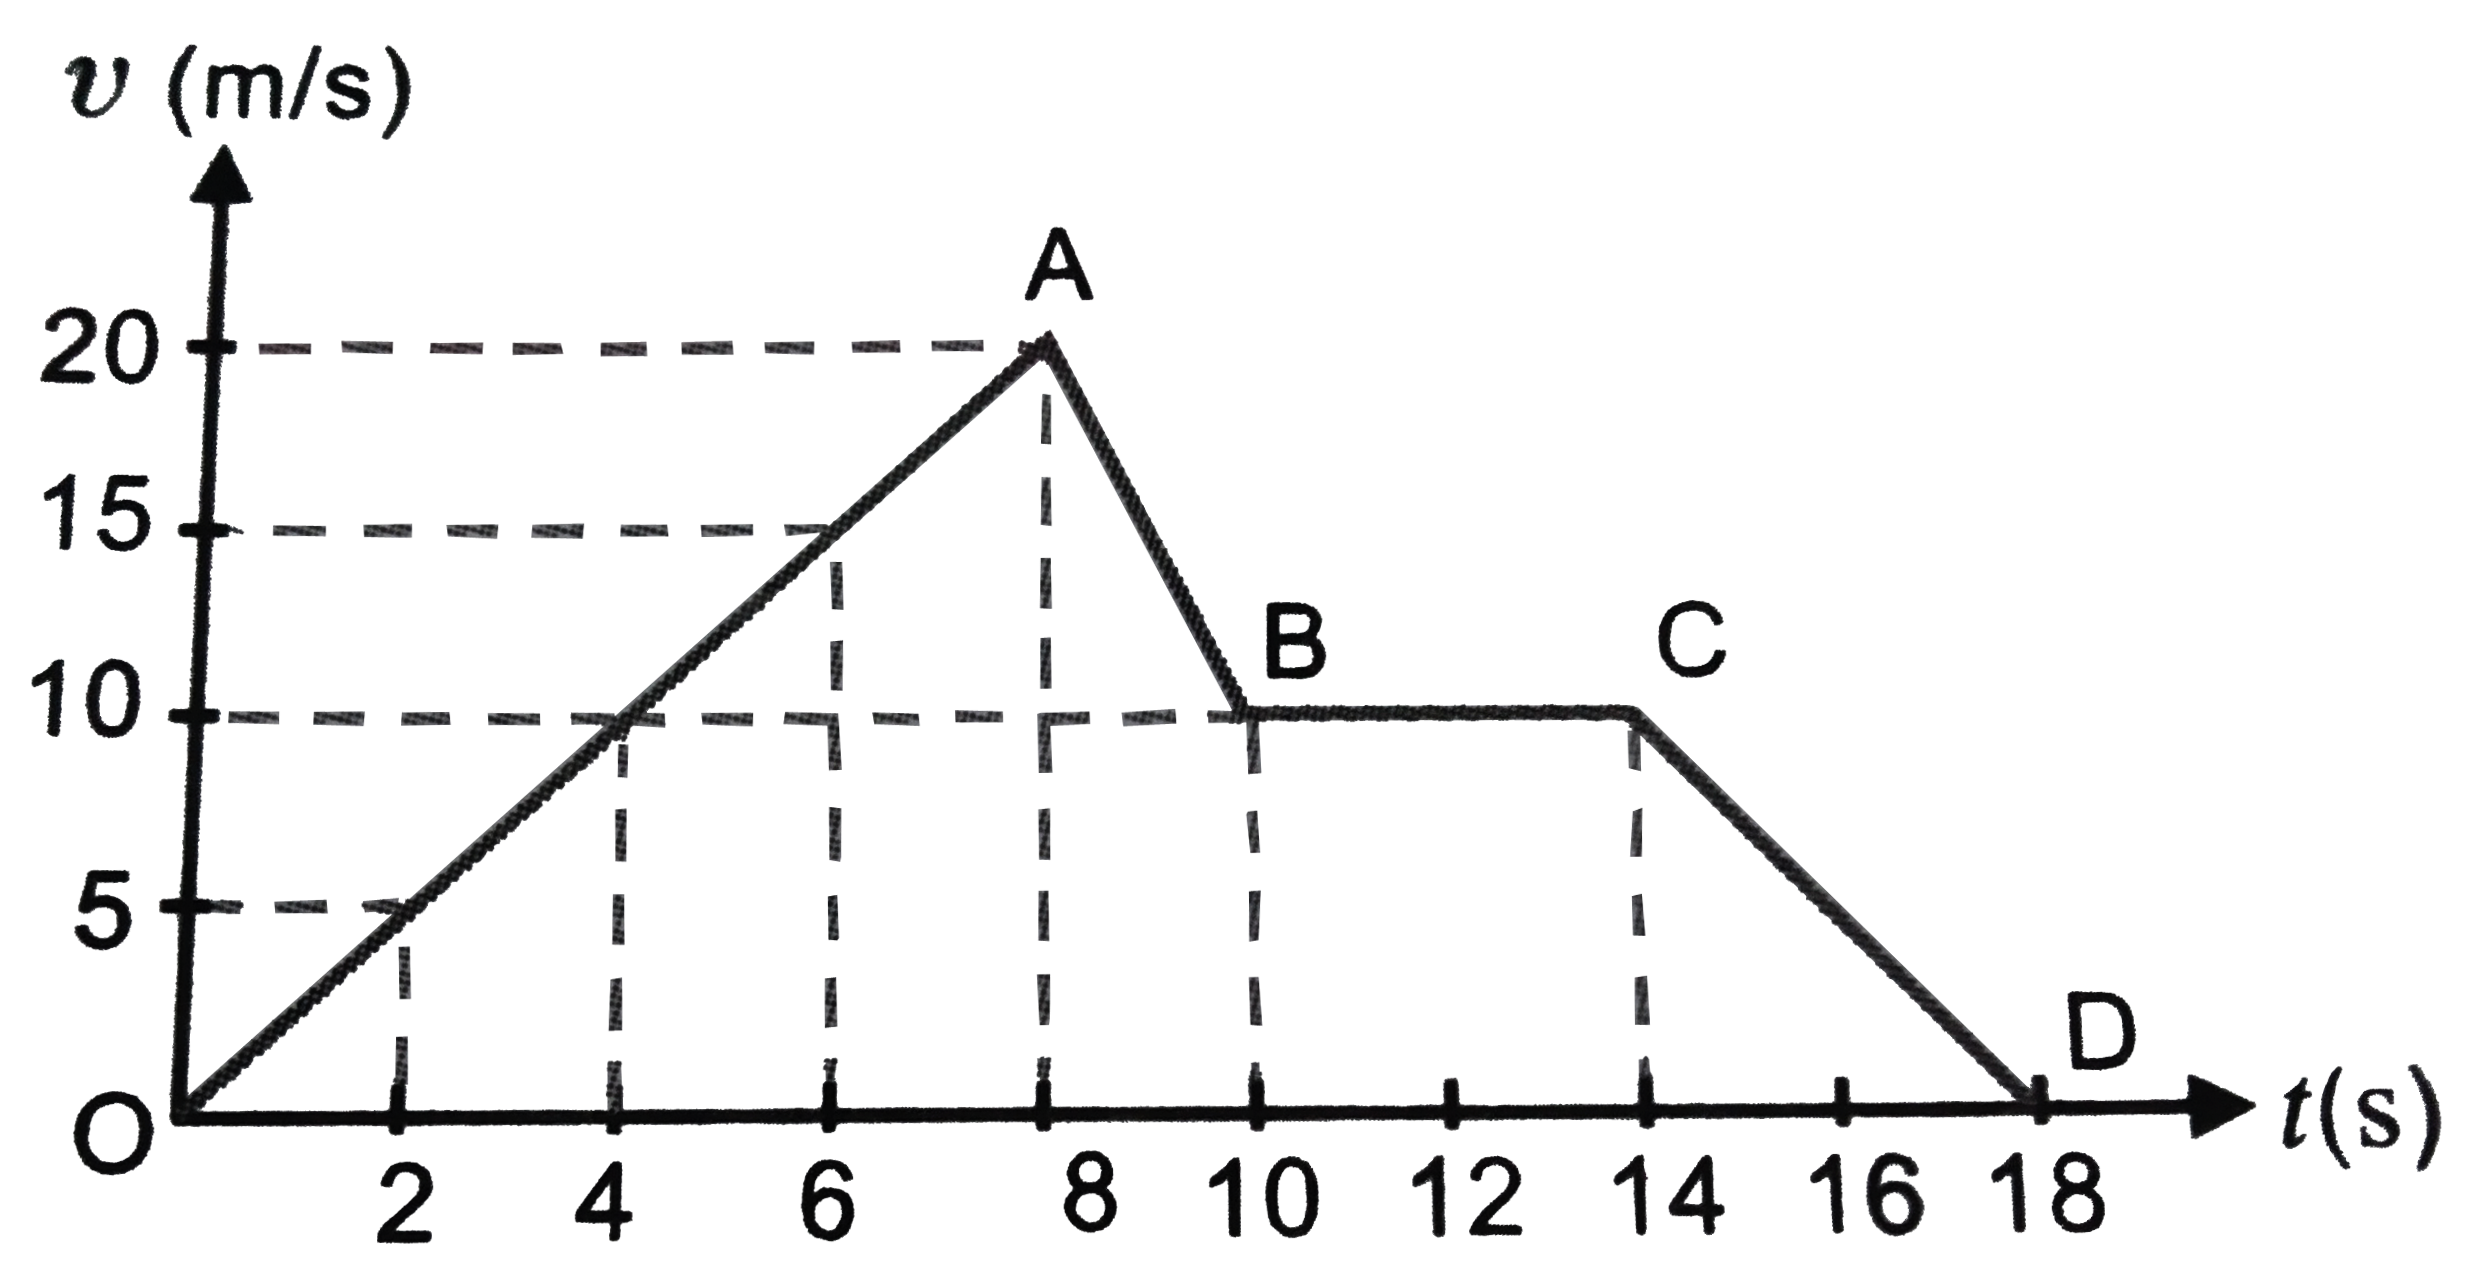
The velocity-tiem graph of a particle movitgn along a straight line is shown in the Fig. 2 ( b) . 34becurve OABCD.Calca––tethedistancecoveredbythepartic≤between(i) t =zero to t=18seconds(ii)t=2s→t=12s. And the maximum value of acceleration during this interval.
 .View Solution
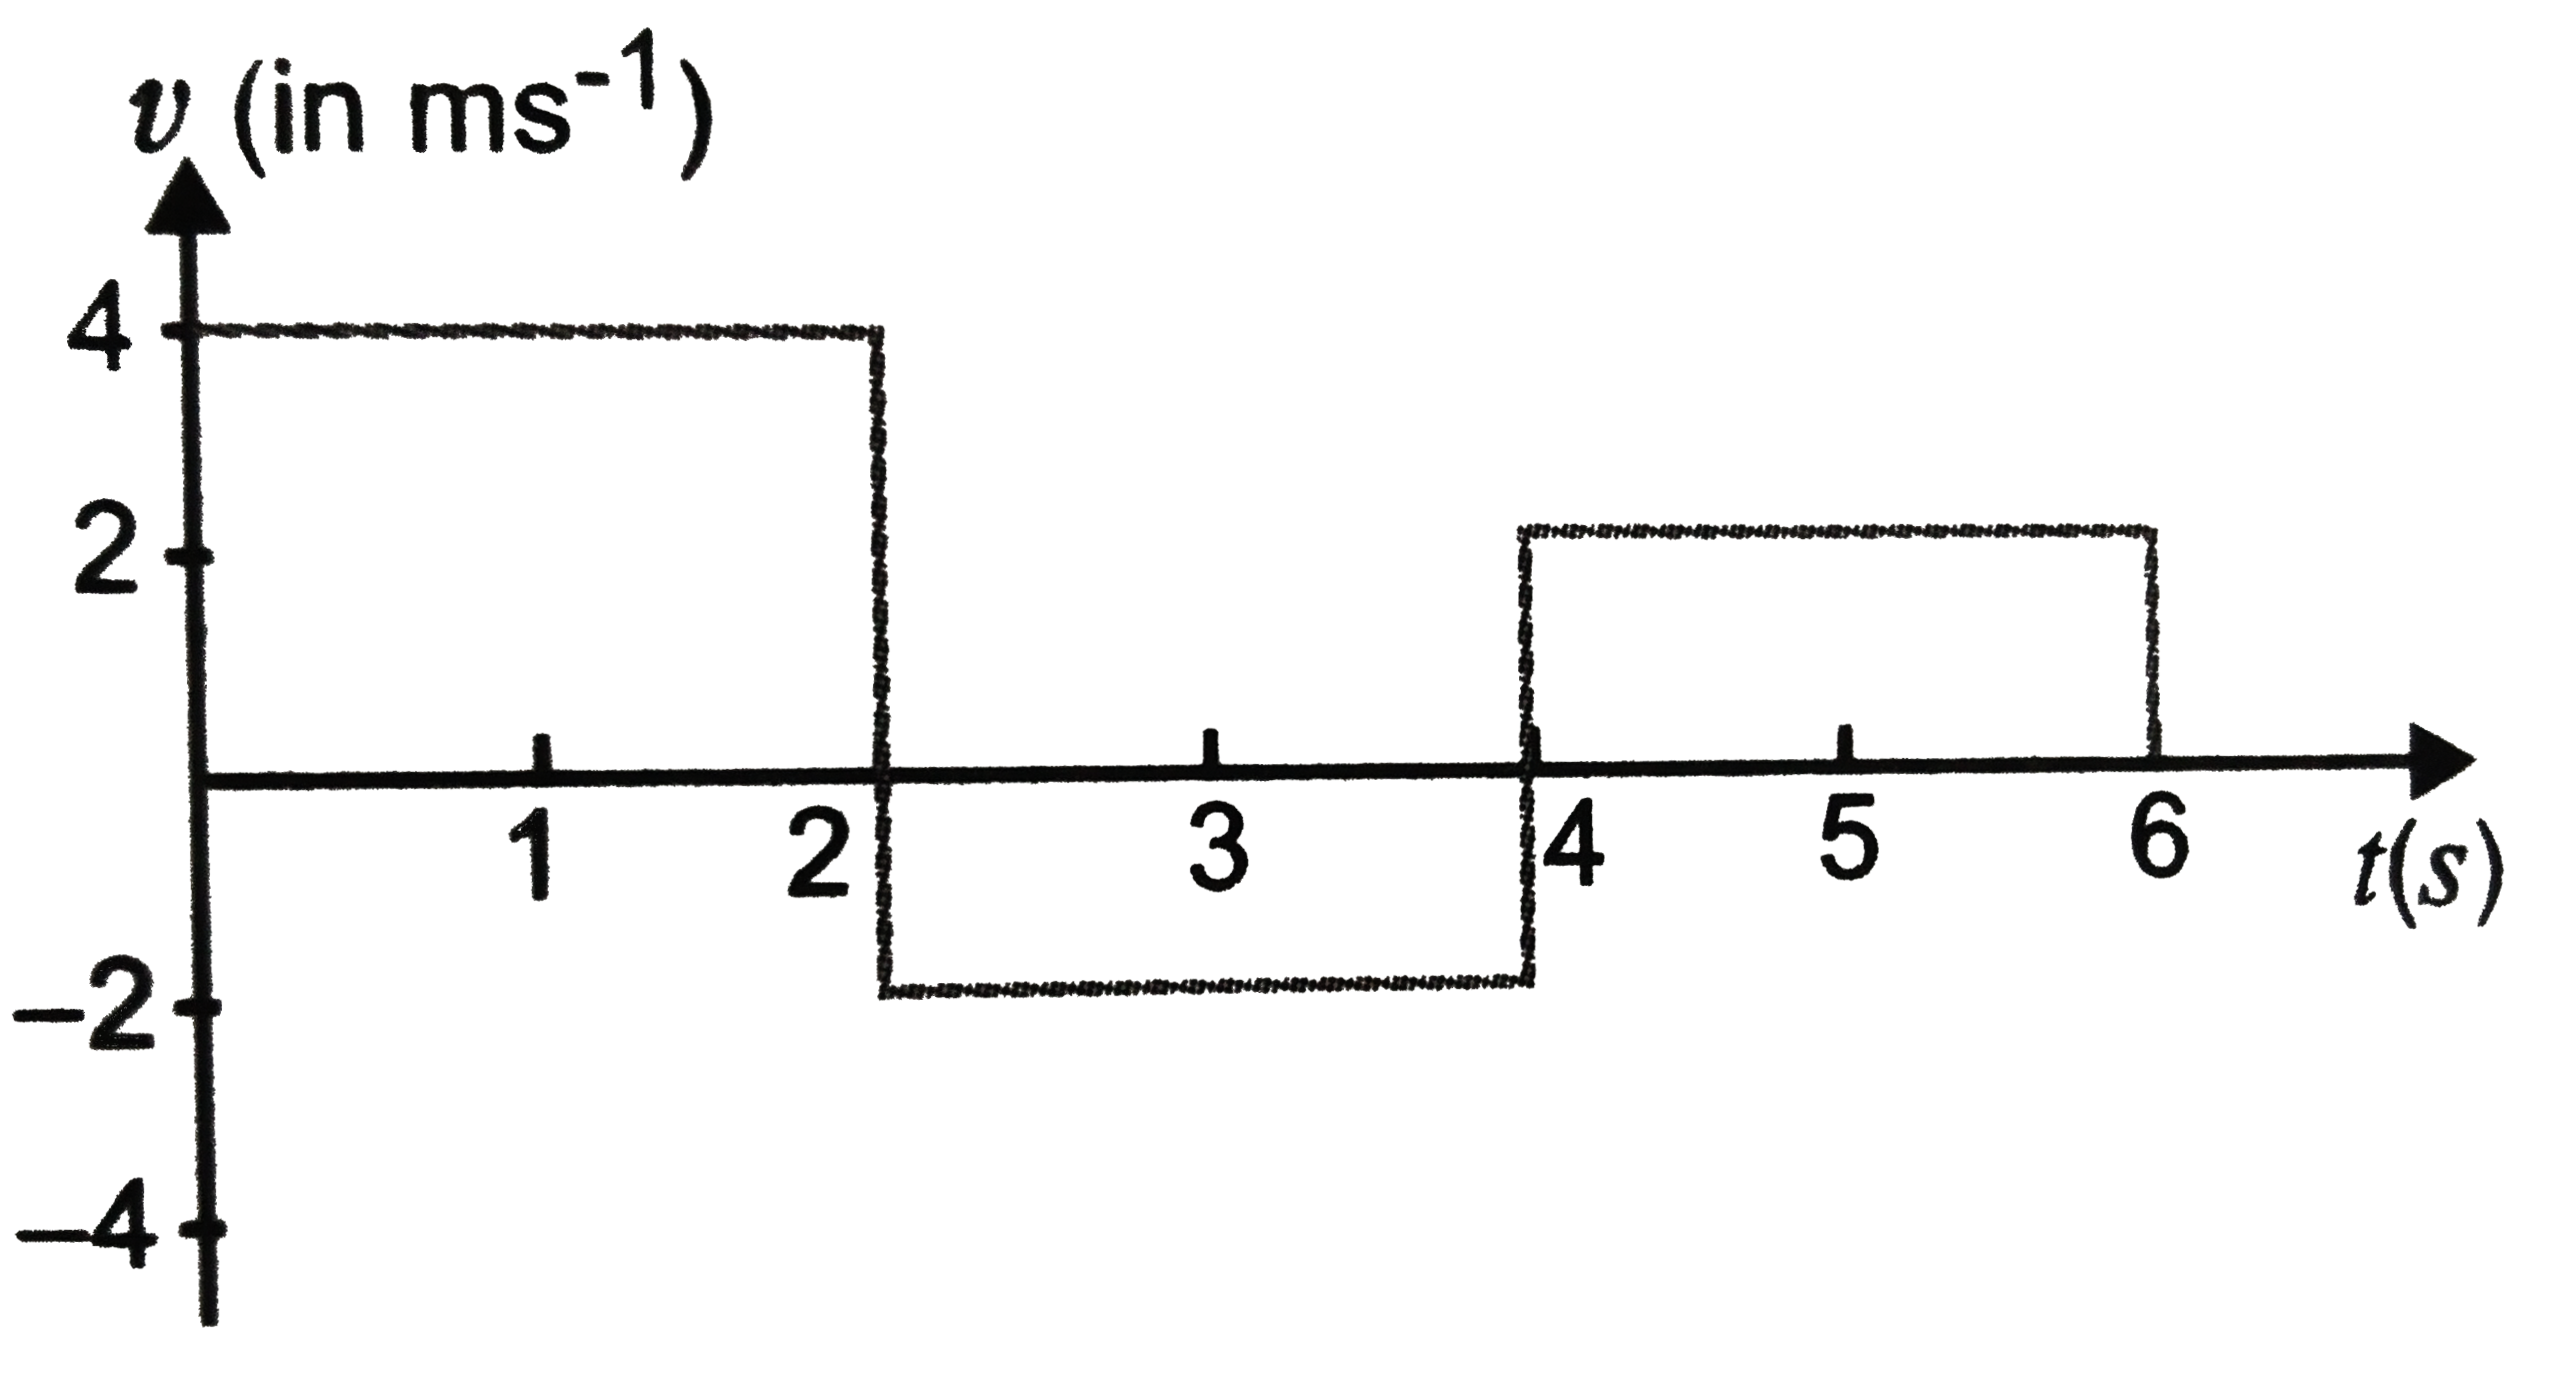
The velocit-time graph of a body moving in a straight line is shown in Fig. 2 (d) . 32. Find the displacement and the distance travelled by the body in 6seconds.
 .View Solution
The velocity versus time graph of a body moving along a straight path is shown below.
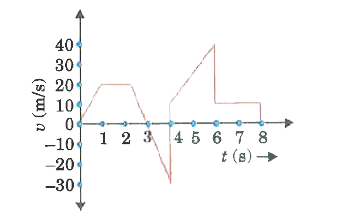
(i) Calculate the distance covered by the body from t=0 to t=8s.
(ii) find its net displacement from t=0 to 8 s.View SolutionThe velocity-time graph of a particle moving along a straight line is shown in the figure-given below
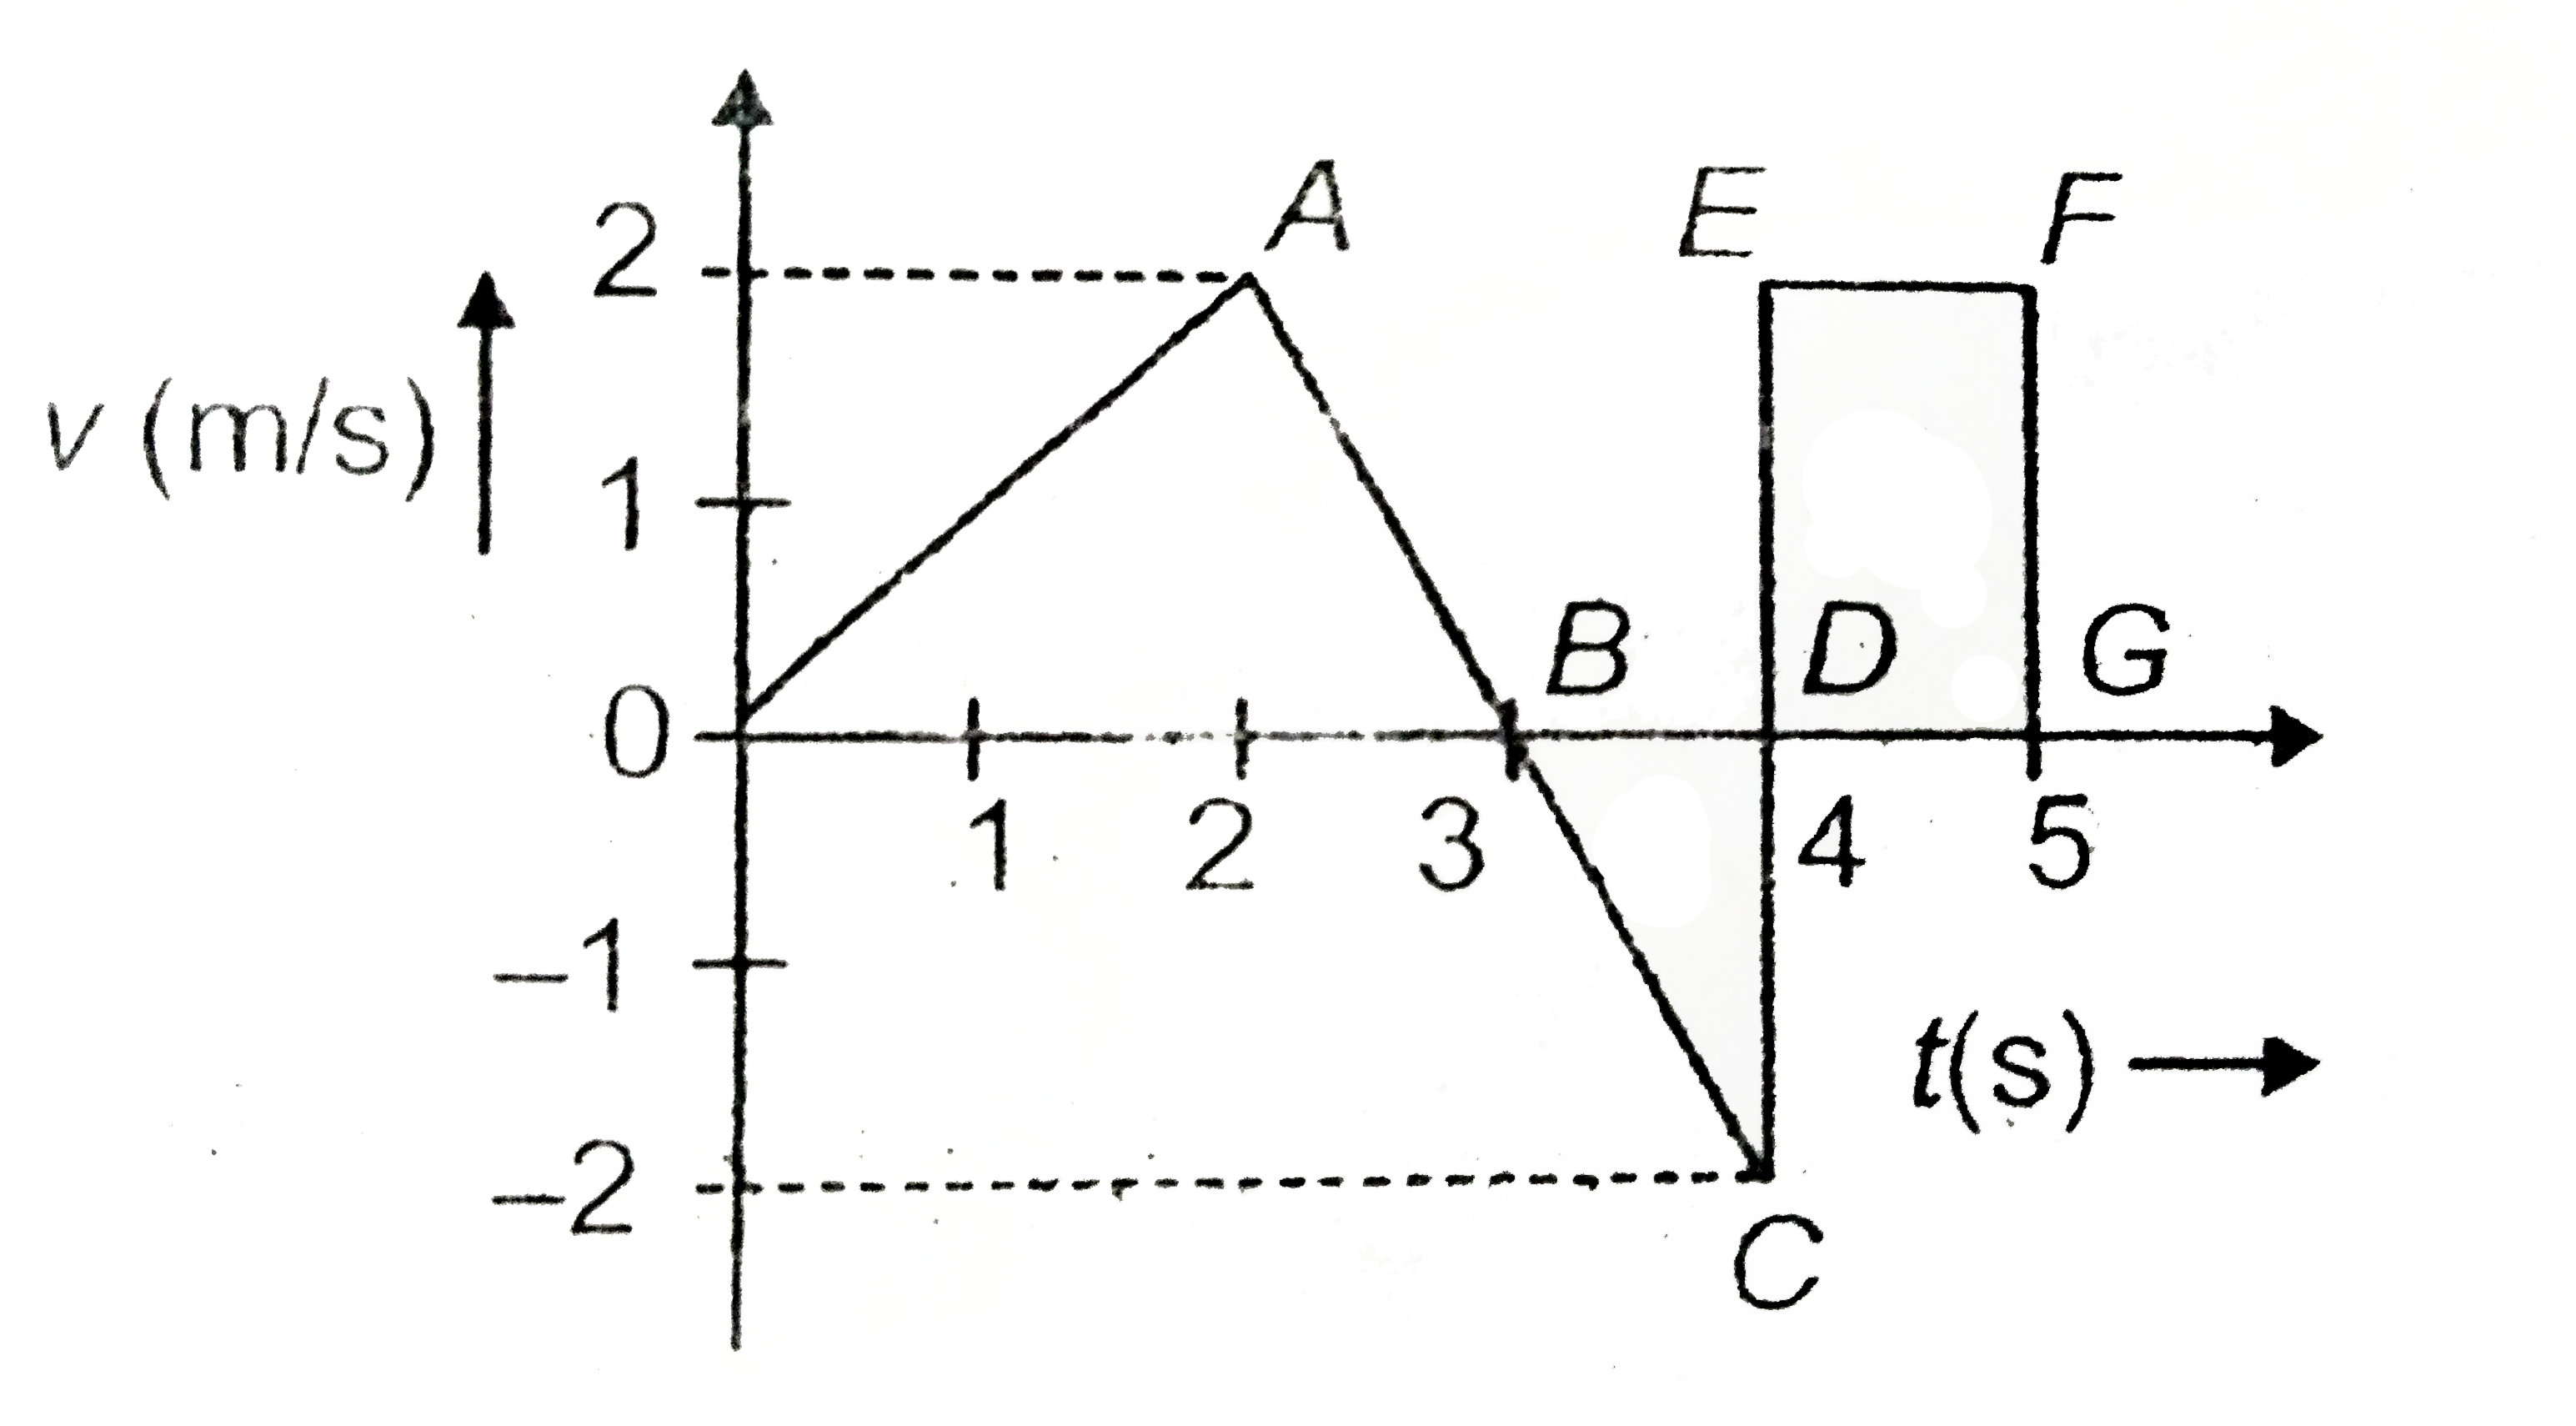
The displacement of the particle in 5 second isView Solution

