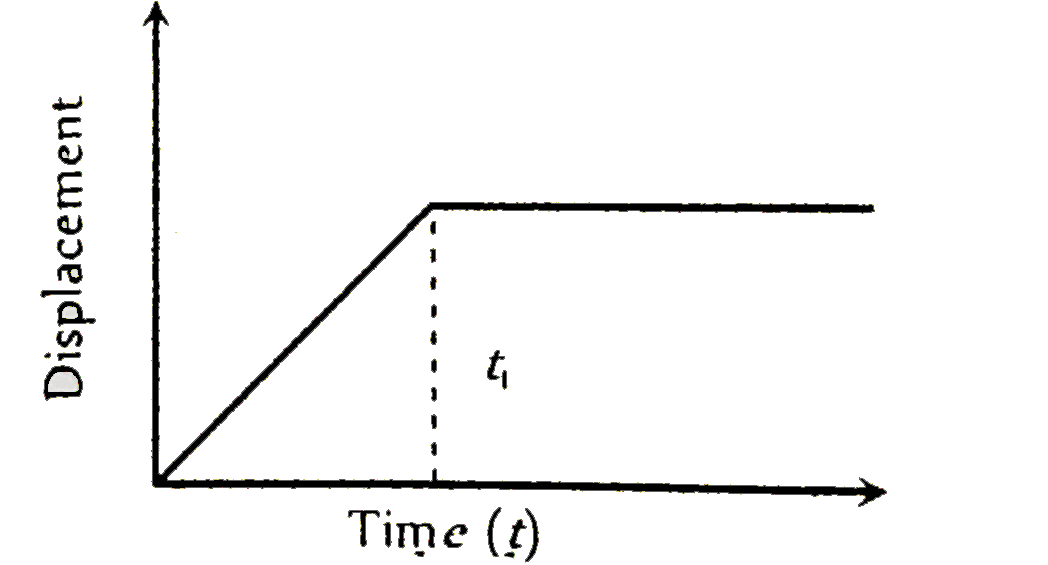
The x -t graph shown in figure represents
the particle is continuously going along positive x direction
the particle is at rest
the velocity increases upto time t1and then becomes constant
the particle moves at a constant velocity upto time t1 and then stops
The correct Answer is:D
Step by step video, text & image solution for The x -t graph shown in figure represents by Physics experts to help you in doubts & scoring excellent marks in Class 11 exams.
Updated on:21/07/2023Topper's Solved these Questions
- MOTION IN ONE DIMENSIONBOOK - ERRORLESS CHAPTER - MOTION IN ONE DIMENSIONEXERCISE - Assertion & Reason
30 Videos
- MOTION IN ONE DIMENSIONBOOK - ERRORLESS CHAPTER - MOTION IN ONE DIMENSIONEXERCISE - Motion In One Dimension
24 Videos
- MOTION IN ONE DIMENSIONBOOK - ERRORLESS CHAPTER - MOTION IN ONE DIMENSIONEXERCISE - Critical Thinking
19 Videos
- GRAVITATIONBOOK - ERRORLESS CHAPTER - GRAVITATIONEXERCISE - SET
27 Videos
- MOTION IN TWO DIMENSIONBOOK - ERRORLESS CHAPTER - MOTION IN TWO DIMENSIONEXERCISE - Exercise
319 Videos
Similar Questions
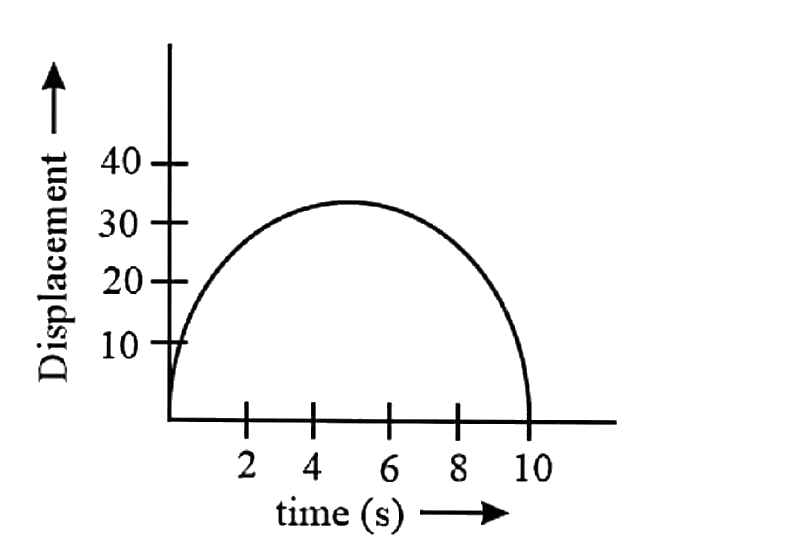
The displacement-time of a moving object is shown in figure. Which of the velocity-time graphs shown in figure could represent the motion of the same body?
View SolutionWhich of the velocity-time (v - 1) graphs shown in figure can possibly represent one-dimensional motion of a particle? (A) (B)
View Solution
Knowledge Check
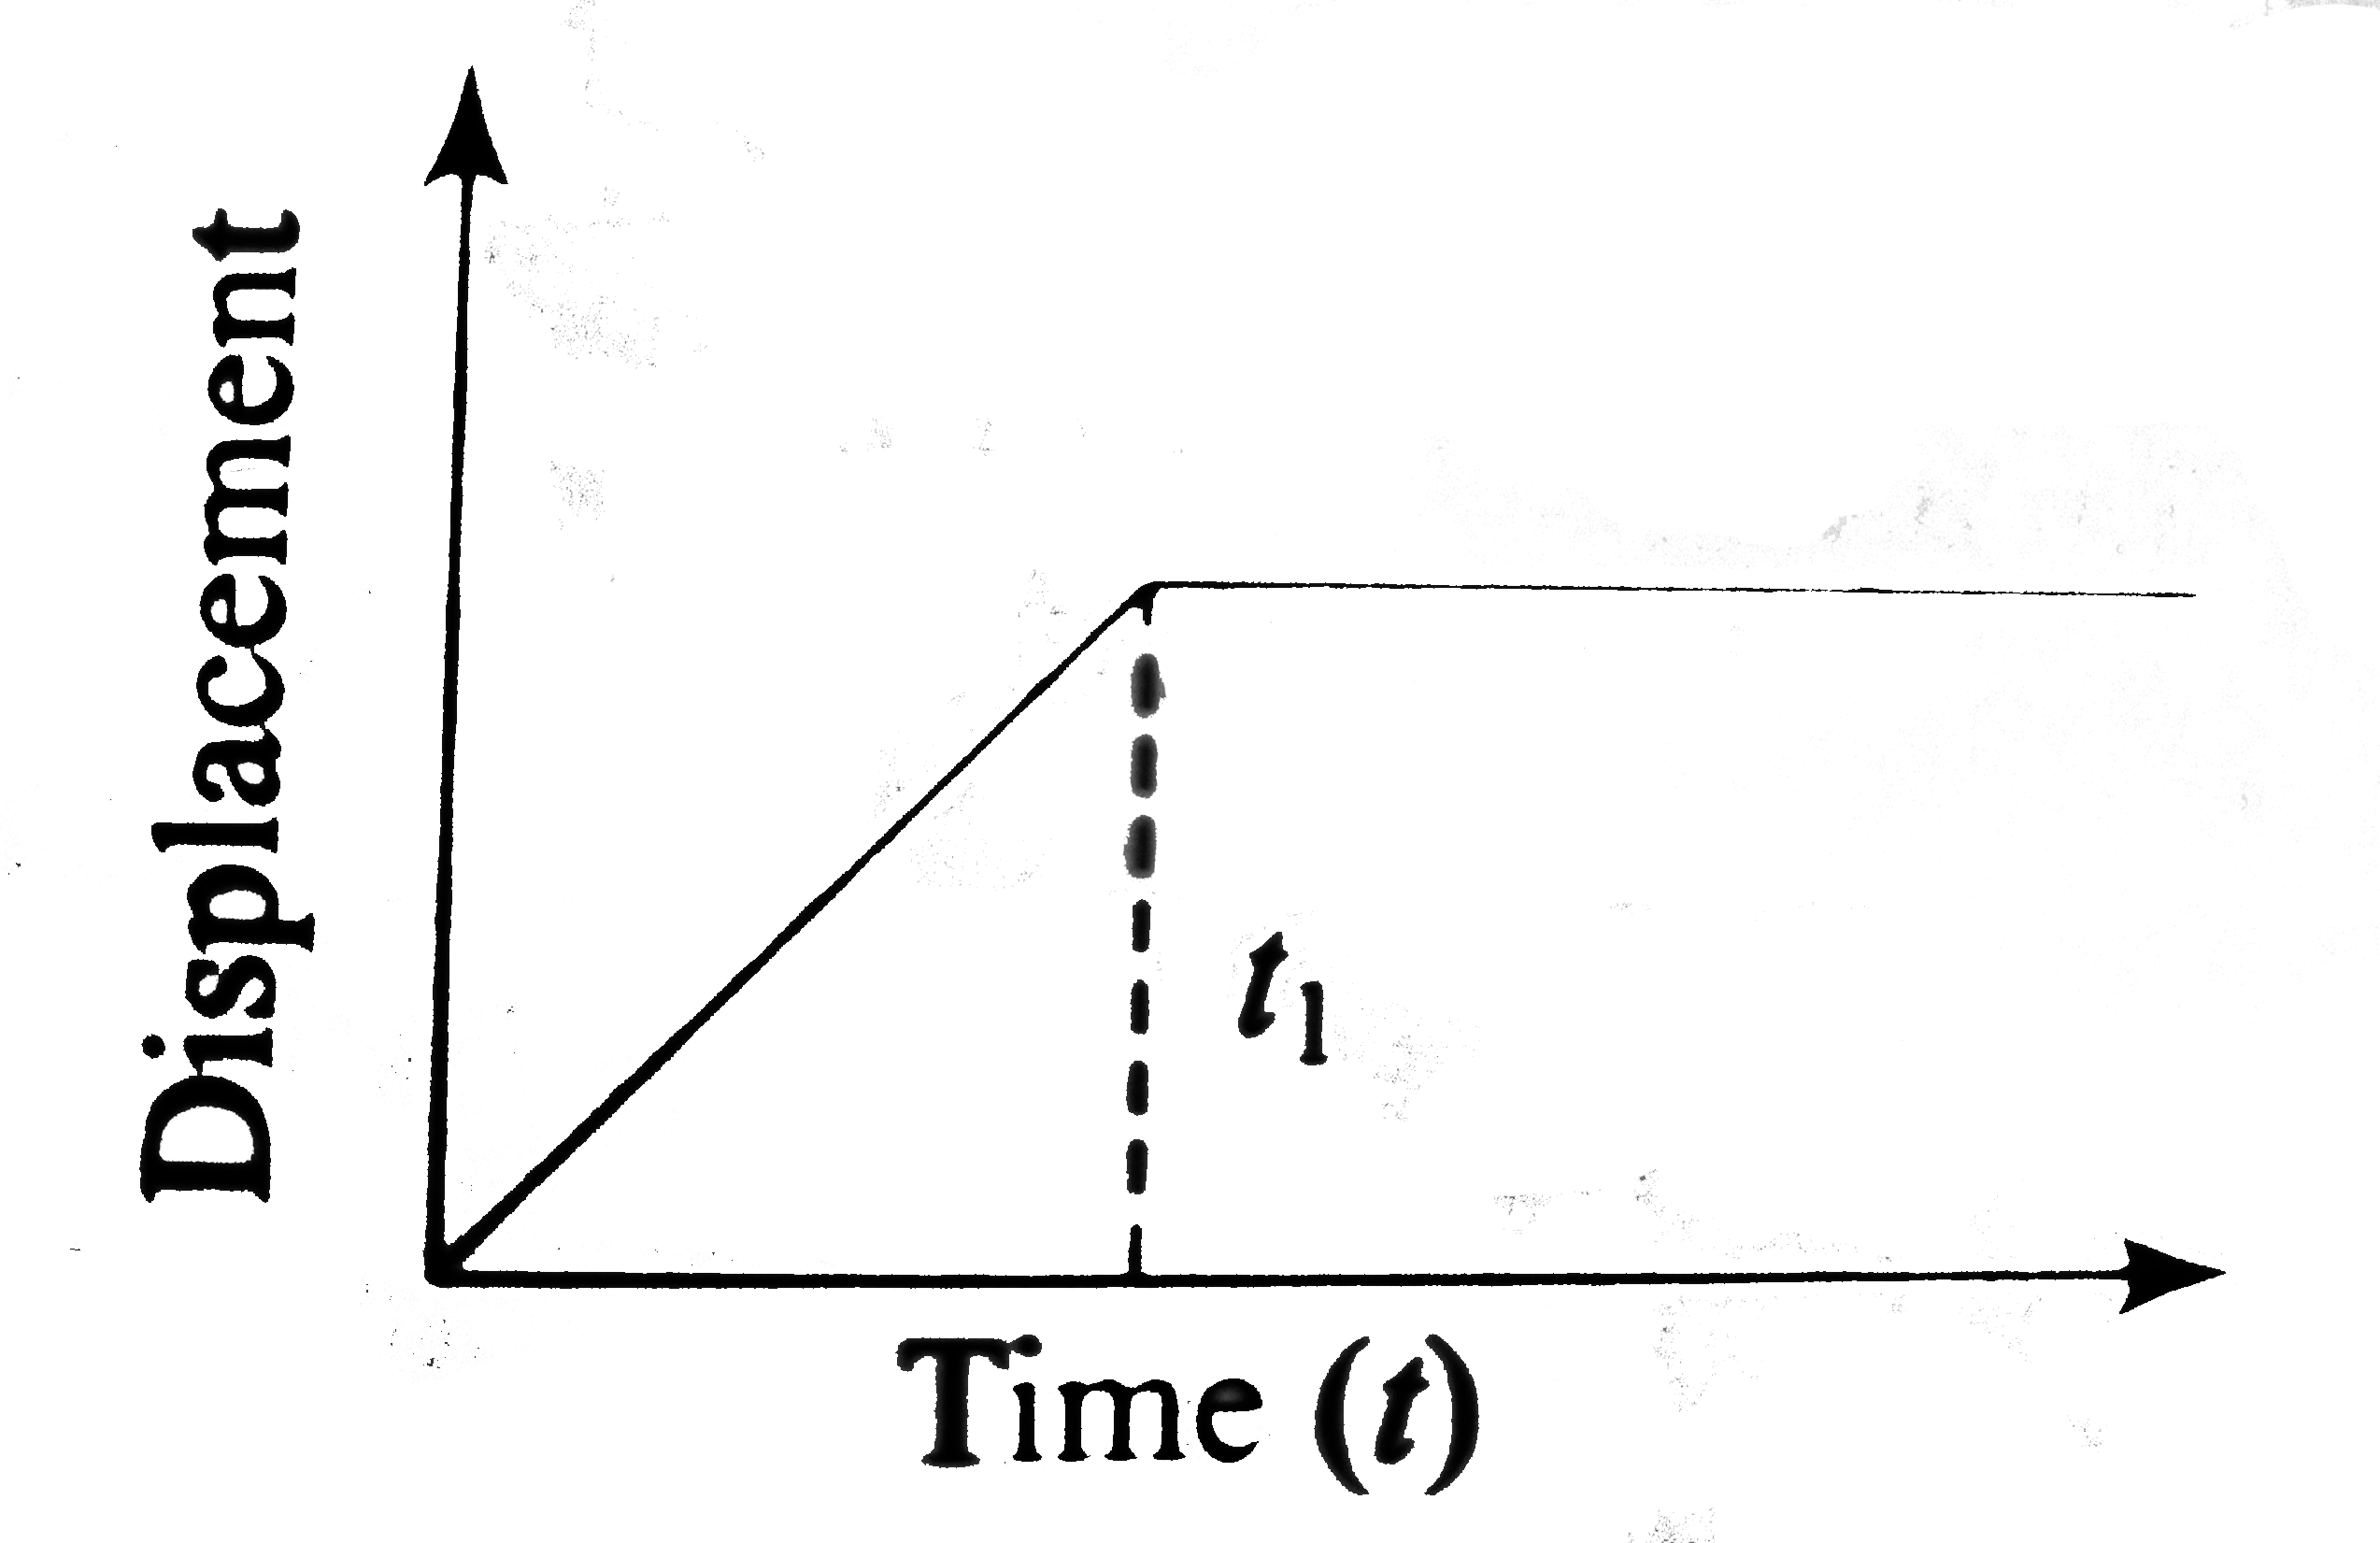
The x-t graph shoen in figure reprentsAConstant velocityBvelocity of the body is continuously changingCinstantaneous velocityDthe body travels with constant speed upto time t1 and then stops
Figure shows the displacement tiime (x-t) graph of a body moving in a straight line which one of the graph shown in figure represents the velocity- time (v-t) graph of the motion of the body.A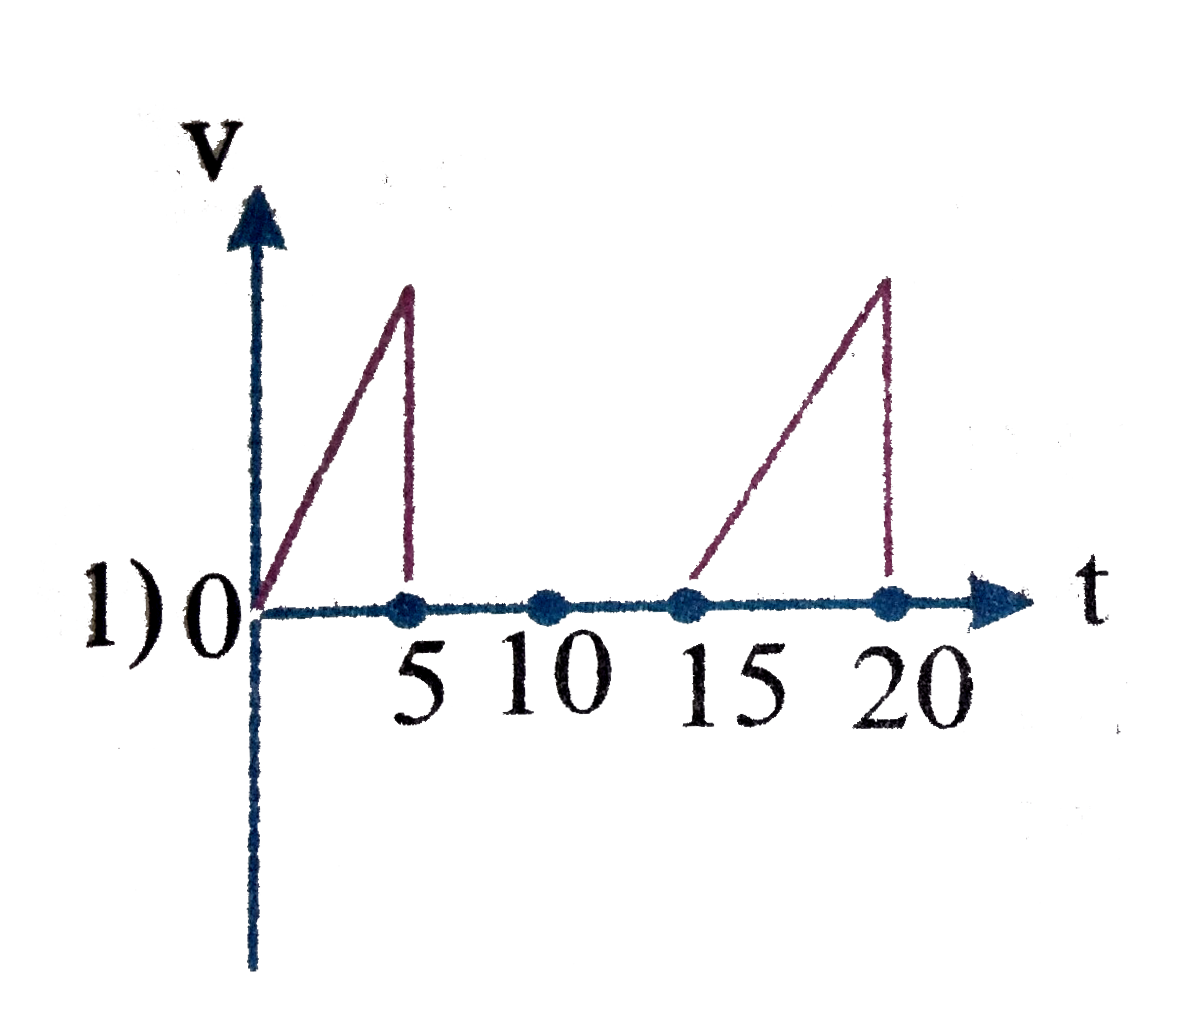 B
B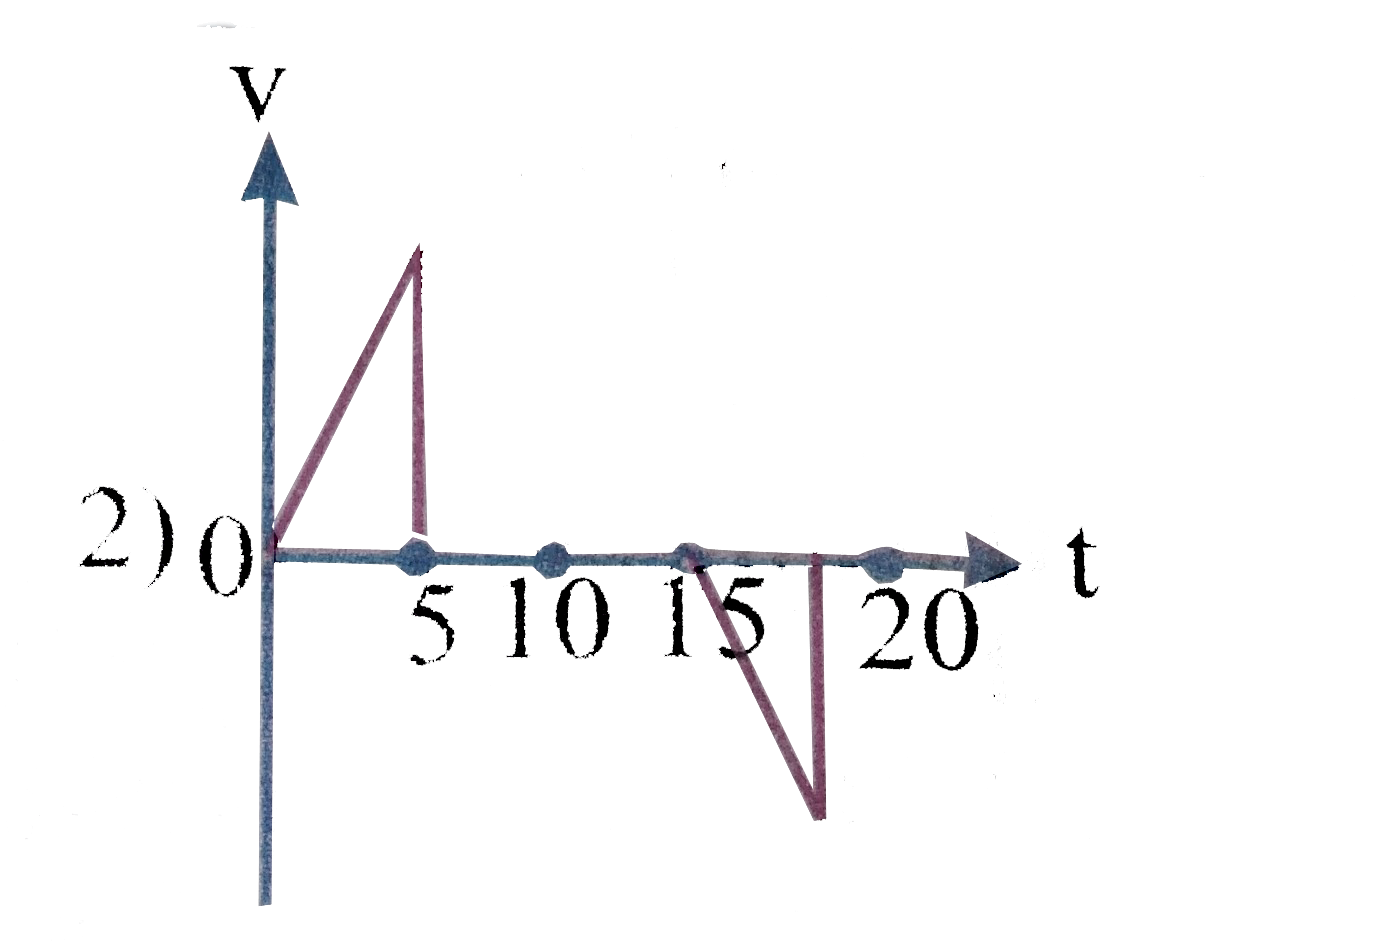 C
C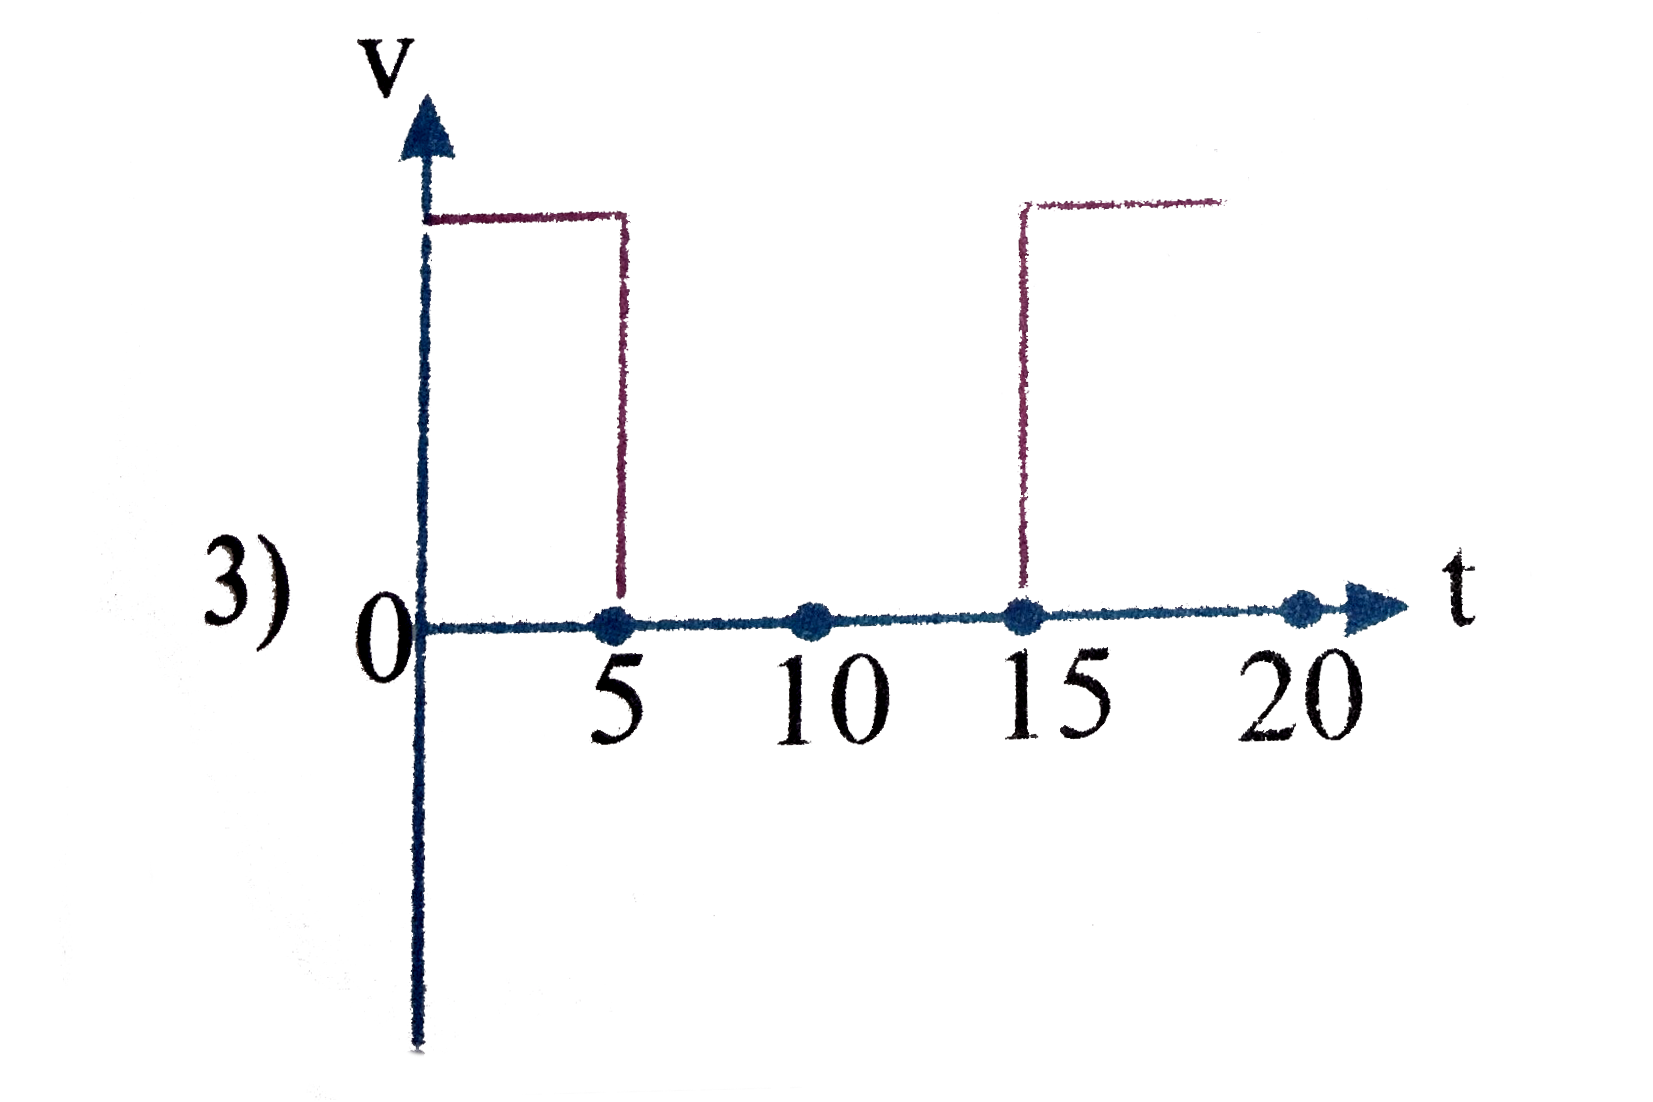 D
D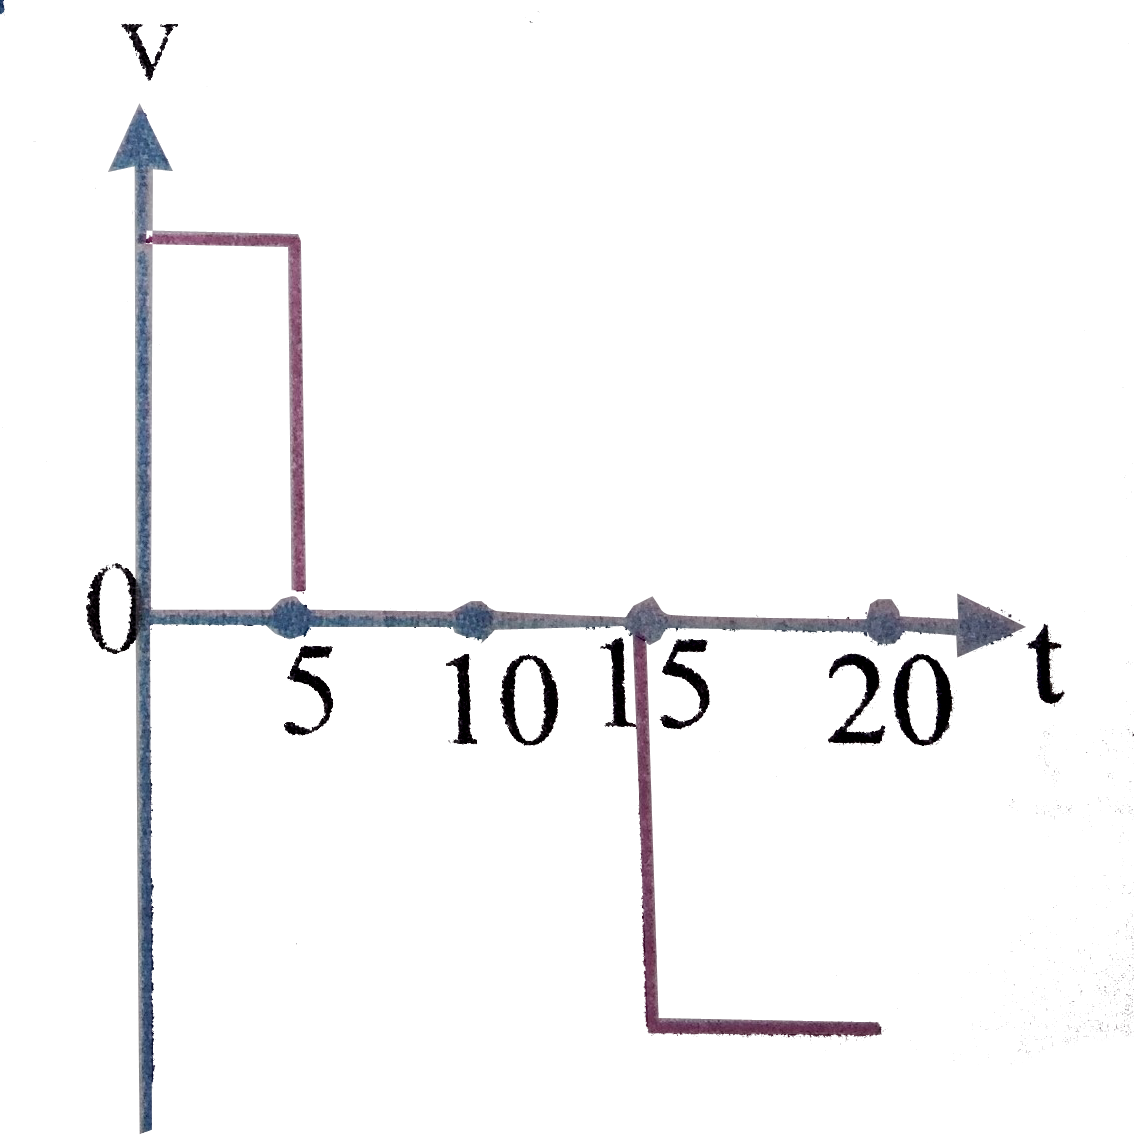
The graph in figure shows the velocity v versus time t for a body. Which of the graphs shown in figure represents the corresponding acceleration versus time graphs ?
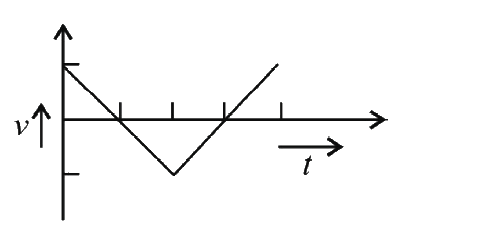 A
A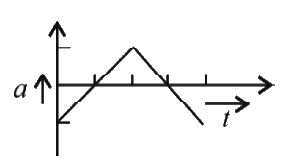 B
B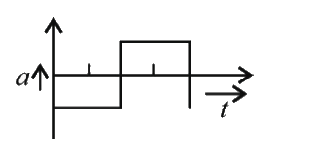 C
C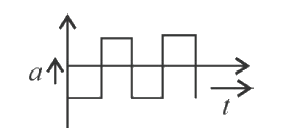 D
D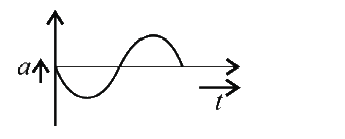
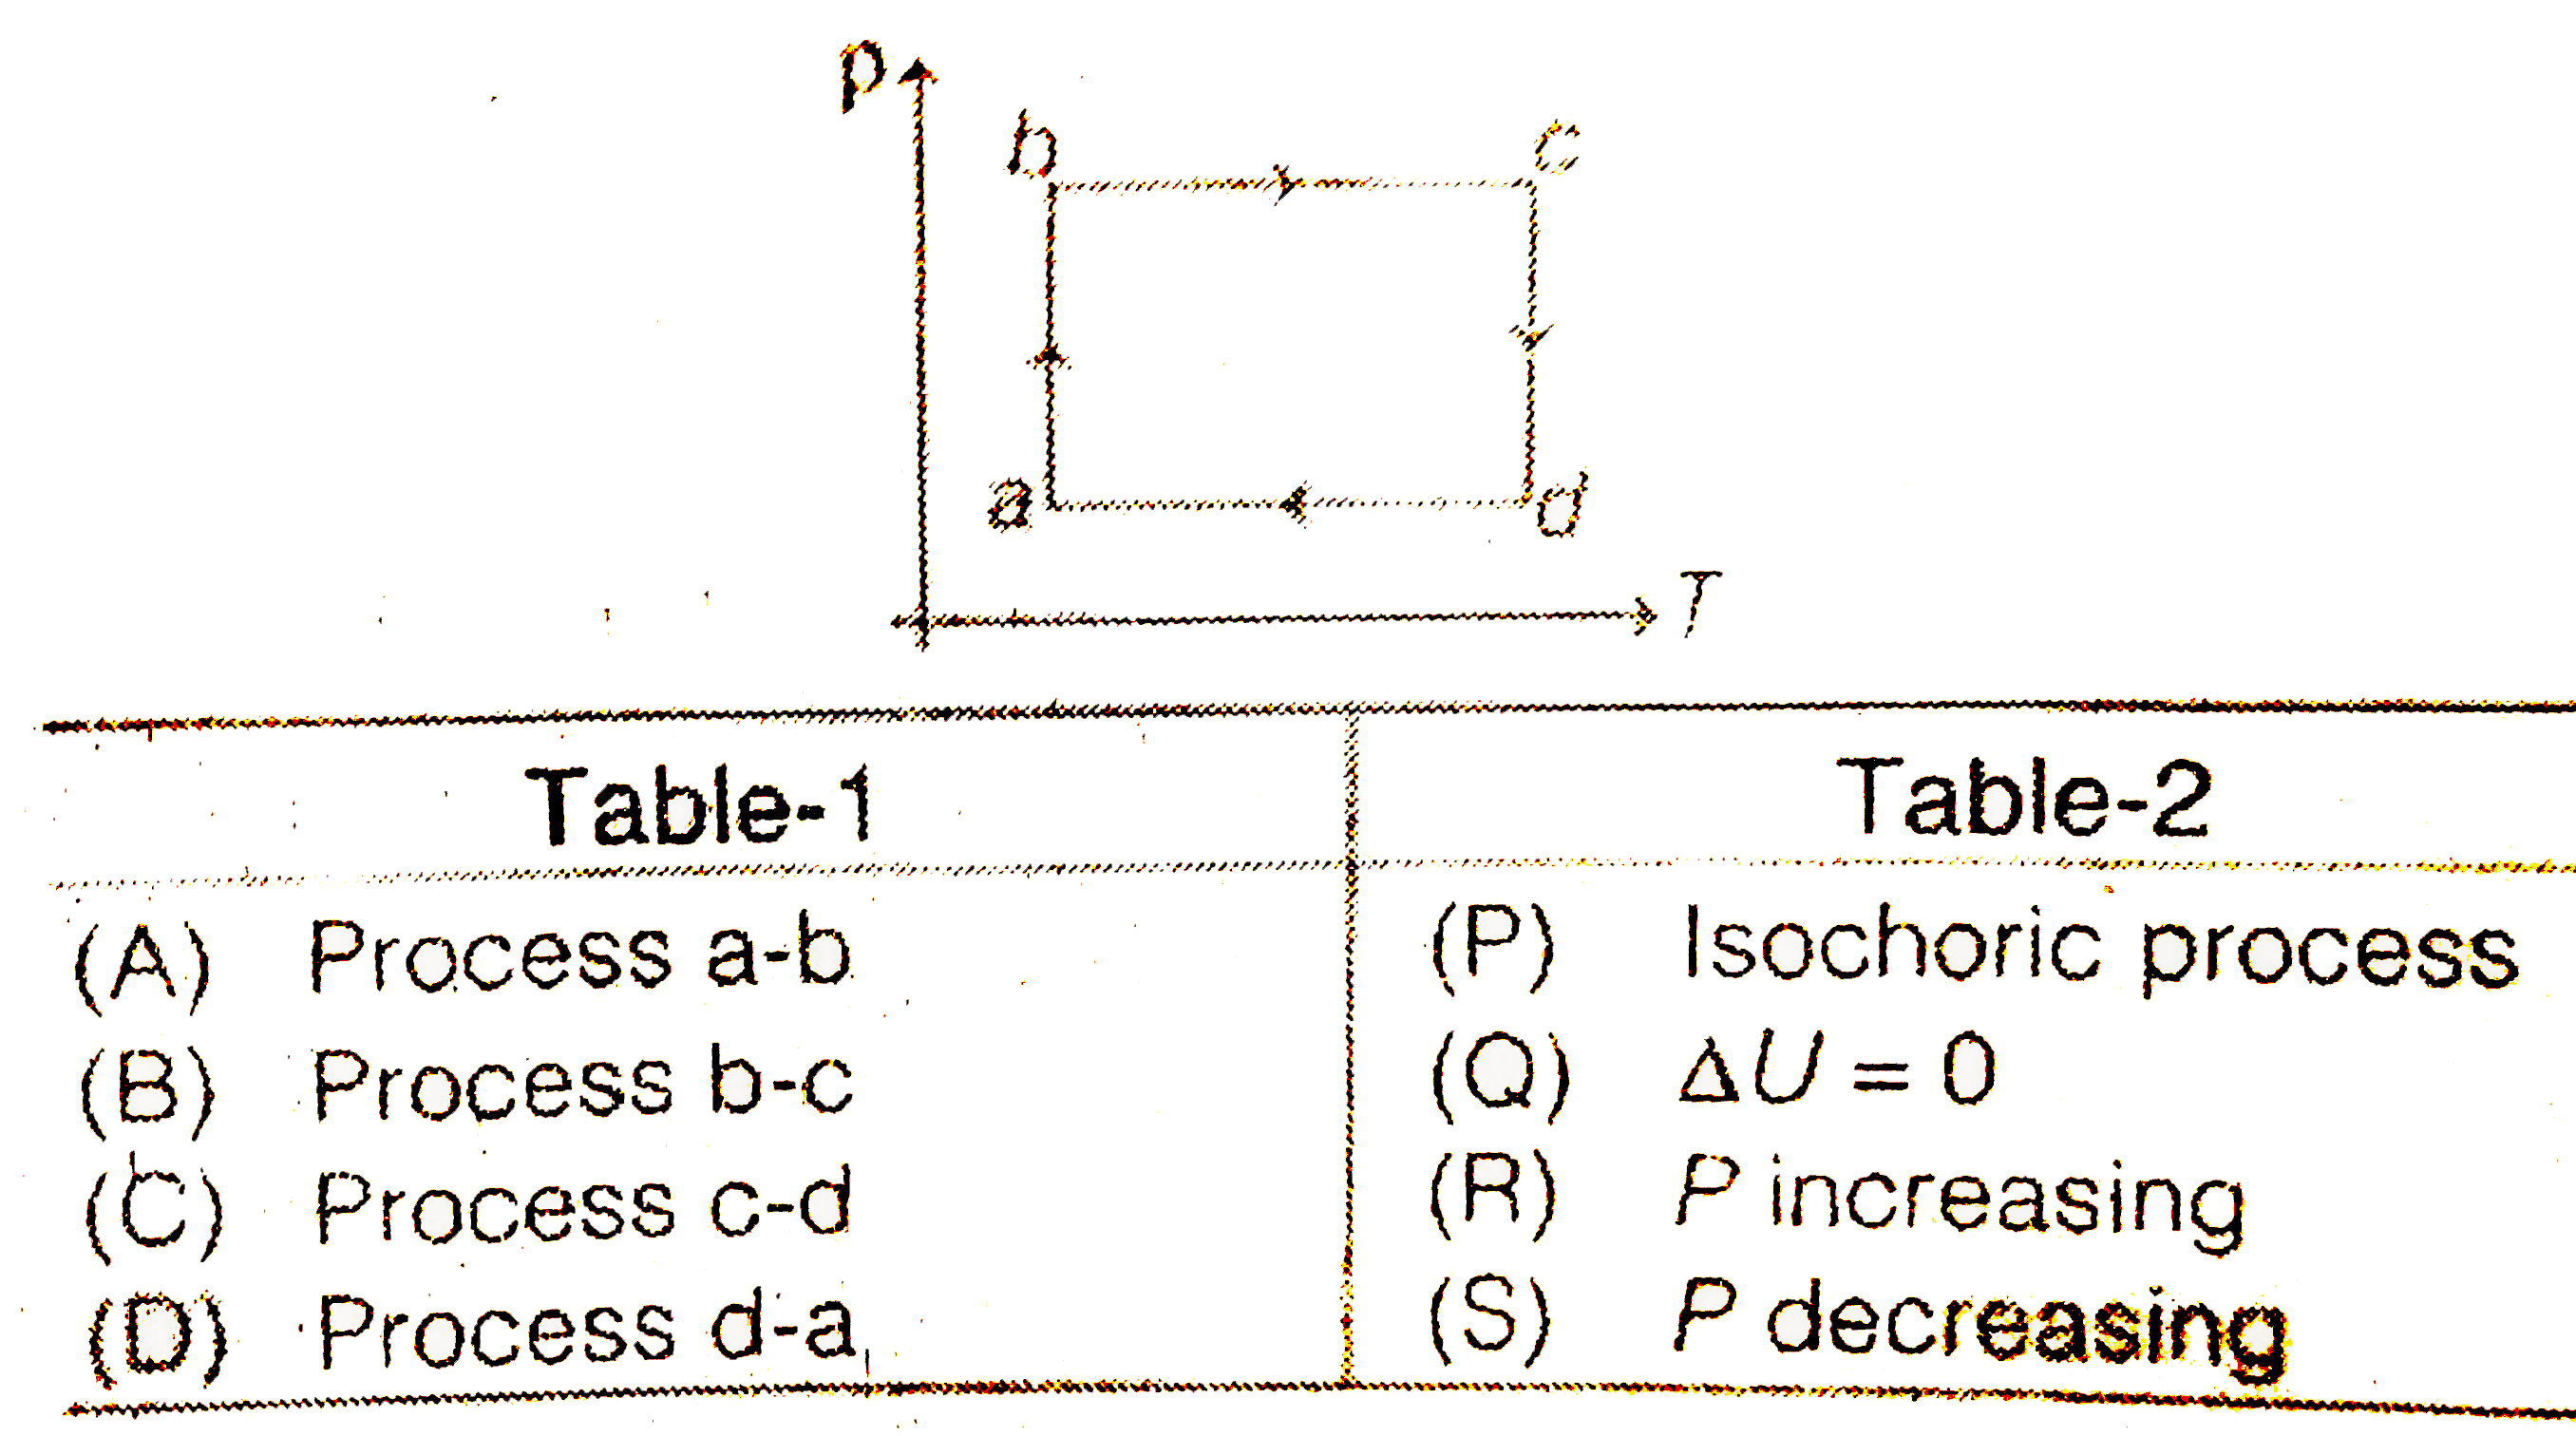
In the ρ-T graph shown in figure, match the following.
View SolutionA : The displacement (s) time graph shown in the figure represents an accelerated motion.
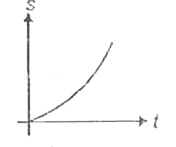
R : Slope of graph increases with time.
View SolutionAssertion : In the s-t graph as shown in figure, velocity of particle is negative and acceleration is positive.
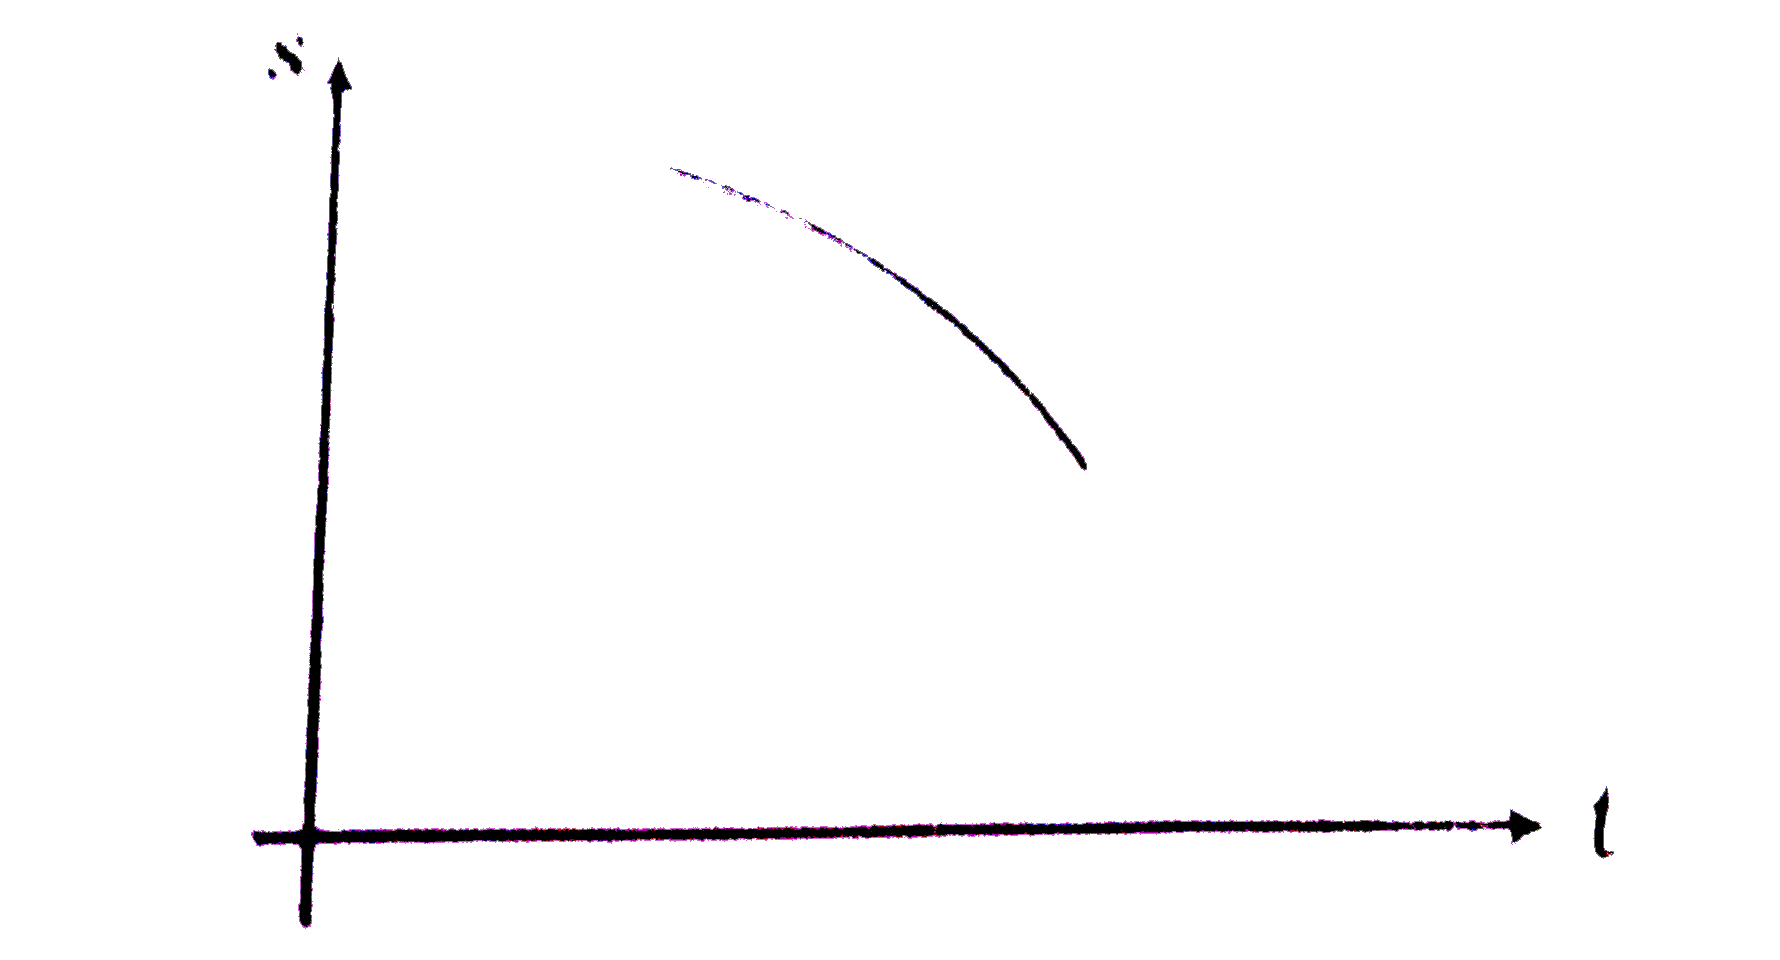
Reason : Slope of s-t graph is negative and increasing in magnitude.
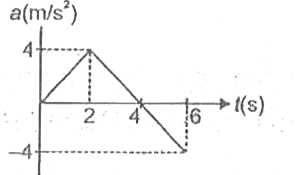
View SolutionFor the acceleration - time (a - t) graph shown in figure, the change in velocity of particle from t = 0 to t = 6 s is
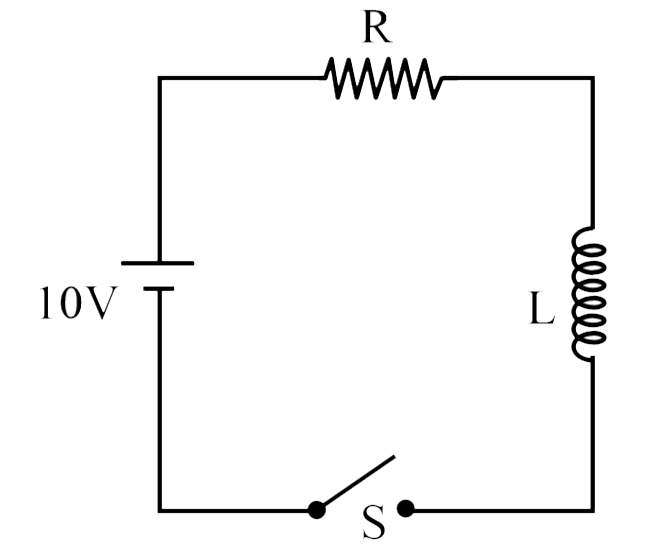
View SolutionIn the circuit shown, the switch is closed at time t = 0.
Which of the graphs shown below best represents the voltage across the inductor, as seen on an oscilloscope ?

View Solution
