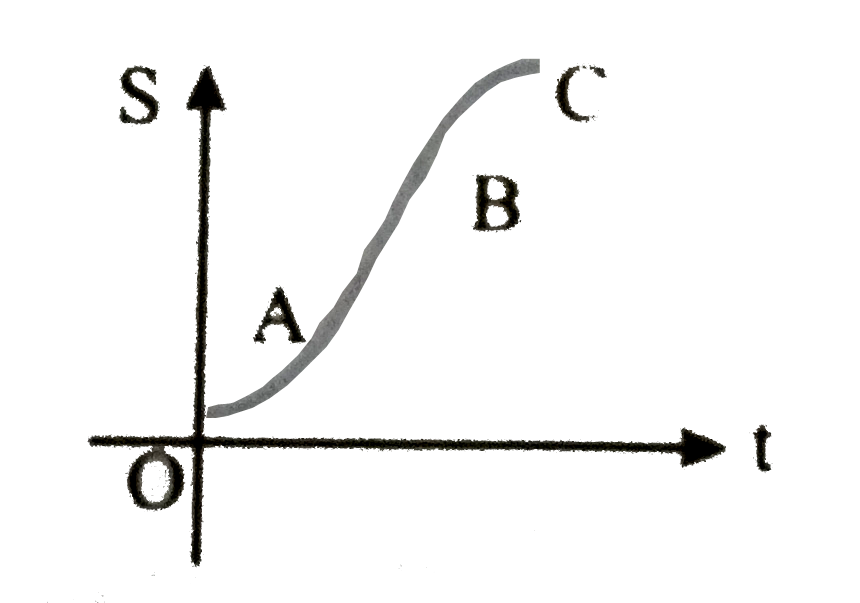
The graph between the displacement and time for a particle moving in a straight line is shown in the figure. During the interval and the acceleration of the particle is
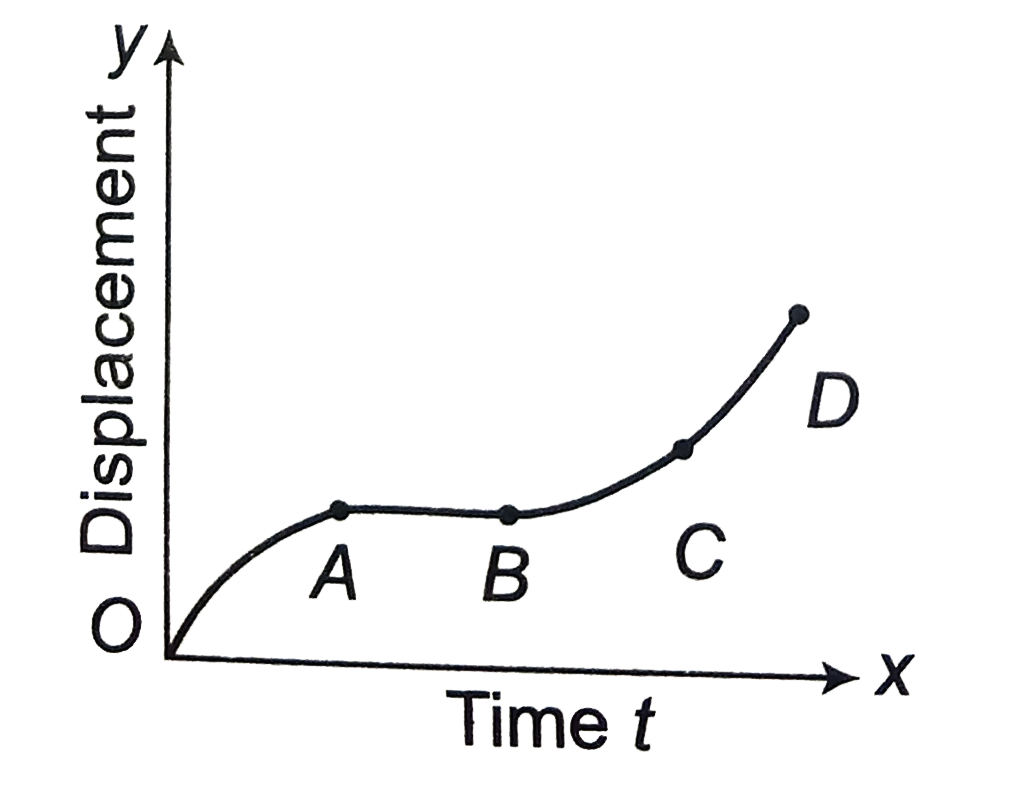
The correct Answer is:B
Step by step video, text & image solution for The graph between the displacement x and time t for a particle moving in a straight line is shown in the figure. During the interval OA, AB, BC and CD the acceleration of the particle is OA, AB, BC, CD by Physics experts to help you in doubts & scoring excellent marks in Class 11 exams.
Topper's Solved these Questions
- BOOK - ERRORLESS CHAPTER - MOTION IN ONE DIMENSIONEXERCISE - Assertion & Reason30videos
MOTION IN ONE DIMENSION
- BOOK - ERRORLESS CHAPTER - MOTION IN ONE DIMENSIONEXERCISE - Motion In One Dimension24videos
MOTION IN ONE DIMENSION
- BOOK - ERRORLESS CHAPTER - MOTION IN ONE DIMENSIONEXERCISE - Critical Thinking19videos
MOTION IN ONE DIMENSION
- BOOK - ERRORLESS CHAPTER - GRAVITATIONEXERCISE - SET27videos
GRAVITATION
- BOOK - ERRORLESS CHAPTER - MOTION IN TWO DIMENSIONEXERCISE - Exercise319videos
MOTION IN TWO DIMENSION
Similar Questions
Knowledge Check
- Question 1 - Select One or More
Displacement time graph of a particle moving in a straight line is a shown in figure.
 Ain region A acceleration is positiveBin region B acceleration is negativeCin region C acceleration is positiveDin region D acceleration is negative
 - Question 2 - Select One or More
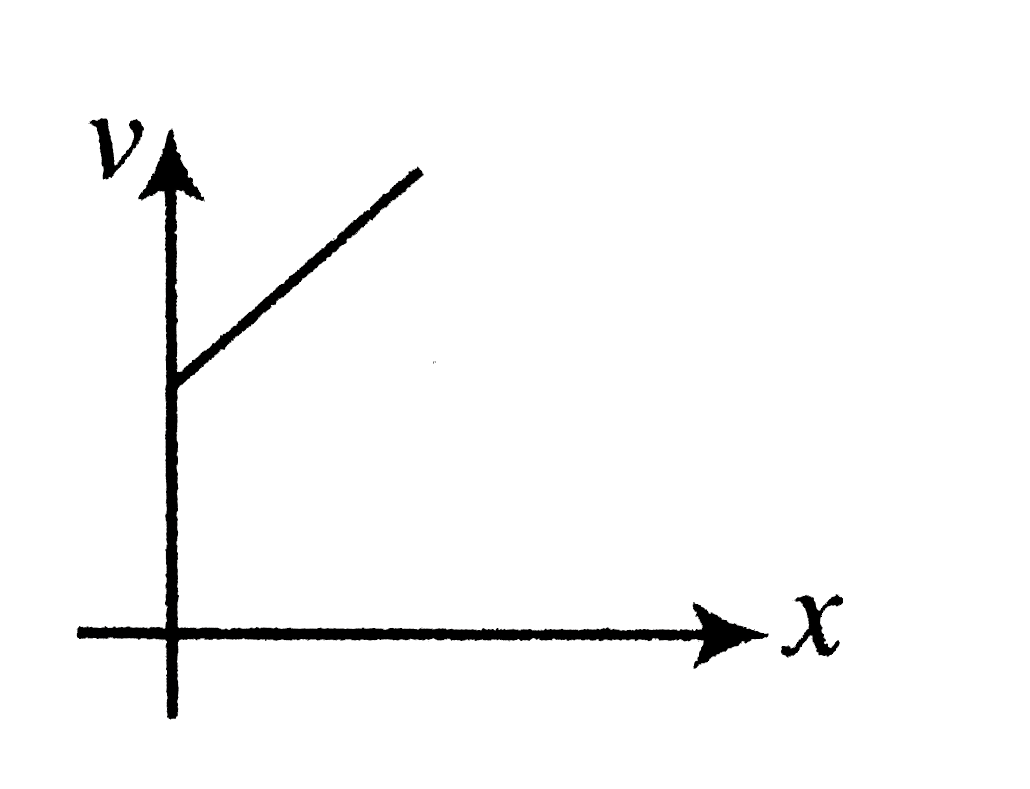
Velocity displacement graph of a particle moving in a straight line is as shown in figure.
 Amagnitude of acceleration of particle is decreasingBmagnitude of acceleration of particlre is increasingCacceleration versus displacement graph straight lineDacceleration versus displacement graph is parabola
 - Question 3 - Select One
The v-x graph for a particle moving along a straight line is shown in the figure. At which of the points marked, the acceleration is negative?
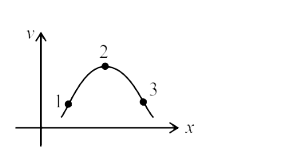 A1B3C1 and 2D3 and 2
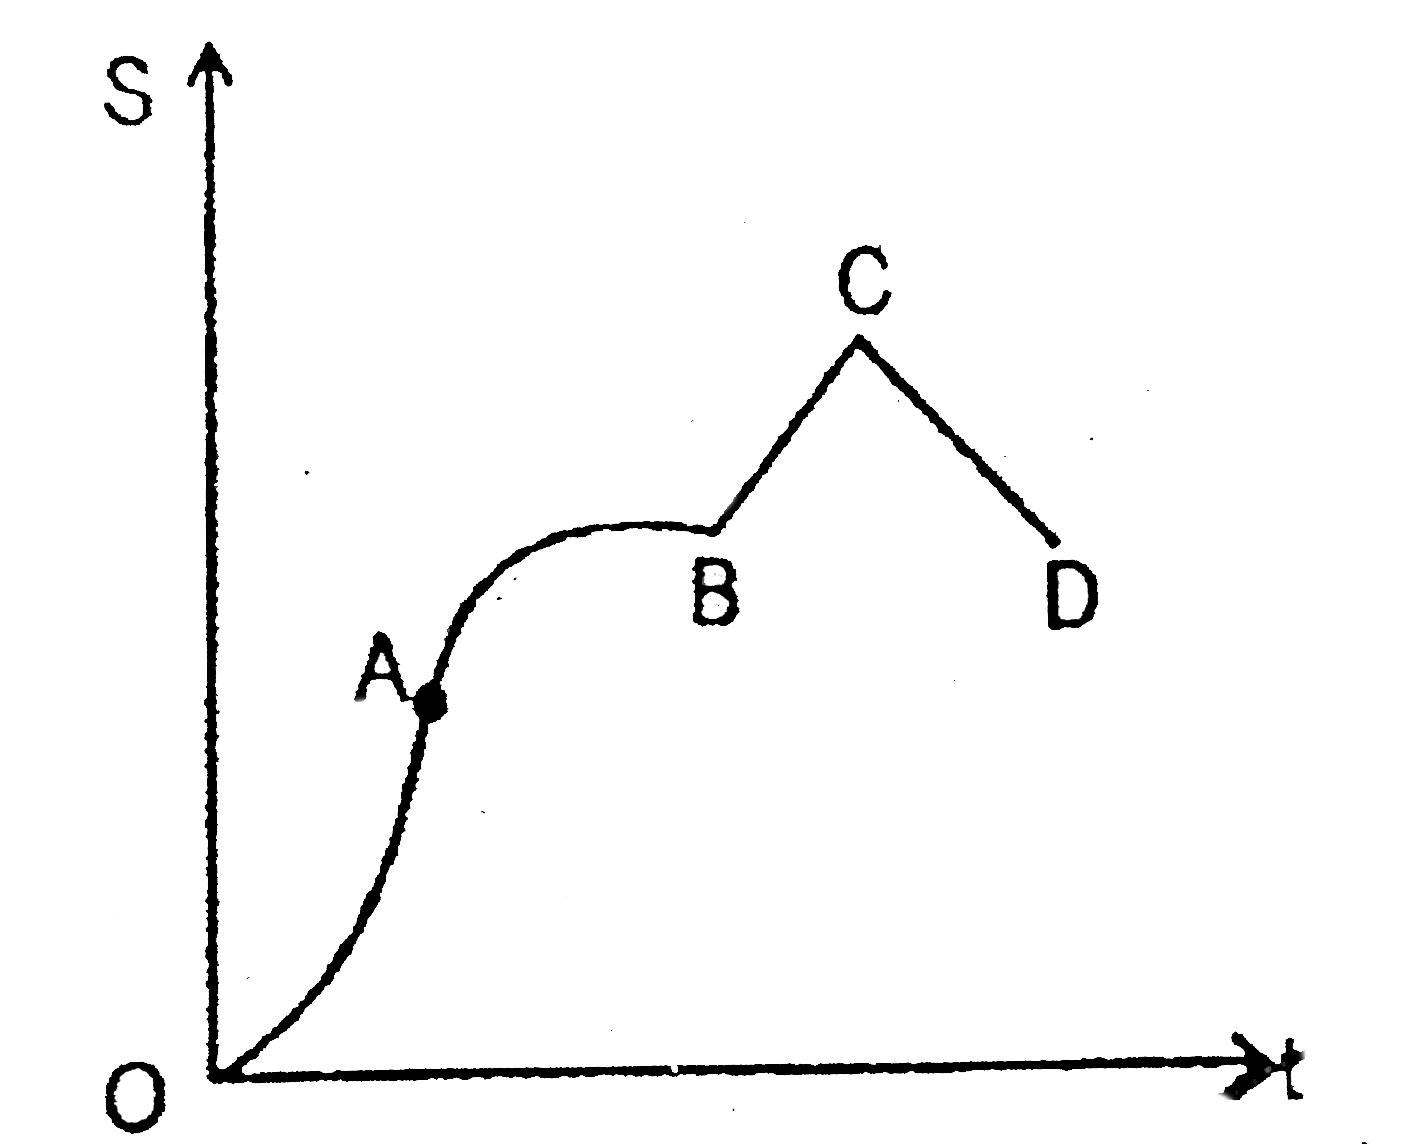
Displacment-time graph of a particle moving in a straight line is as shown in figure. Choose the INCORRECT statement(s)
 View Solution
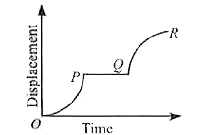
The displacement time graph of a particle moving along a straight line is shown. The accelerations of the particle during the regions OP, PQ and QR are
 View Solution
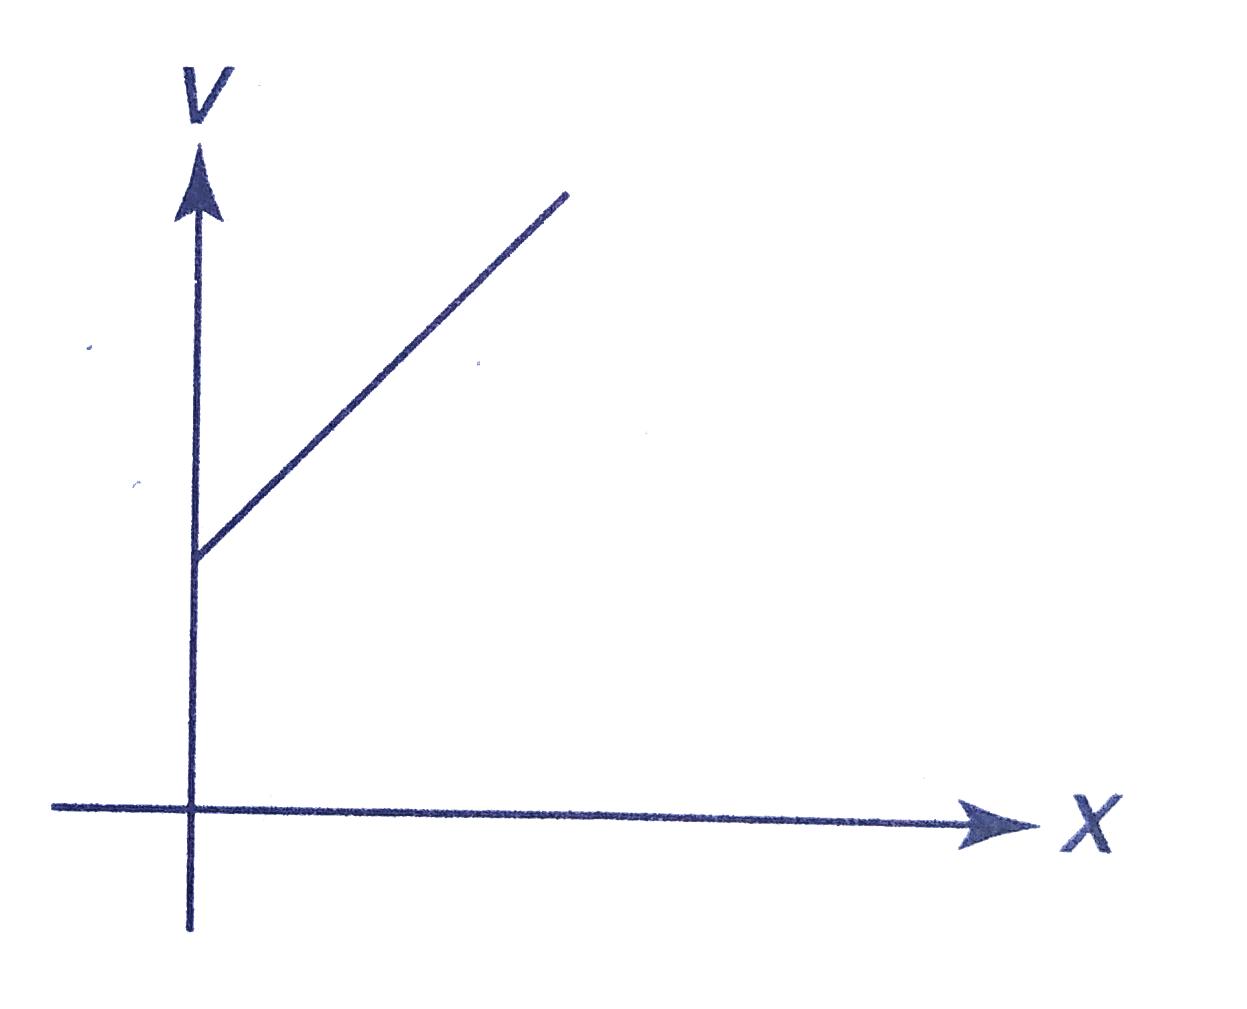
Graph of velocity versus displacement of a particle moving in a straight line is as shown in figure.
The acceleration of the particle is.
 View Solution
Displacement-time graph of a particle moving in a straight line is as shown in figure.
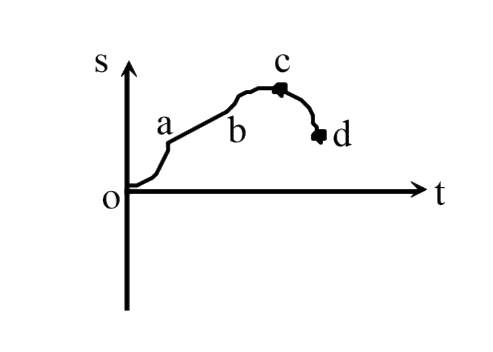
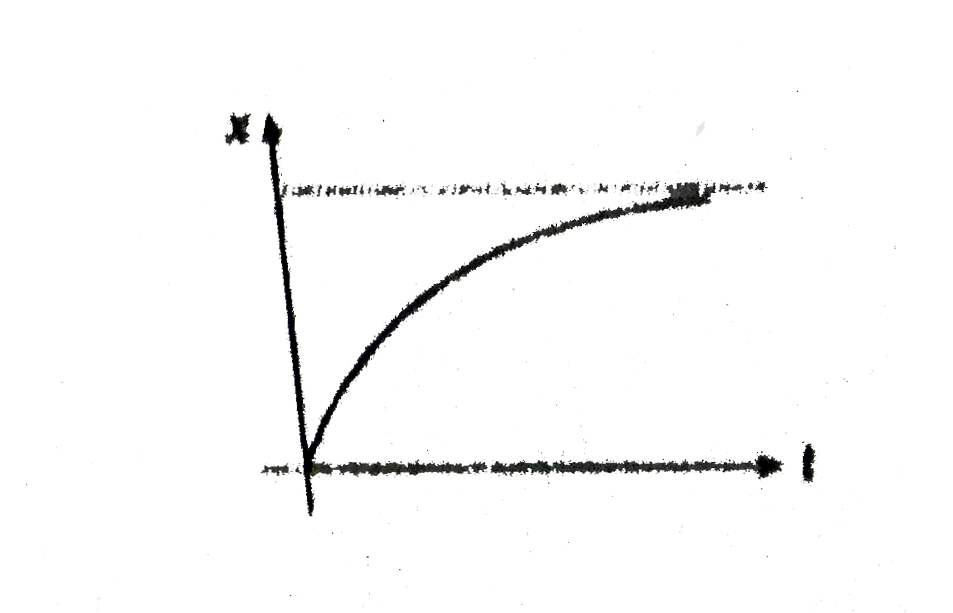
Q. Find the sign of acceleration in the above regionView SolutionVariation of displacement x of a particle moving on a straight line with time t is shown in following figure. The figure indicates :
 View Solution


 .
.