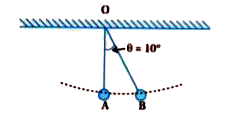
Two pendulums with identical bobs and lengths are suspended from a common support such that in real position the two bobs are in contact (figure). One of the bobs is released after being displaced by10∘ so that it collides elastically head-on with the other bob.
(a) Describe the motion of two bobs.
(b) Draw a graph showing variation in energy of either pendumlum with time, for 0≤t≤2T , where T is the period of each pendulum.
 Solution in Gujrati
(a) Consider the adjacent diagram in which the bob B is displaced through an angle θ and released
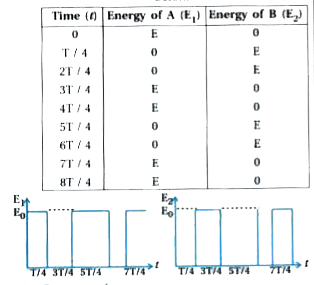
At t = 0 , suppose bob B is displaced by θ=10∘ to the right , It is given potential energy E1=E.Energy of A , E2=0
WhenB is released , it strikes A at t = T/4 .In the head - on elastic collision between B and A comes to rest and A gets velocity of B . Therefore e1=0andE2=E At t = 2T/4 ,B reaches its extreme right position when KE of A is converted into PE=E2=E Energy of B , E1=0
At t = 3T/4 , A reaches its mean position , when its PE is converted into KE=E2=E . It collides elastically with B and transfers whole of its energy to B . Thus , E2=0andE1=E . The entire process is repeated .
(b) The value of energies of B and A at different time intervals are tabulated here . the plot of energy with time 0≤t≤2T is shown separately for B and A in the figure below .
 .
.
Topper's Solved these Questions
- WORK, ENERGY AND POWER BOOK - KUMAR PRAKASHANCHAPTER - WORK, ENERGY AND POWER EXERCISE - SECTION - D NCERT Exemplar Solutions (Long Answer Type Questions)
5 Videos
- WORK, ENERGY AND POWER BOOK - KUMAR PRAKASHANCHAPTER - WORK, ENERGY AND POWER EXERCISE - SECTION - E Multiple Choice Questions (MCQs)
64 Videos
- WORK, ENERGY AND POWER BOOK - KUMAR PRAKASHANCHAPTER - WORK, ENERGY AND POWER EXERCISE - SECTION - D NCERT Exemplar Solutions (Very Short Answer Type Questions)
12 Videos
- WAVESBOOK - KUMAR PRAKASHANCHAPTER - WAVESEXERCISE - SECTION-F (Questions From Module) (Sample questions for preparation of competitive exams)
23 Videos
Similar Questions
A block of mass 1 kg is pushed up a surface inclined to horizontal at an angle of 30∘ by a force of 10 N parallel to the inclined surface (figure) . The coefficient of friction between block and the incline is 0.1 .If the block is pushed up by 10 m along teh inclined calculate

(a) work done against gravity
(b) work done against force of friction
(c ) increases in potential energy
(d) increases in kinetic energy
(e) work done by applied force
View SolutionThe potential energy of 1 kg particle , free to move allong is given by U(x)=(x33−x22)I. if its mechanical energy is 2J . Its maximum speed is …… ms−1
View SolutionA through inclined is placed on car moving with a constant velocity u on horizontal ground . A block of mass M rests on the inclined plane . Is any work done by force of friction then a dissipation of energy ?
View SolutionIn a standing wave formed by two atoms separated by 1.21Å, there are 3 nodes and 2 antinodes. Find its wavelength.
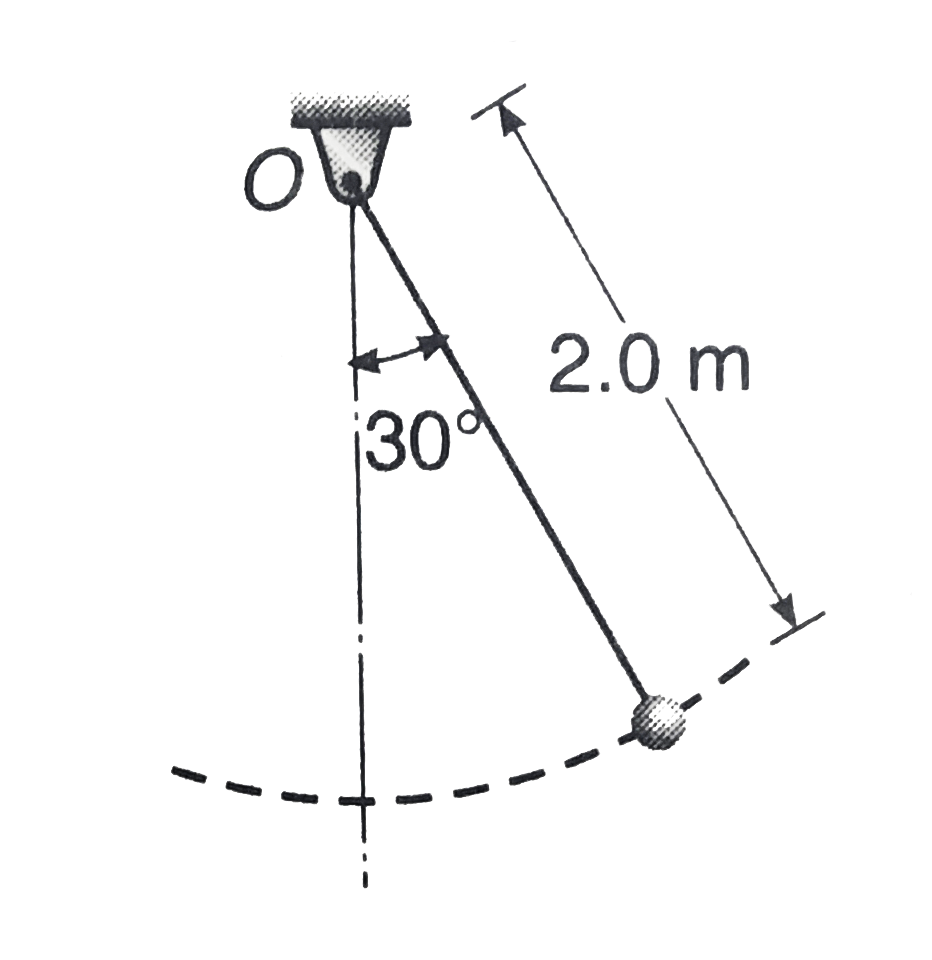
View SolutionThe bob of the pendulum shown in figure describes an are of in a vertical plane. If the tension in the cord is 2.5 times the weight of the bob for the position shown. Find the velocity and the acceleration of the bob in that position.
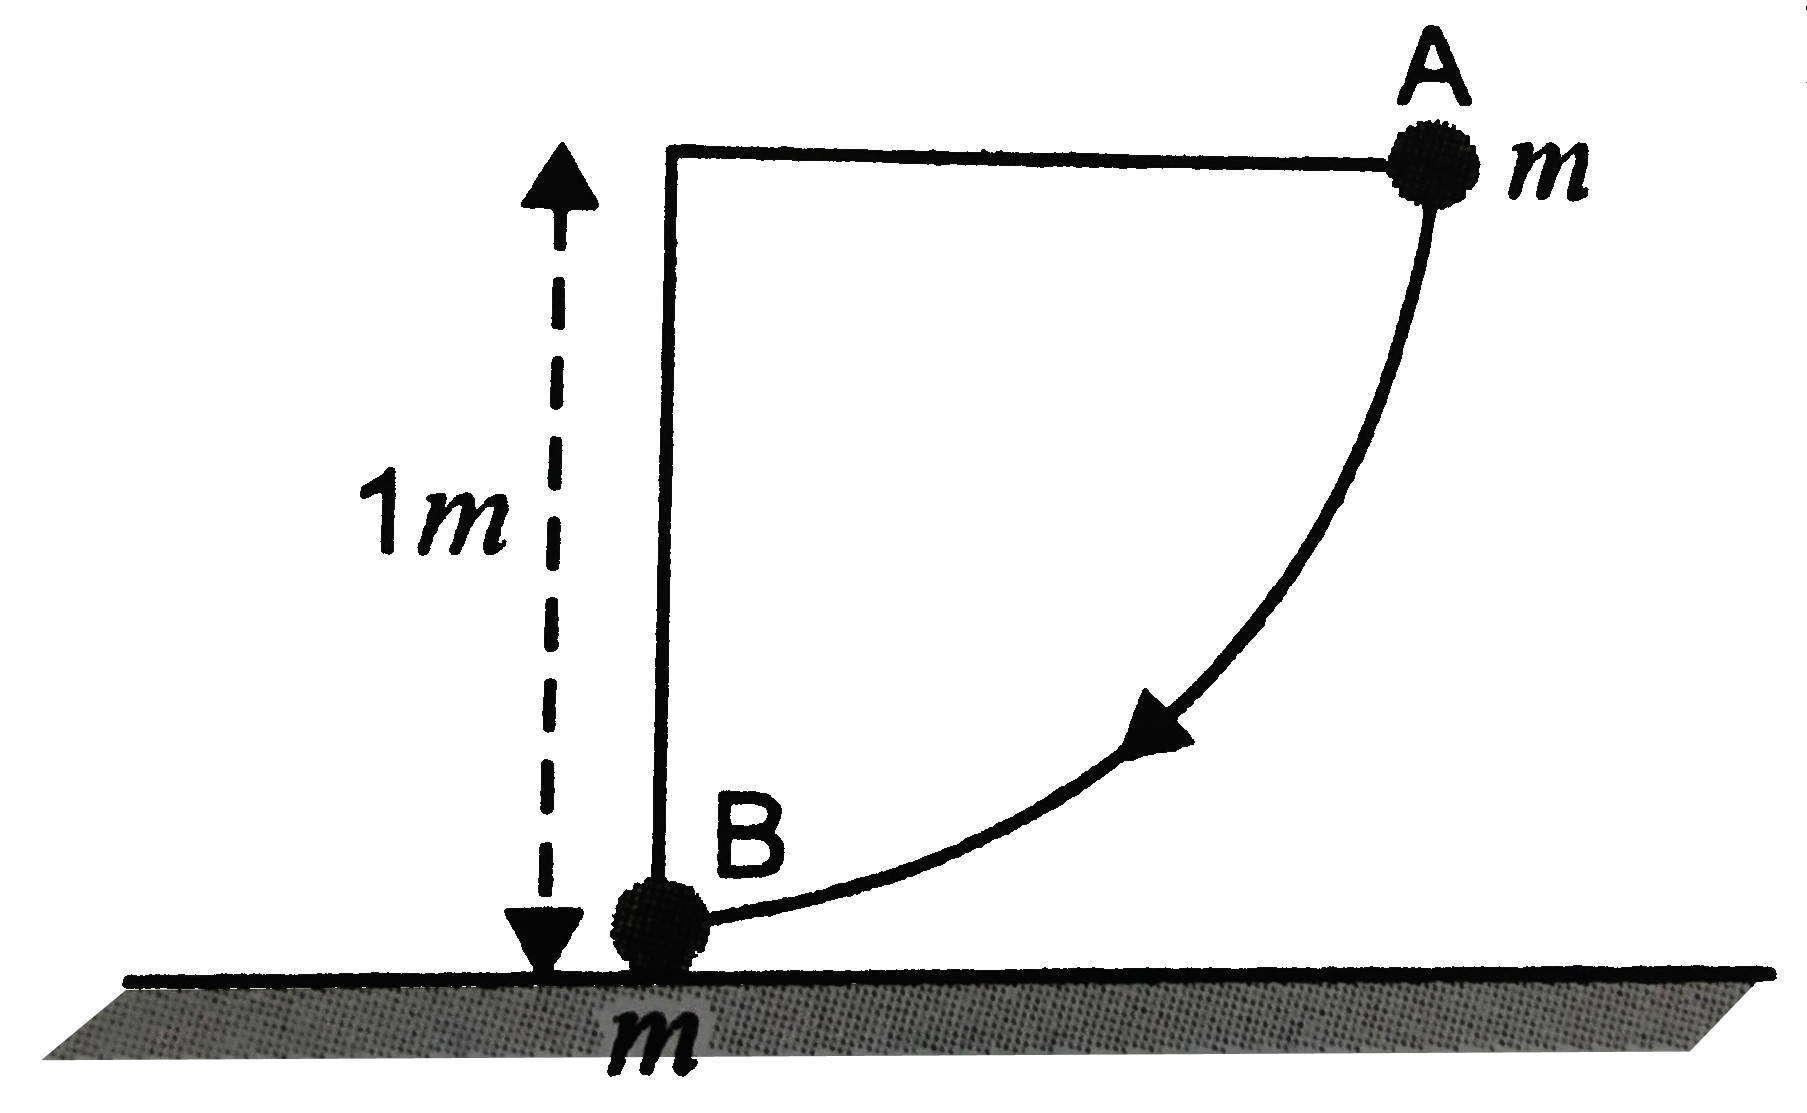
View SolutionThe bob A of a pendulum released from horizontal to the vertical hits another bob B of the same mass at rest on a table as shown in figure.
If the length of the pendulum is 1m, calculate
(a) the height to which bob A will rise after collision.
(b) the speed with which bob B starts moving.
Neglect the size of the bobs and assume the collision to be elastic.
View SolutionTwo pendulums with identical bobs and lengths are suspended from a common support such that in rest position, the two bobs are in constact, . One of the bobs is released after being displaced by 10^(@) so that it collides elastically head - on with the other bob. (a) Describe the motion of two bobs. (b) Draw a graph showing variation in energy of either pendulum with time,for 0letle2T , where T is the period of each pendulum.
View SolutionThe bob A of a pendulum released from a height h hits head-on another bob B of the same mass of an identical pendulum initially at rest. What is the result of this collision? Assume the collisio to be elastic (see figure).
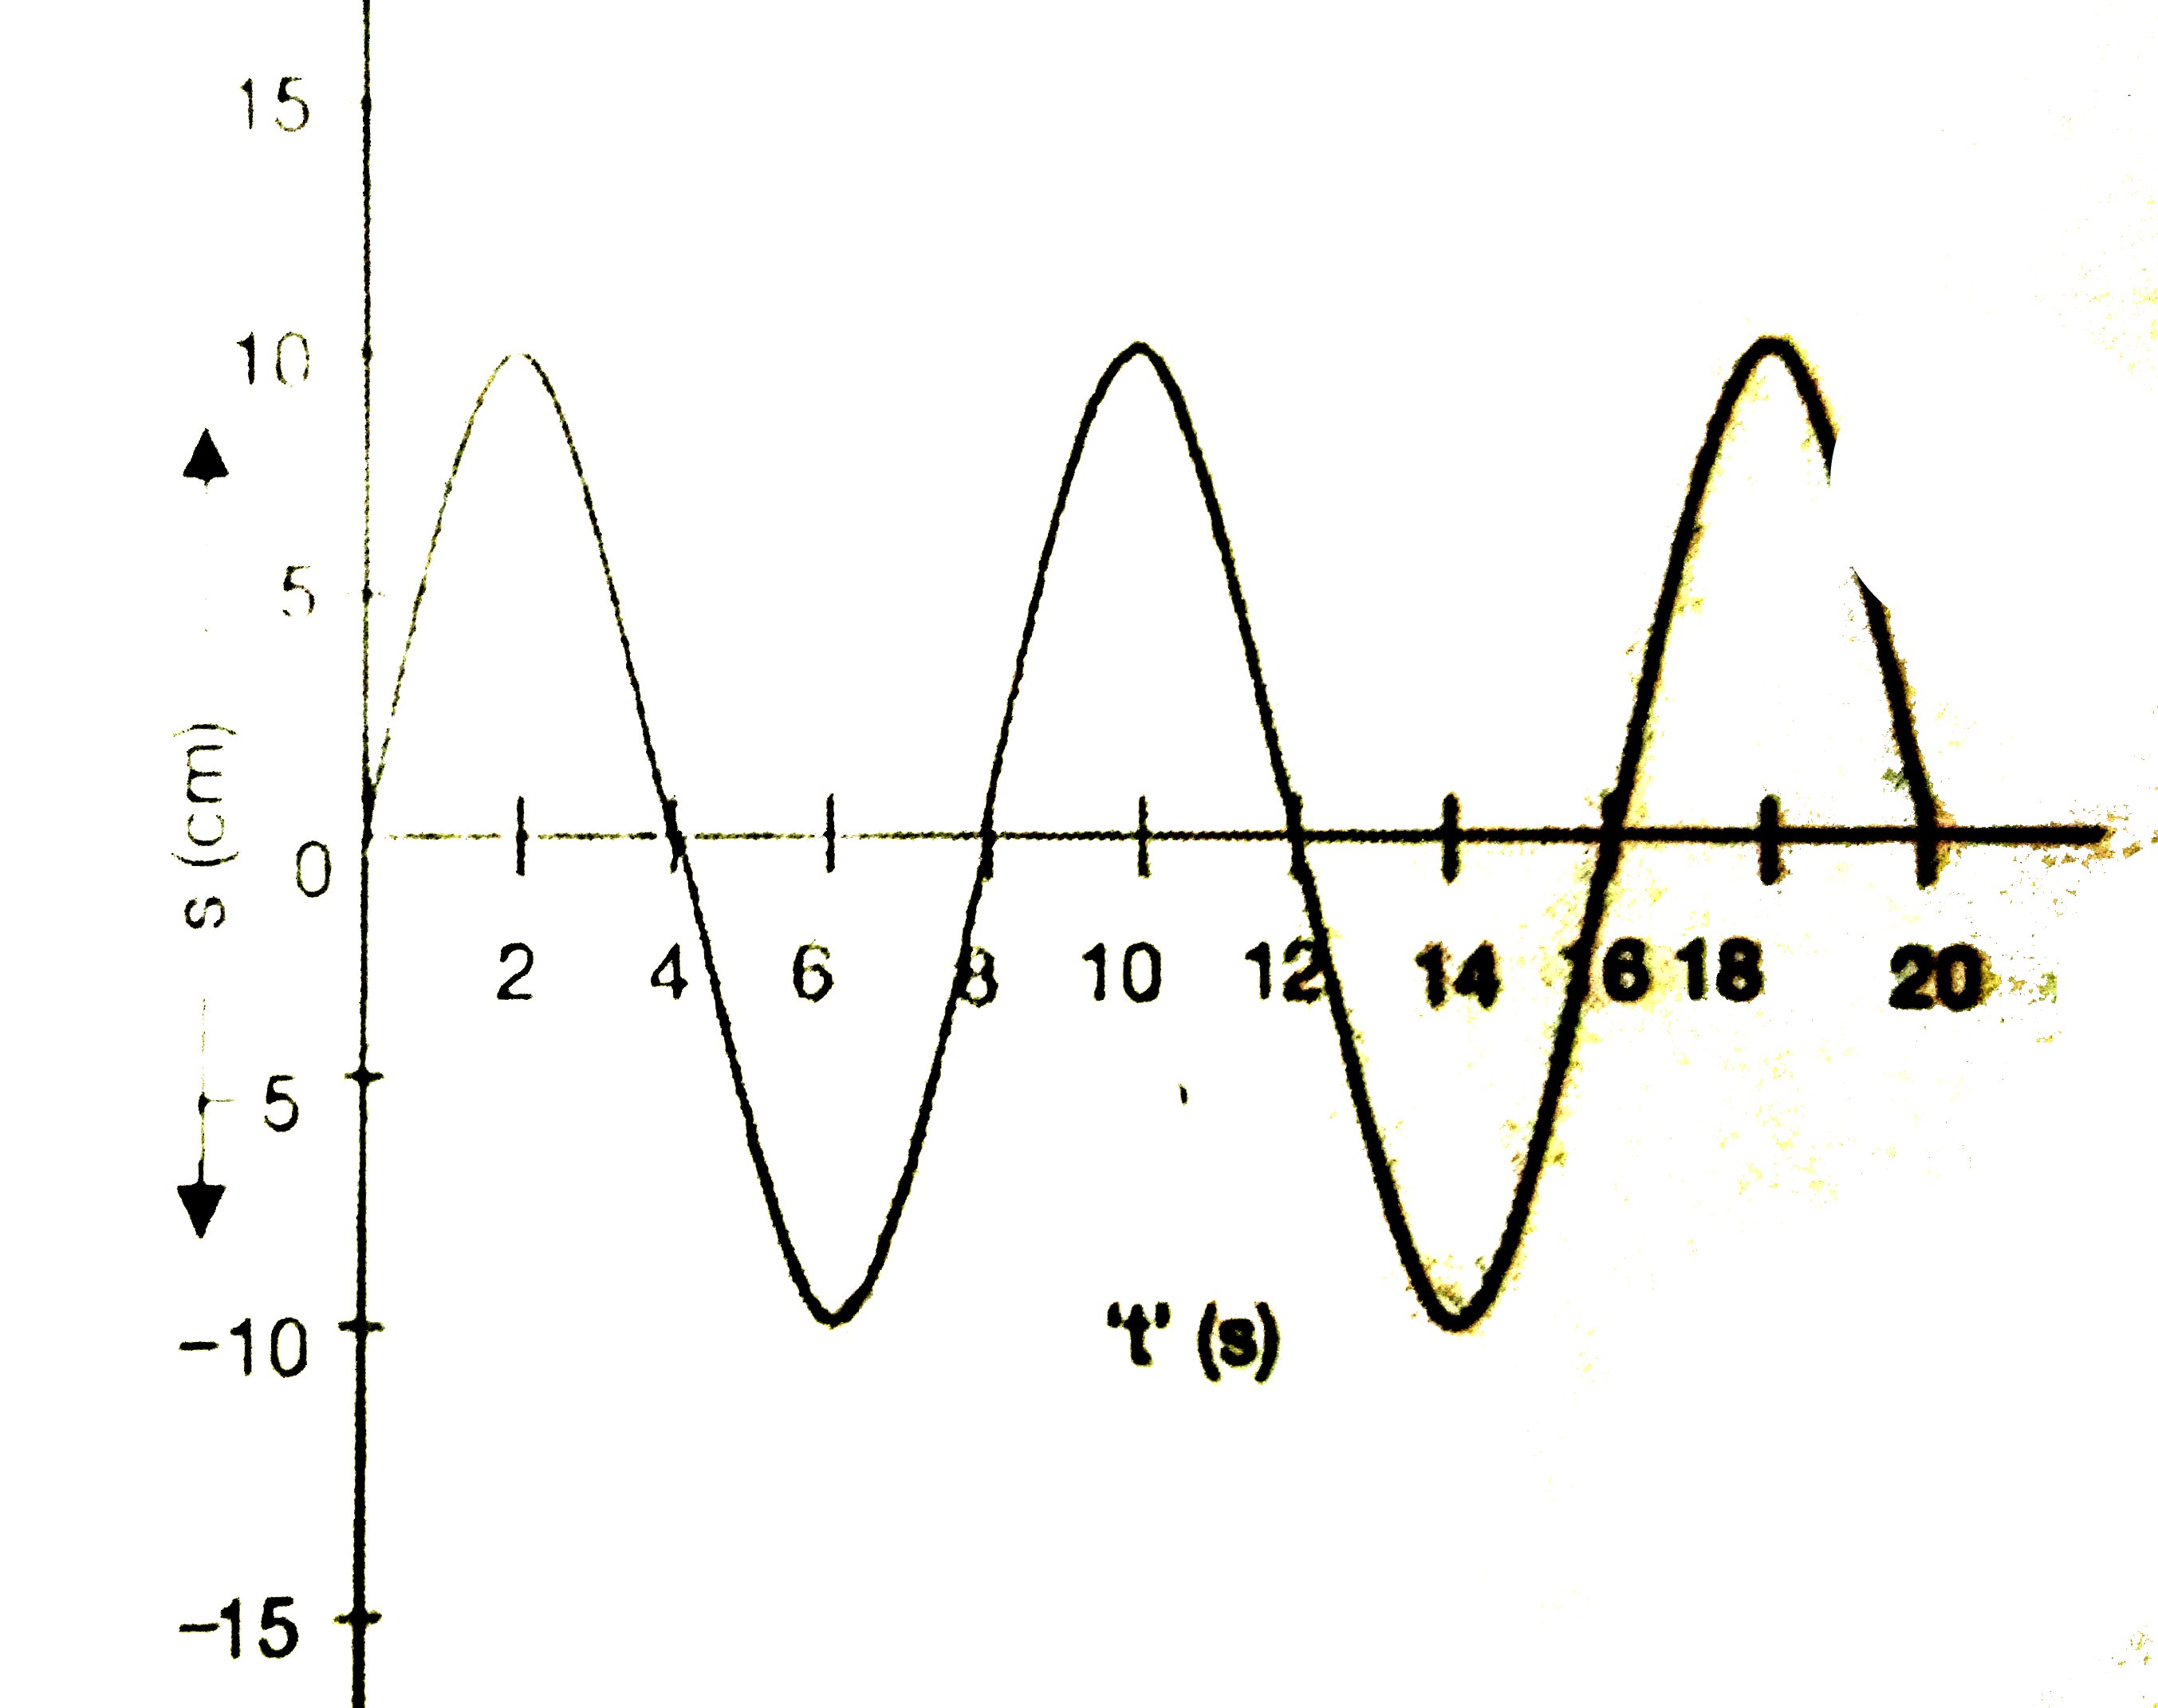
View SolutionThe following graph shows the displacement of the bob from its mean position versus time . The time period and the amplitude of the bob are :
View SolutionThe bob of a simple pendulum is made of wood. What will be the effect on the time period if the wooden bob is replaced by an identical bob of aluminium?
View SolutionThe bob of simple pendulum is hanging vertically down from a fixed identical bob by means of a string of length l. If both bobs are charged with a charge q each, time period of the pendulum is (ignore the radii of the bobs)
View SolutionThe bob A of a pendulum released from horizontal to the vertical hits another bob B of the same mass at rest on a table as shown in figure. If the length of the pendulum is 1m, calculate (a) the height to which bob A will rise after collision. (b) the speed with which bob B starts moving. Neglect the size of the bobs and assume the collision to be elastic.
View SolutionTwo pendulums with identical bobs and lengths are suspended from a common support such that in rest position, the two bobs are in constact, . One of the bobs is released after being displaced by 10∘ so that it collides elastically head - on with the other bob.
(a) Describe the motion of two bobs.
(b) Draw a graph showing variation in energy of either pendulum with time,for 0≤t≤2T , where T is the period of each pendulum.
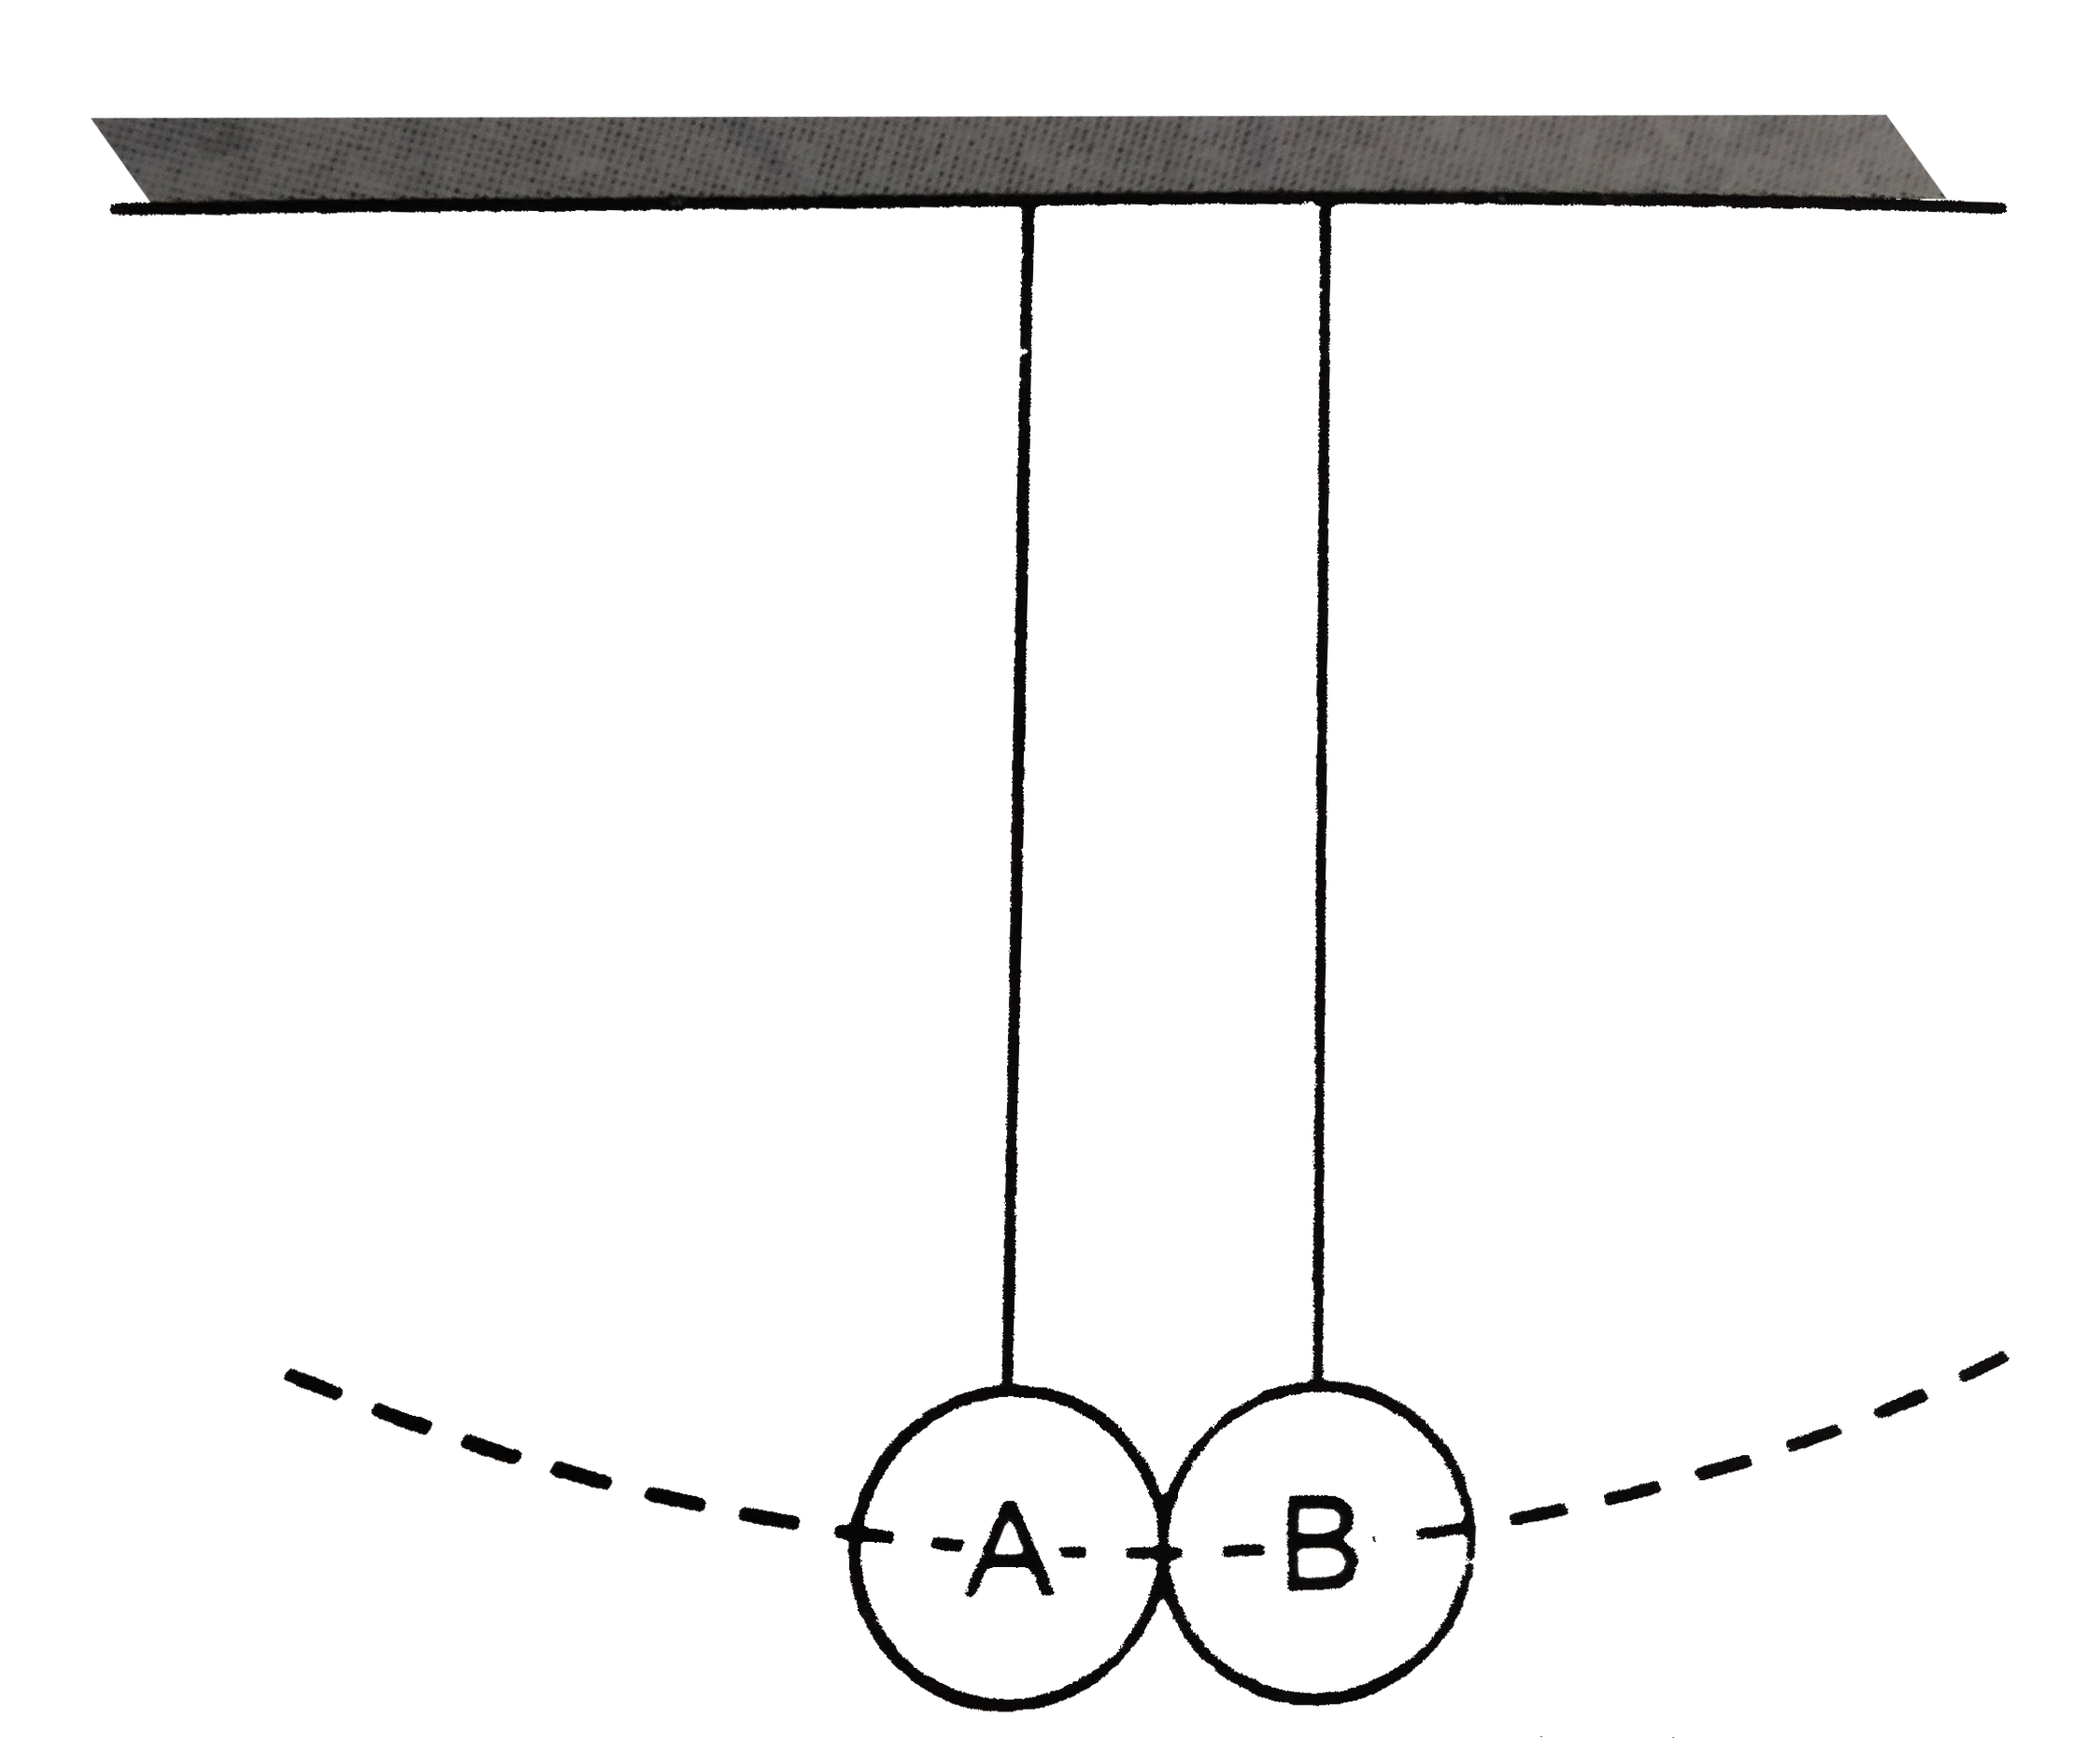
View SolutionThe bob A of a pendulum released from 30∘ to the vertical hits another bob B of the same mass at rest on a table as shown in figure . How high does the bob A rise after the collision ? Neglect the size of the bobs and assume the collision to be elastic .
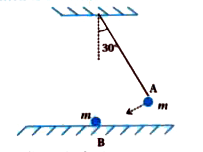
View SolutionThe bob A of a pendulum released from horizontal to the vertical hits another bob B of the same mass at rest on a table as shown in figure.
If the length of the pendulum is 1m, calculate
(a) the height to which bob A will rise after collision.
(b) the speed with which bob B starts moving.
Neglect the size of the bobs and assume the collision to be elastic.

View Solution