Two states – 1 and 2 – of an ideal gas has been shown in VT graph. In which state is the pressure of the gas higher?
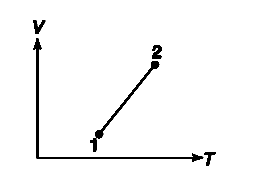
The correct Answer is:State 1
Step by step video, text & image solution for Two states – 1 and 2 – of an ideal gas has been shown in VT graph. In which state is the pressure of the gas higher? by Physics experts to help you in doubts & scoring excellent marks in Class 11 exams.
Updated on:21/07/2023Topper's Solved these Questions
- KINETIC THEORY OF GASESBOOK - ARIHANTCHAPTER - KINETIC THEORY OF GASESEXERCISE - Level 2
18 Videos
- KINETIC THEORY OF GASESBOOK - ARIHANTCHAPTER - KINETIC THEORY OF GASESEXERCISE - Level 3
4 Videos
- KINEMATICSBOOK - ARIHANTCHAPTER - KINEMATICSEXERCISE - Level 3
33 Videos
- MOMENTUM AND CENTRE OF MASSBOOK - ARIHANTCHAPTER - MOMENTUM AND CENTRE OF MASSEXERCISE - Momentum And Center of Mass
117 Videos
Similar Questions
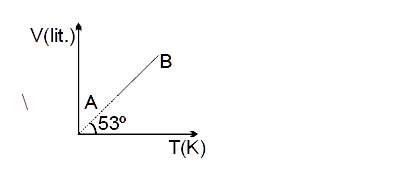
V-T curve for 2 moles of a gas is straight line as shown in the graph here. Find the pressure of gas at A.
View SolutionA diatomic ideal gas is taken through the cyclic process shown in the figure in state 1 the pressure of the gas is 100 kPa and its temperature is 350 K in state 2 the pressure is 300 kPa What is the efficiency of the cycle in percent rounded to nearest integer[Takeln3=12/11]
View Solution
Knowledge Check
Equation of state of an ideal gas is
ApV=RT/nBpV=nRTCpn=VRTDpT=nRVgraph of an ideal gas is as shown in figure.
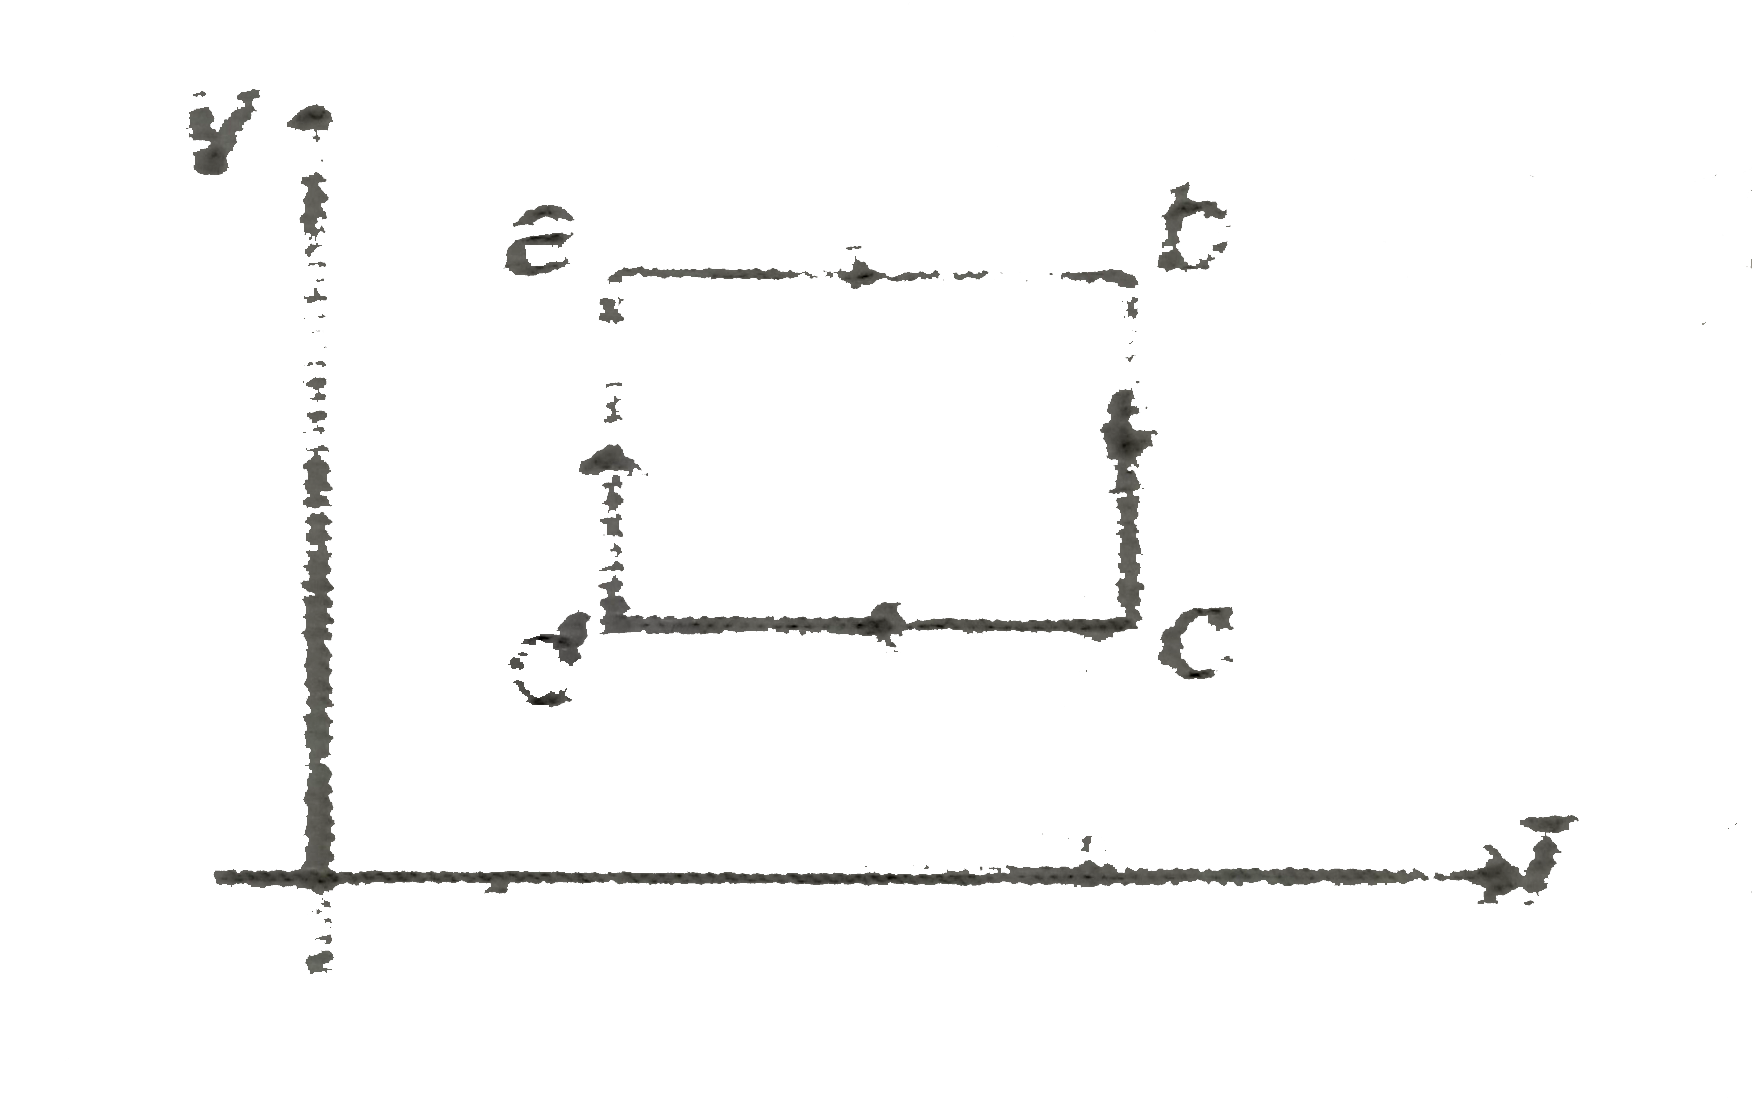
Heat is supplied to the gas in process (s).Ada, ab and bcBda and abCda onlyDab and bcA sample of ideal gas is taken through the cyclic process shown in the figure. The temerauture of the gas in state A is TA =200 K. In states B and C the temperature of the gas is the same.

What is the greastes temperature of the gas during the cyclic process ?A600 KB1200 KC2400 KDNone of these
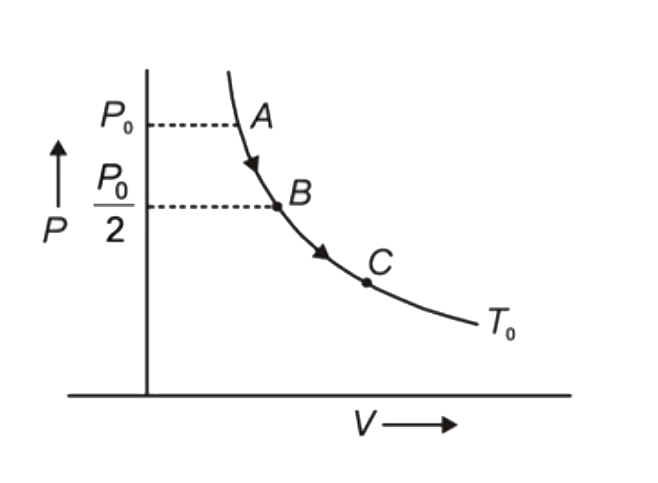
The state of an ideal gas changed as shown, at constant temperature T0 If heat supplied to the gas in process B→C is thrice of work done by gas in A→B , then the pressure of gas in state C is P02n . Find the value of n.
View Solution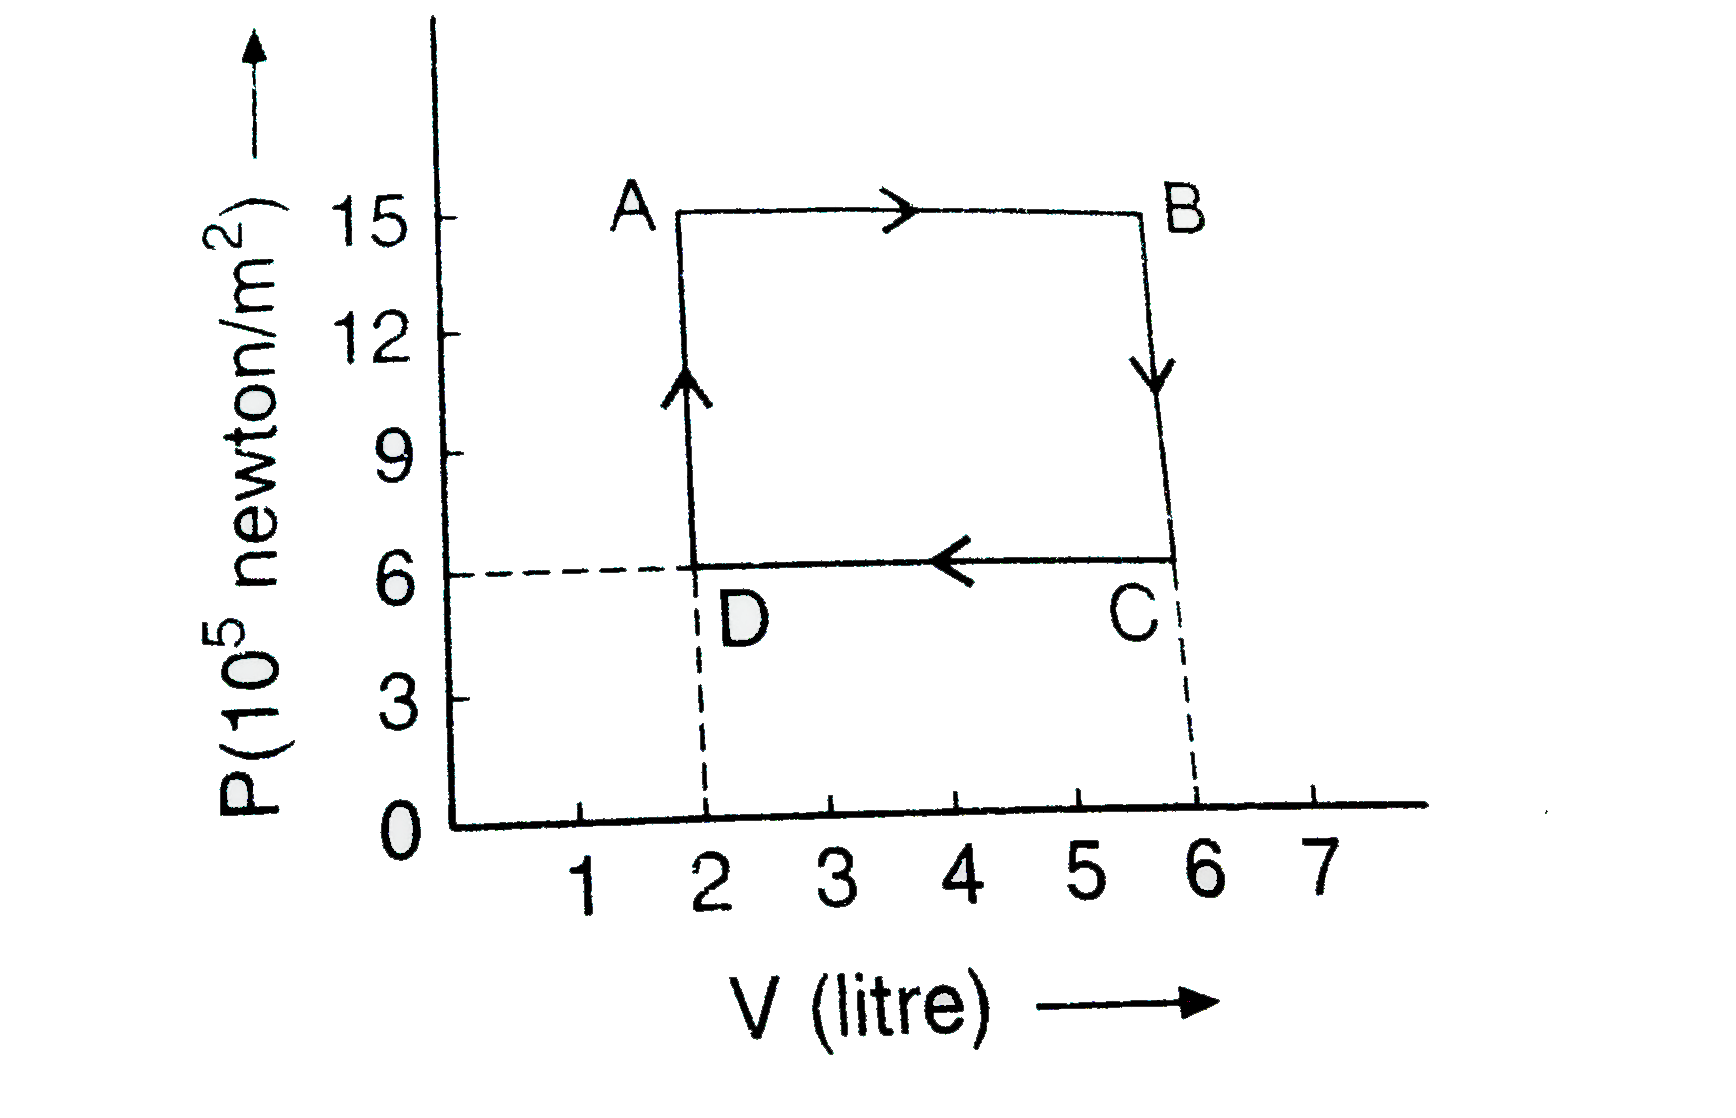
In the adjoining diagram, the p-V graph of an ideal gas is shown. Find out from the graph (i) work done in taking the gas
From the state A→B (ii) Work done in taking the gas from B→C (iii) Work done in a complete cycle. (1 litre=10−3m3)
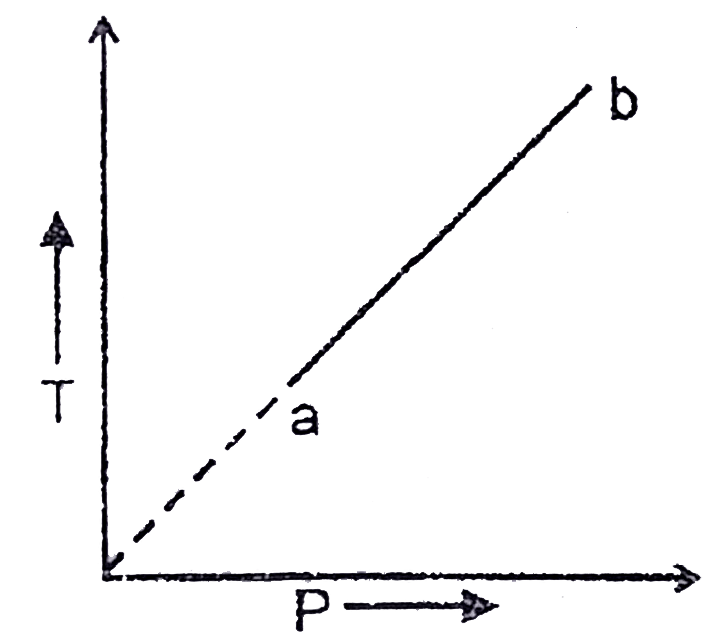
View SolutionAn ideal gas change from state a to state b as shown in Fig. what is the work done by the gas in the process?
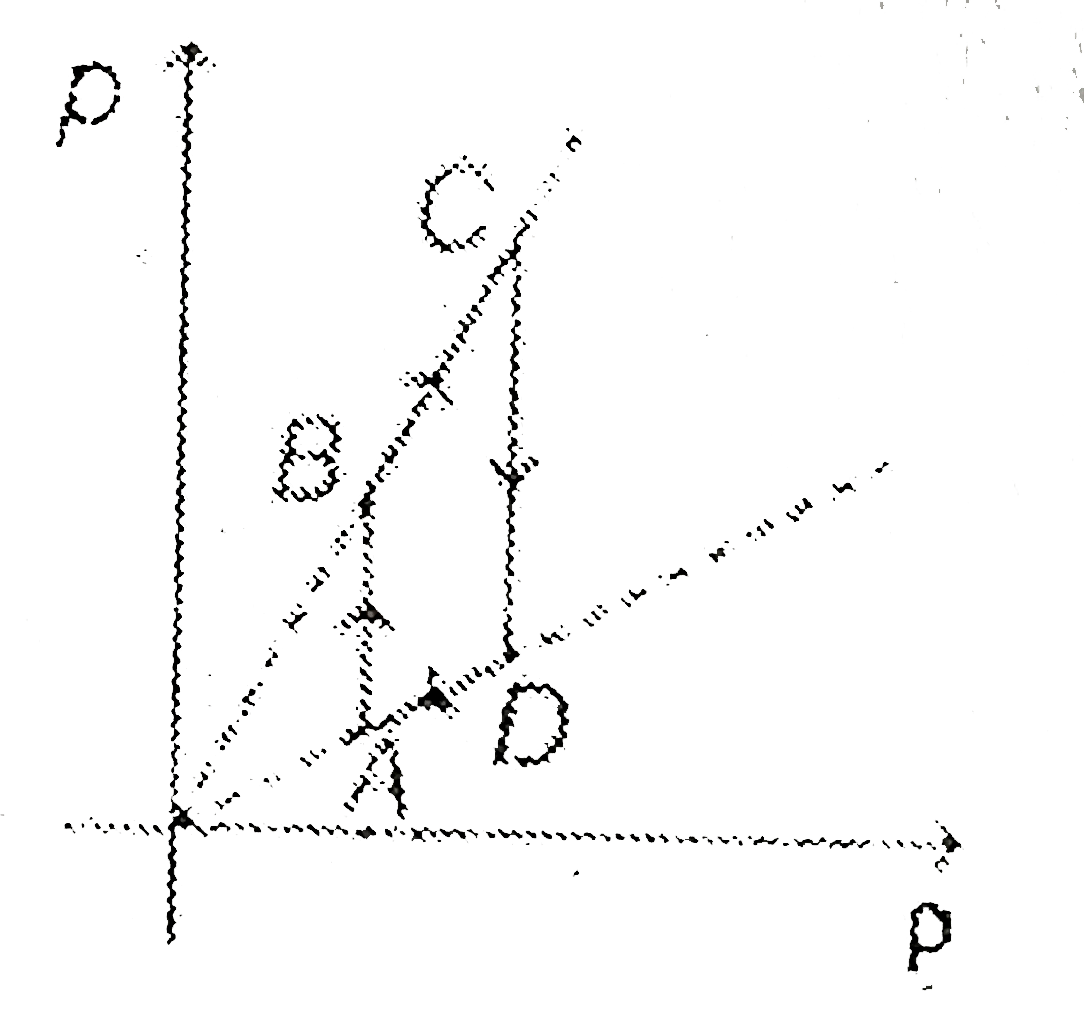
View SolutionPressure versus density graph of an ideal gas is shown in figure
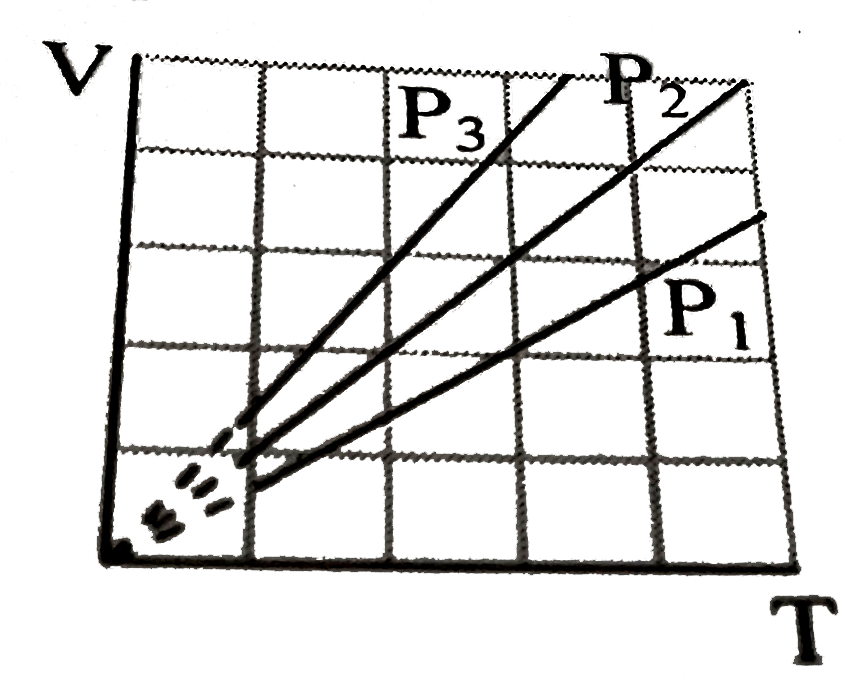
View SolutionThe state of an ideal gas was changed isobarically. The graph depicts three such isobaric lines. Which of the following is true about the pressures of the gas ?
View Solution
