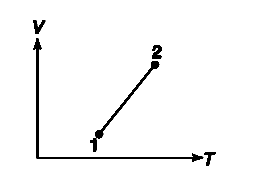
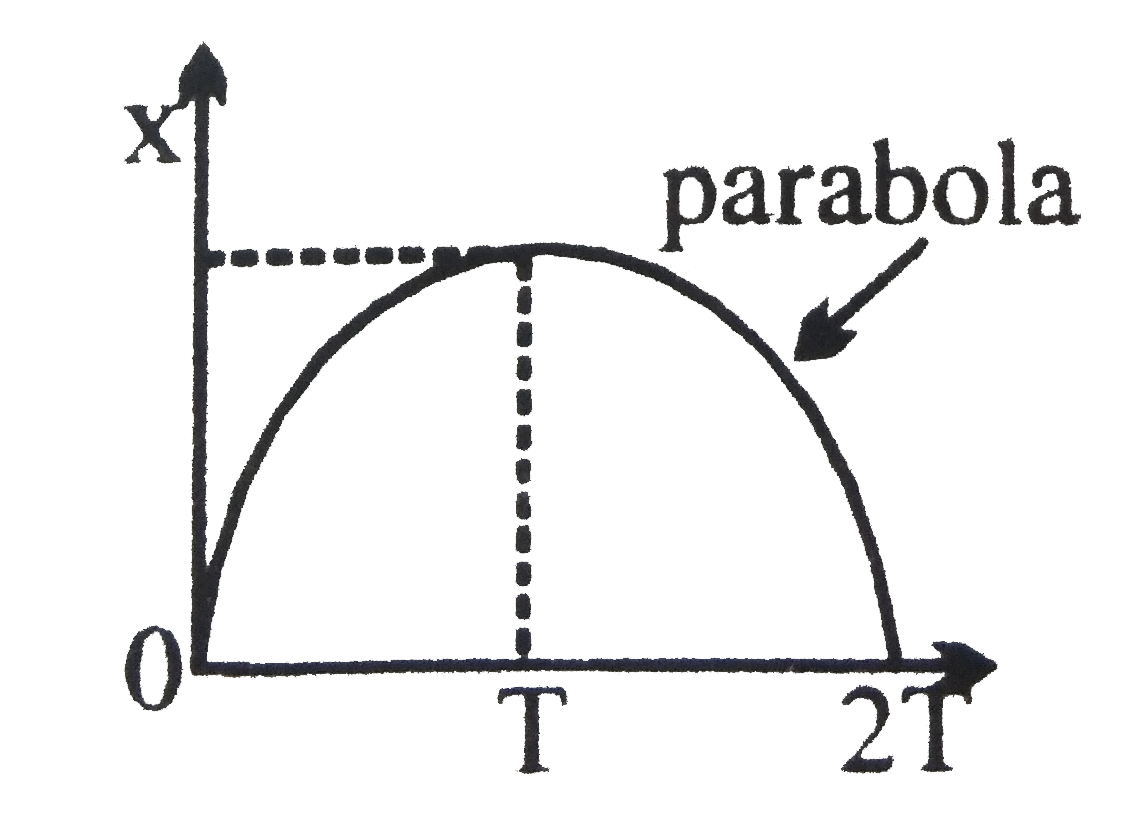
V-T curve for 2 moles of a gas is straight line as shown in the graph here. Find the pressure of gas at A.

The correct Answer is:1.25×10⁴N/m2
Step by step video & image solution for V-T curve for 2 moles of a gas is straight line as shown in the graph here. Find the pressure of gas at A. by Physics experts to help you in doubts & scoring excellent marks in Class 12 exams.
Updated on:21/07/2023Topper's Solved these Questions
- HEAT-2 BOOK - MOTIONCHAPTER - HEAT-2 EXERCISE - EXERCISE-4 (LEVEL-I)
34 Videos
- HEAT-2 BOOK - MOTIONCHAPTER - HEAT-2 EXERCISE - EXERCISE-4 (LEVEL-II)
30 Videos
- HEAT-2 BOOK - MOTIONCHAPTER - HEAT-2 EXERCISE - EXERCISE-3 (LEVEL-I)
22 Videos
- HEAT TRANSFER & THERMAL EXPANSION BOOK - MOTIONCHAPTER - HEAT TRANSFER & THERMAL EXPANSION EXERCISE - Exercise - 3 Section-B
19 Videos
- HYDROSTATIC, FLUID MECHANICS & VISCOSITYBOOK - MOTIONCHAPTER - HYDROSTATIC, FLUID MECHANICS & VISCOSITYEXERCISE - EXERCISE -3 (SECTION-B) PREVIOUS YEAR PROBLEM
7 Videos
Similar Questions
Knowledge Check
V−T diagram for a process of given mass of ideal gas is as shown in fig. During the process pressure of the gas
_E01_072_Q01.png) AFirst increases then decreasesBFirst decreases then increasesCcontinously decreasesDcontinously increases
AFirst increases then decreasesBFirst decreases then increasesCcontinously decreasesDcontinously increasesAt a constant pressure P, the plot of volume (V) as a function of temperature (T) for 2 moles of an ideal gas gives a straight line with a slope 0.328 L K−1. The value of P (in atm) is closest to [Gas constant, R = 0.0821 L atm mol−1 K−1]
A0.25B0.5C1.0D2.0Which graph is not a straight line for an ideal gas ?
AP us 1V (at constant T and n)BPV us V2 (at constant T and n)CP us T2 (at constant V and n)Dlog P us log (V2) (at constant T and n)
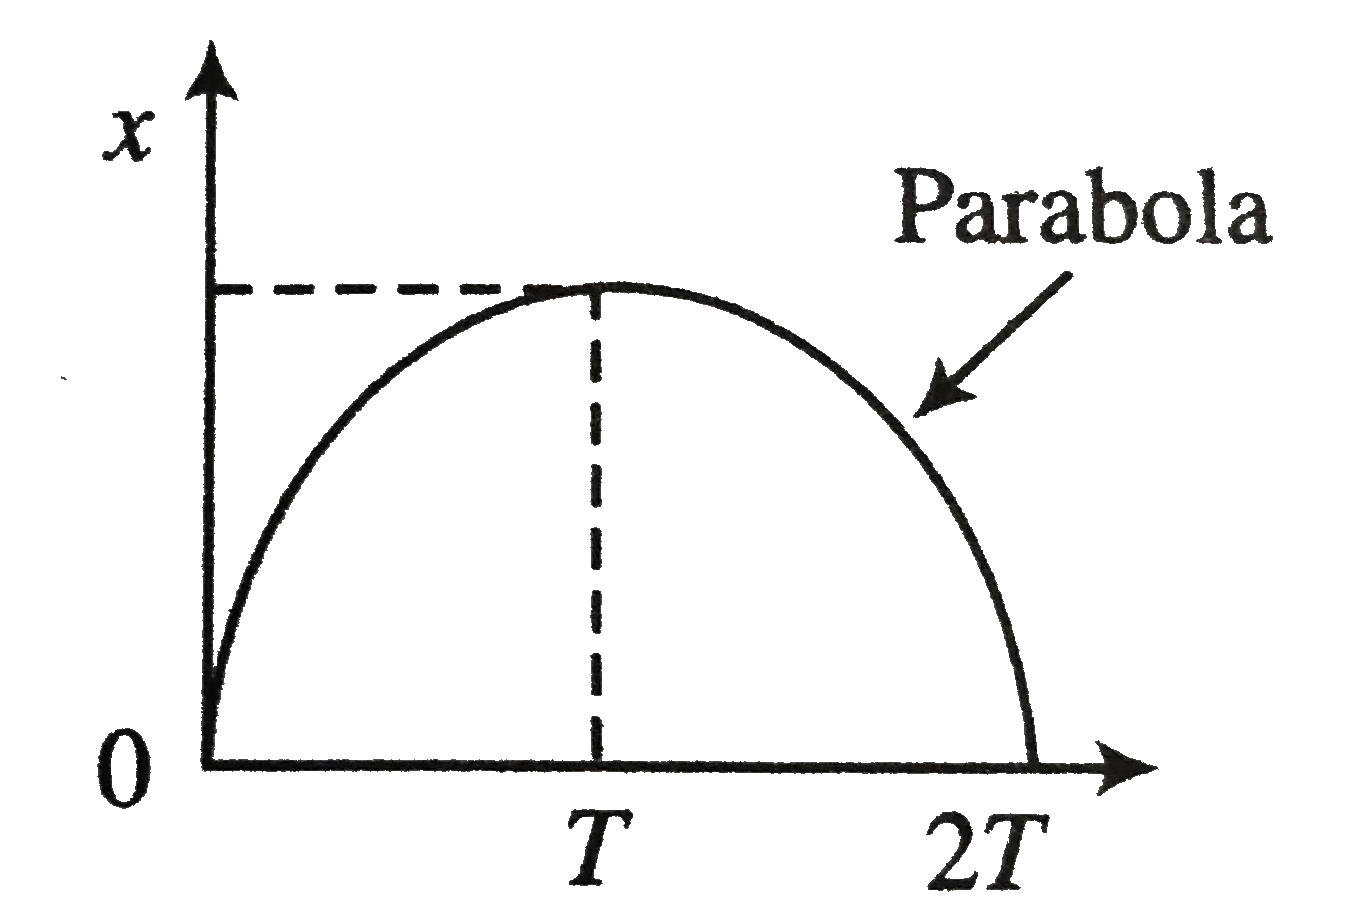
The x-t graph of a particle moving along a straight line is shown in figure

The v-t graph of the particle is correctly shown by
View SolutionThe velocity -time (v−t) graph of a particle moving in a straight line is shown in figure. The acceleration of the particle at t=9 is:
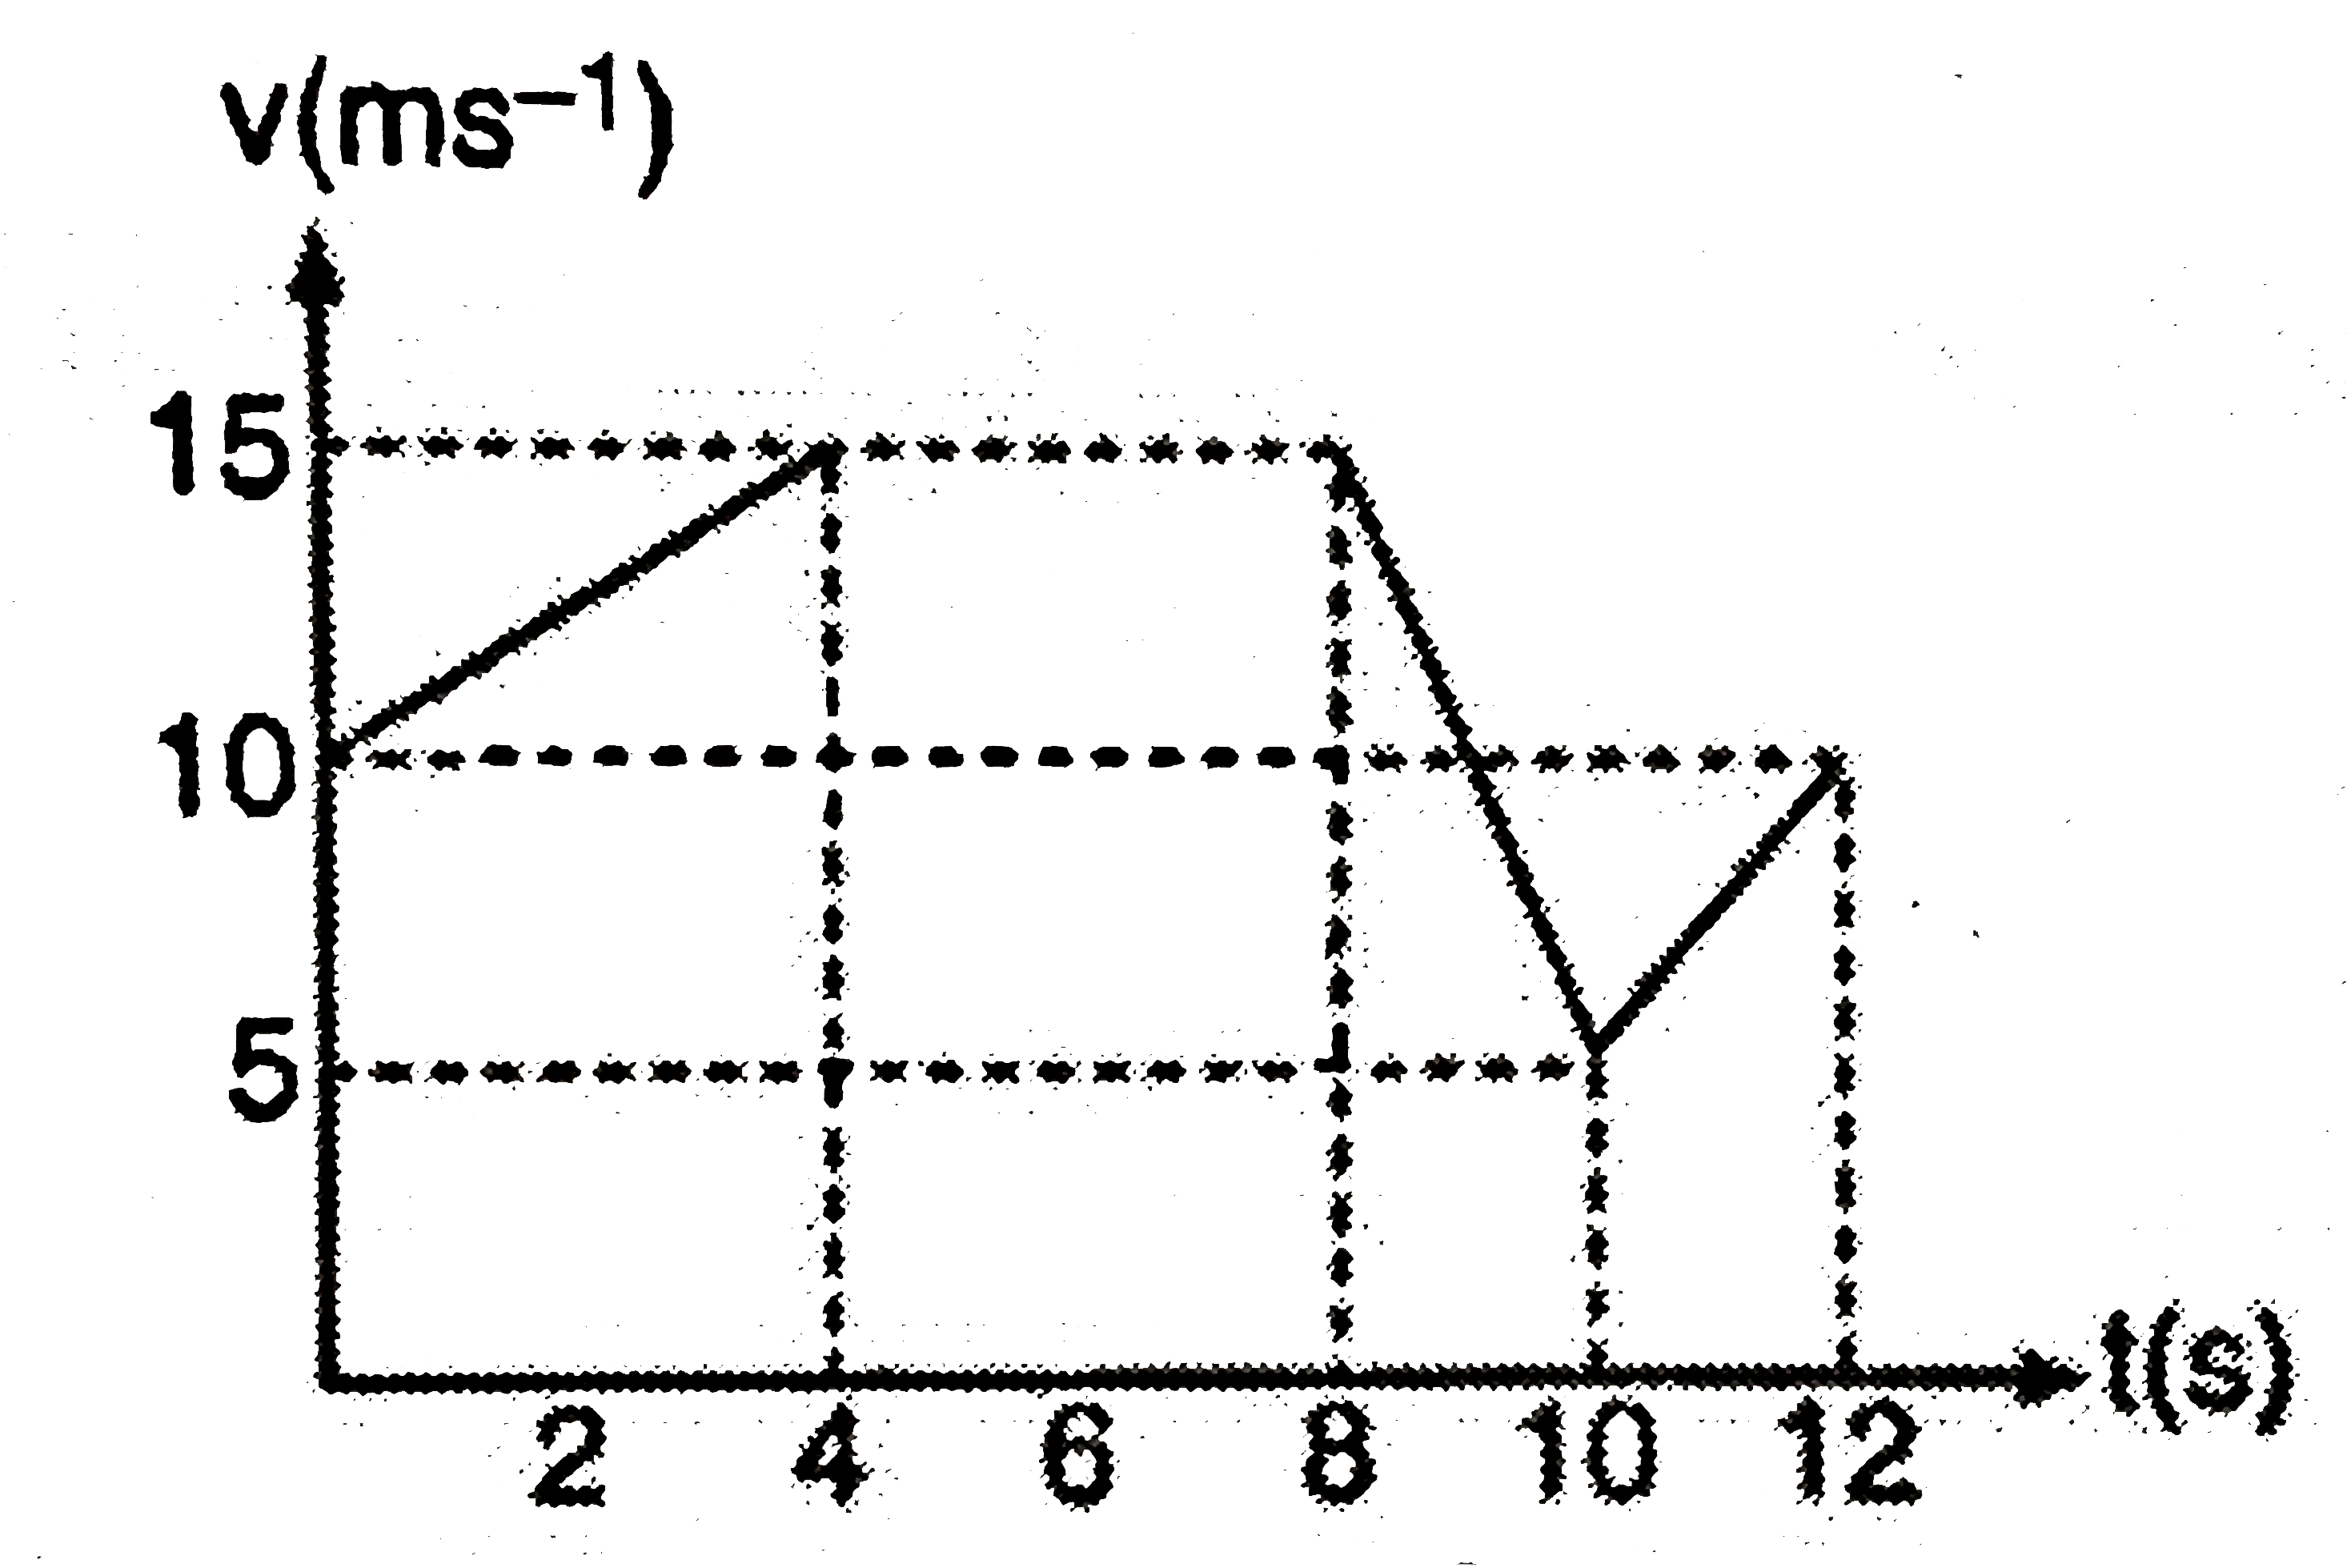
View SolutionThe x−t graph of particle moving along a straight line is shown in figure
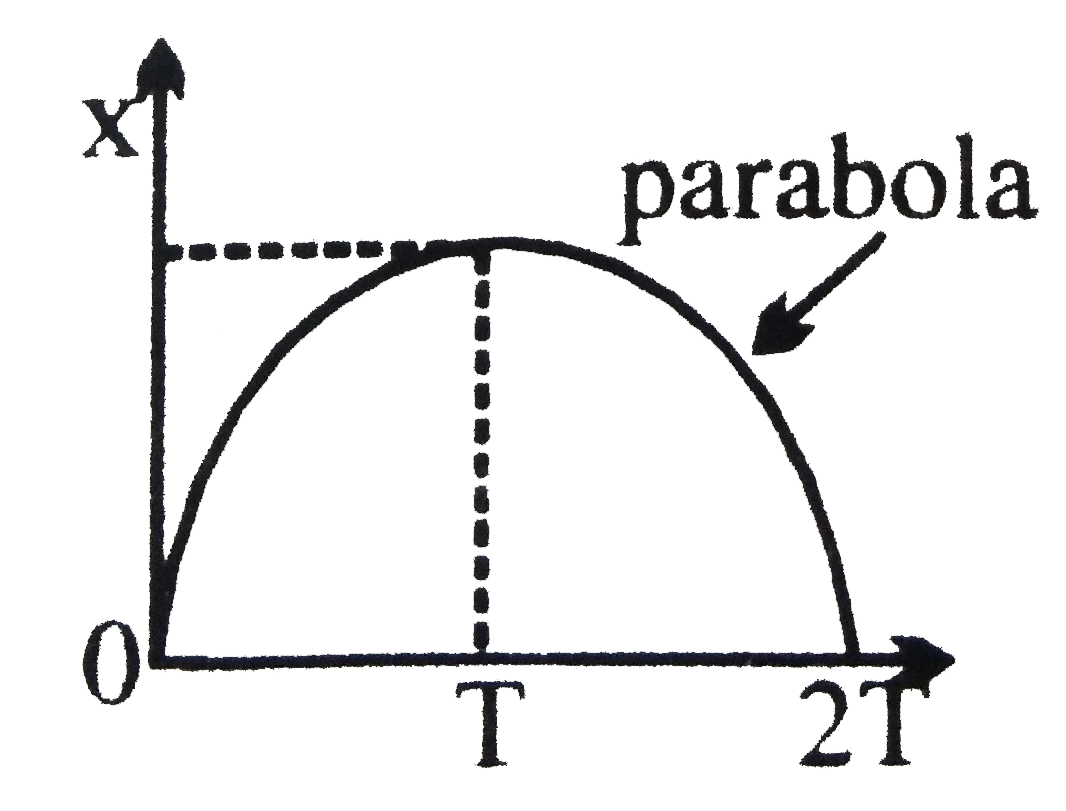
The a−t graph of the particle is correctly shown by
View SolutionThe x-t graph of a particle moving along a straight line is shown in figure
The a-t graph of the particle is correctly shown by
View SolutionIn a process V∝T2, temperature of 2 moles of a gas is increased by 200K. Work done by the gas in this process will be
View Solution

