Two students perform experiments on two given resistors R1 and R2 and plot the following V-I graphs. If R1>R2 which of the two diagrams correctly represent the situation on the plotted curves? Justify your answer.
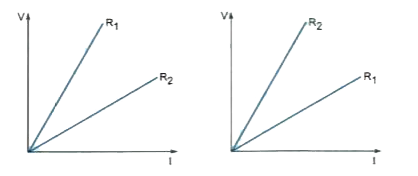
As R1>R2
Therefore, figure (a) is correct. This is because R1 is greater so the slope of V-I graph is greater in figure (a) and is correctly represented as R1.
Topper's Solved these Questions
- ELECTRICITYBOOK - VK GLOBAL PUBLICATIONCHAPTER - ELECTRICITYEXERCISE - SOME IMPORTANT NUMERICALS
12 Videos
- ELECTRICITYBOOK - VK GLOBAL PUBLICATIONCHAPTER - ELECTRICITYEXERCISE - NUMERICALS (RESISTANCE AND RESISTIVITY)
23 Videos
- LIGHT-REFLECTION AND REFRACTIONBOOK - VK GLOBAL PUBLICATIONCHAPTER - LIGHT-REFLECTION AND REFRACTIONEXERCISE - PROFICIENCY EXERCISE (Long Answer Questions)
5 Videos
Similar Questions
Two students perform the experiment on series and parallel combinations of two given resistors R1 and R2 and plot the following V-I graphs (a) and (b).
Which of the graphs is (are) correctly labelled in terms of the words 'series' and 'parallel'? Justify your answer.
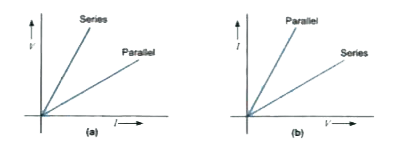
View SolutionTwo students perform experiments on series and parallel combinations of two given resistors R1andR2 and plot the following V -1 graphs [Fig. 5.24.]. Which of the graphs is/are correctly labeled in terms of the words 'series' and 'parallel'? Justify your answer.
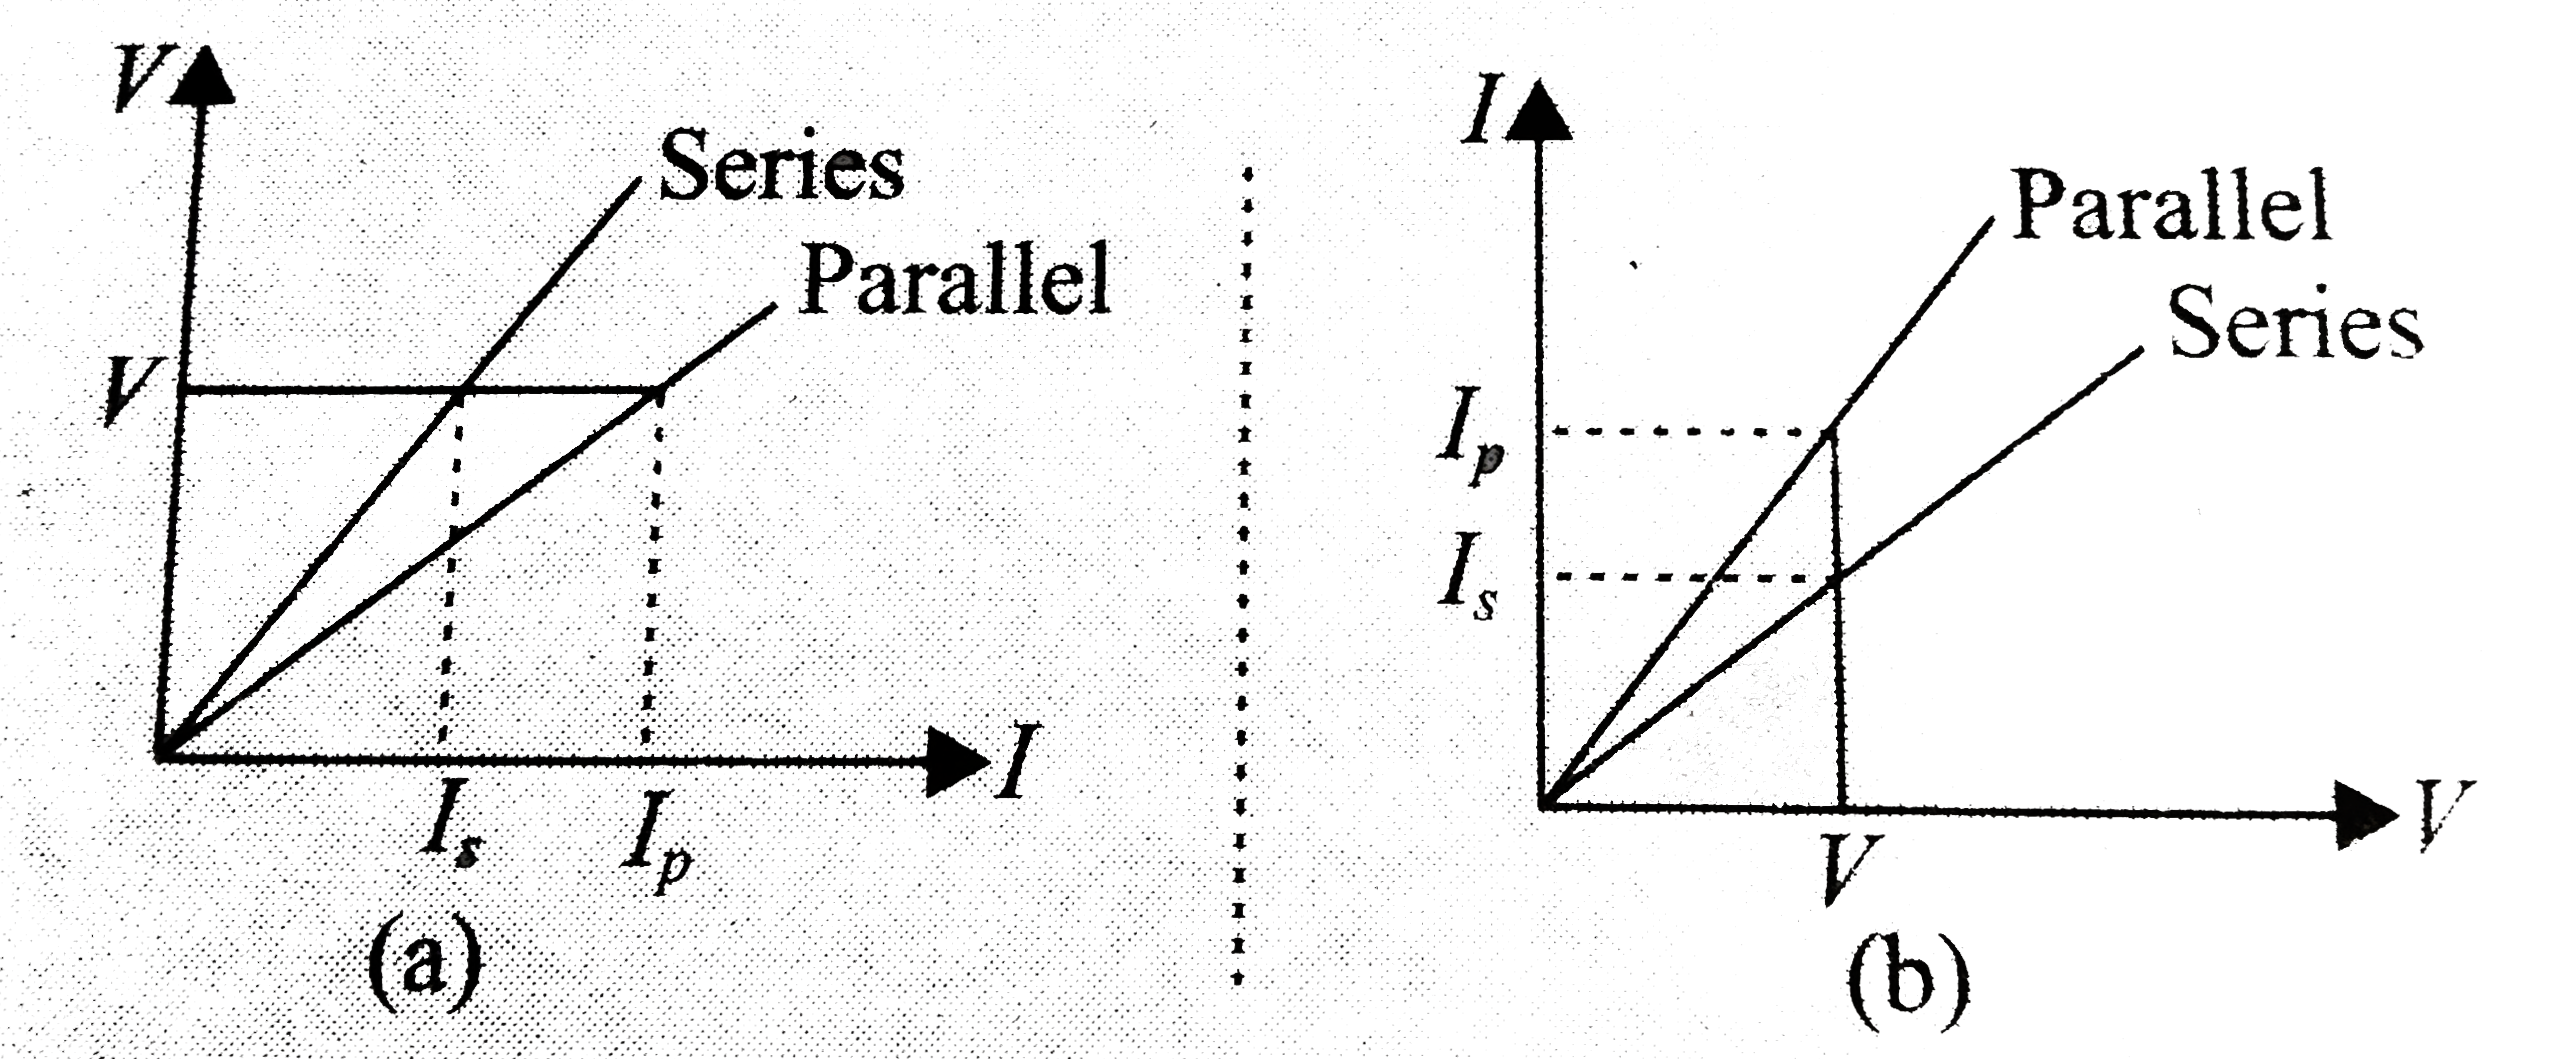
View Solution
Knowledge Check
Two students perform experiments on two given resistors R1andR2 and plot the following V-I graphs. If R1>R2, which of the diagrams correctly represent the situation on the plotted curves?
A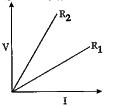 B
B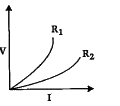 C
C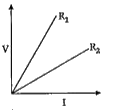 D
D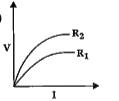
For students performed experiments on series and parallel combination of two given resistors R1and R2 which obey Ohm's law and plotted the following V-I graphs :

Which of the graphs is correctly labelled in terms of 'series' and 'parallel' ?Agraph ABgraph BCgraph CDgraph DTwo Cu wires of radii R1 and R2 are such that (R1>R2) . Then which of the following is true ?
ATransverse wave travels faster in thicker wireBTransverse wave travels faster in thinner wireCTravels with the same speed in both the wiresDDoes not travel
Two students perform experiments on series and parallel combinations of two given resistors R1andR1 and plot the following V -1 graphs [Fig. 5.24.]. Which of the graphs is/are correctly labeled in terms of the words 'series' and 'parallel'? Justify your answer.

View SolutionIn an experiment to find the equivalent resistance of a series combination of two resistors R1 and R2,a student uses the circuit shown here. Will the circuit give the correct reading for current I and voltage V ? Justify your answer.
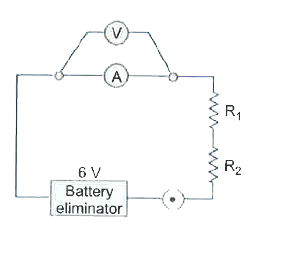
View SolutionTwo resistors of resistance R1 and R2 having R1>R2 are connected in parallel. For equivalent resistance R, the correct statement is
View SolutionConsider two resistors R1 and R2 in series. The current flowing through R1 and R2 is
View SolutionTwo resistors of resistance R1 and R2 having R1>R2 are connected in parallel. For equivalent resistance R, the correct statement is
View Solution
