Using Einstein's photoelectric equation show how the cut -off voltage and threshold frequency for a given photosenstive material can be determined with the help of a suitable plot/graph.
To determine the cut-off voltage and threshold frequency for a given photosensitive material using Einstein's photoelectric equation, we can follow these steps:
Step 1: Understand Einstein's Photoelectric Equation
Einstein's photoelectric equation is given by:
E⋅V0=hν−ϕ0
Where:
- E is the charge of an electron (approximately 1.6×10⁻¹⁹ coulombs),
- V0 is the stopping potential (cut-off voltage),
- h is Planck's constant (6.626×10⁻³⁴Js),
- ν is the frequency of the incident radiation,
- ϕ0 is the work function of the material.
Step 2: Rearranging the Equation
Rearranging the equation to express V0 in terms of ν:
V0=hEν−ϕ0E
This equation is in the form of a straight line y=mx+c, where:
- y corresponds to V0,
- x corresponds to ν,
- m (slope) is hE,
- c (y-intercept) is −ϕ0E.
Step 3: Plotting the Graph
1. X-axis: Frequency ν
2. Y-axis: Stopping potential V0
Plot the line using the equation derived. The line will have a slope of hE and will intersect the y-axis at −ϕ0E.
Step 4: Identifying the Threshold Frequency
The threshold frequency ν0 can be identified as the frequency at which the stopping potential V0 becomes zero. This occurs when:
hν0=ϕ0
From the rearranged equation, if V0=0:
0=hEν0−ϕ0E
Thus,
ν0=ϕ0h
This frequency is the point on the x-axis where the line intersects the x-axis.
Step 5: Determining the Cut-off Voltage
The cut-off voltage V0 can be determined for any frequency ν greater than the threshold frequency ν0 by substituting the frequency into the rearranged equation:
V0=hEν−ϕ0E
This gives the stopping potential corresponding to that frequency.
Conclusion
By plotting V0 against ν, we can visually determine both the threshold frequency (where the line intersects the x-axis) and the cut-off voltage (the y-values corresponding to various frequencies).
---
Einstein's photoelectric equation is given by:
E⋅V0=hν−ϕ0
Where:
- E is the charge of an electron (approximately 1.6×10⁻¹⁹ coulombs),
- V0 is the stopping potential (cut-off voltage),
- h is Planck's constant (6.626×10⁻³⁴Js),
- ν is the frequency of the incident radiation,
- ϕ0 is the work function of the material.
Rearranging the equation to express V0 in terms of ν:
V0=hEν−ϕ0E
This equation is in the form of a straight line y=mx+c, where:
- y corresponds to V0,
- x corresponds to ν,
- m (slope) is hE,
- c (y-intercept) is −ϕ0E.
1. X-axis: Frequency ν
2. Y-axis: Stopping potential V0
The threshold frequency ν0 can be identified as the frequency at which the stopping potential V0 becomes zero. This occurs when:
hν0=ϕ0
From the rearranged equation, if V0=0:
0=hEν0−ϕ0E
Thus,
ν0=ϕ0h
This frequency is the point on the x-axis where the line intersects the x-axis.
The cut-off voltage V0 can be determined for any frequency ν greater than the threshold frequency ν0 by substituting the frequency into the rearranged equation:
V0=hEν−ϕ0E
This gives the stopping potential corresponding to that frequency.
By plotting V0 against ν, we can visually determine both the threshold frequency (where the line intersects the x-axis) and the cut-off voltage (the y-values corresponding to various frequencies).
Topper's Solved these Questions
- DUAL NATURE OF RADIATION AND MATTERBOOK - PRADEEPCHAPTER - DUAL NATURE OF RADIATION AND MATTEREXERCISE - NCERT Exerciese question
1 Videos
- DUAL NATURE OF RADIATION AND MATTERBOOK - PRADEEPCHAPTER - DUAL NATURE OF RADIATION AND MATTEREXERCISE - Short answer
1 Videos
- CURRENT ELECTRICITYBOOK - PRADEEPCHAPTER - CURRENT ELECTRICITYEXERCISE - Problems for Practice (B)
2 Videos
- ELECTROMAGNETIC INDUCTION & ALTERNATING CURRENTBOOK - PRADEEPCHAPTER - ELECTROMAGNETIC INDUCTION & ALTERNATING CURRENTEXERCISE - Multiple Choice Questions
1 Videos
Similar Questions
(a) Write Einstein's photoelectric equation and mention which important features in photo-electric effect can be explained with the help of this equation.
(b) The maximum kinetic energy of the photoelectrons gets doubled when the wavelength of light incident on the surface changes from λ1 to λ2. Derive the expressions for the threshold wavelength λ0 and work function fo rthe metal surface.
View Solution(a) Write Einstein's photoelectric equation. State clearly how this equation is obtained using the photon picture of electromagnetic radiation.
(b) Write the three salient features observed in photoelectric effect which can be explained using this equation.
View Solution
Knowledge Check
For a photoelectric cell the graph showing the variation of cut of voltage (V) with frequency (v) of incident light is best represented by
A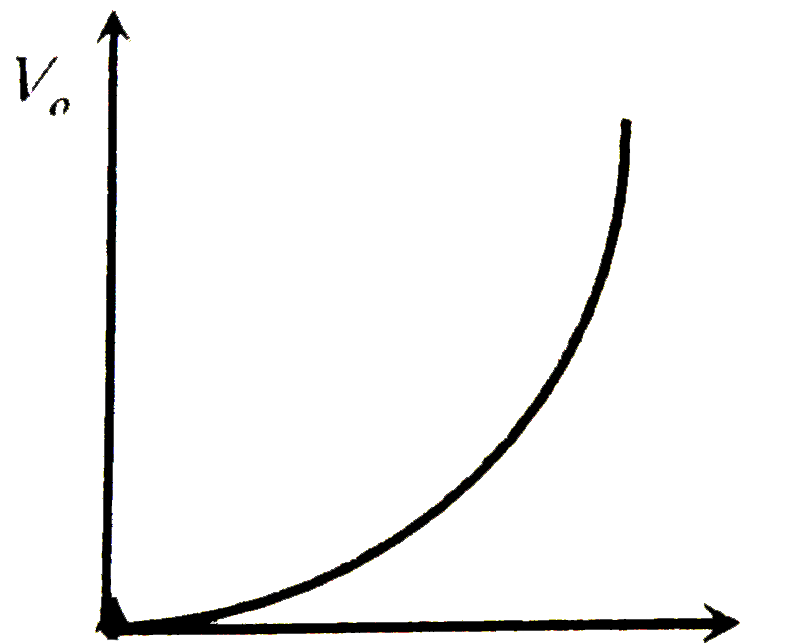 B
B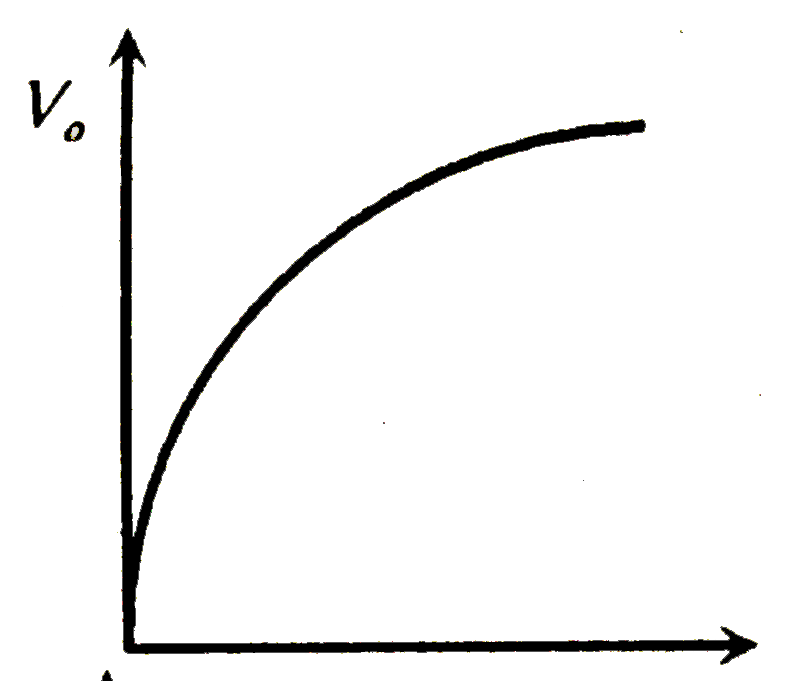 C
C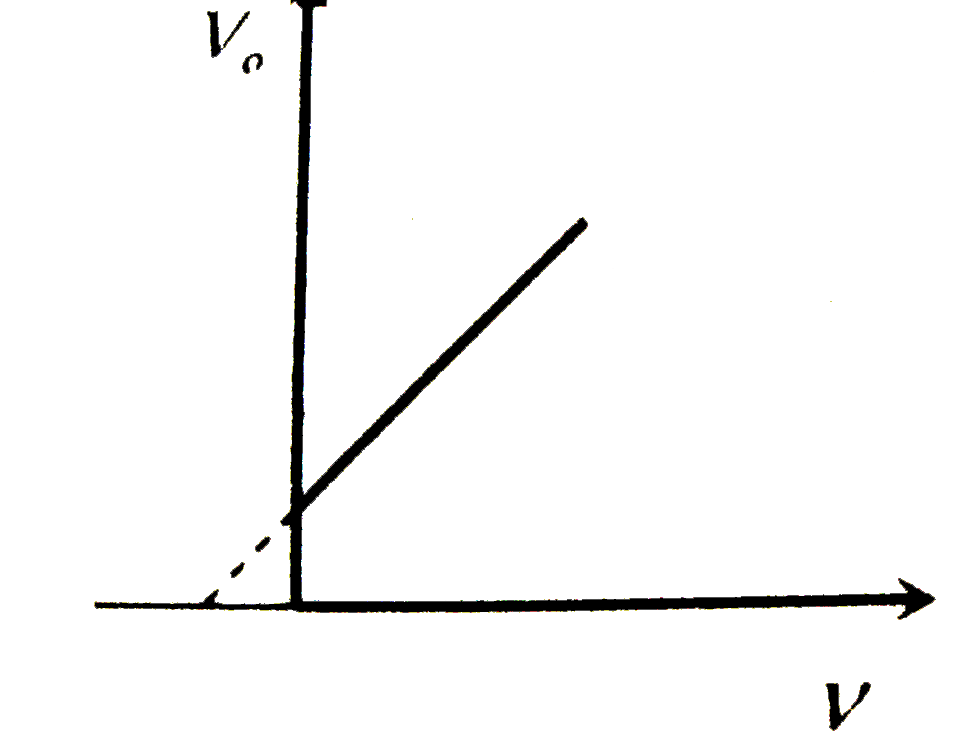 D
D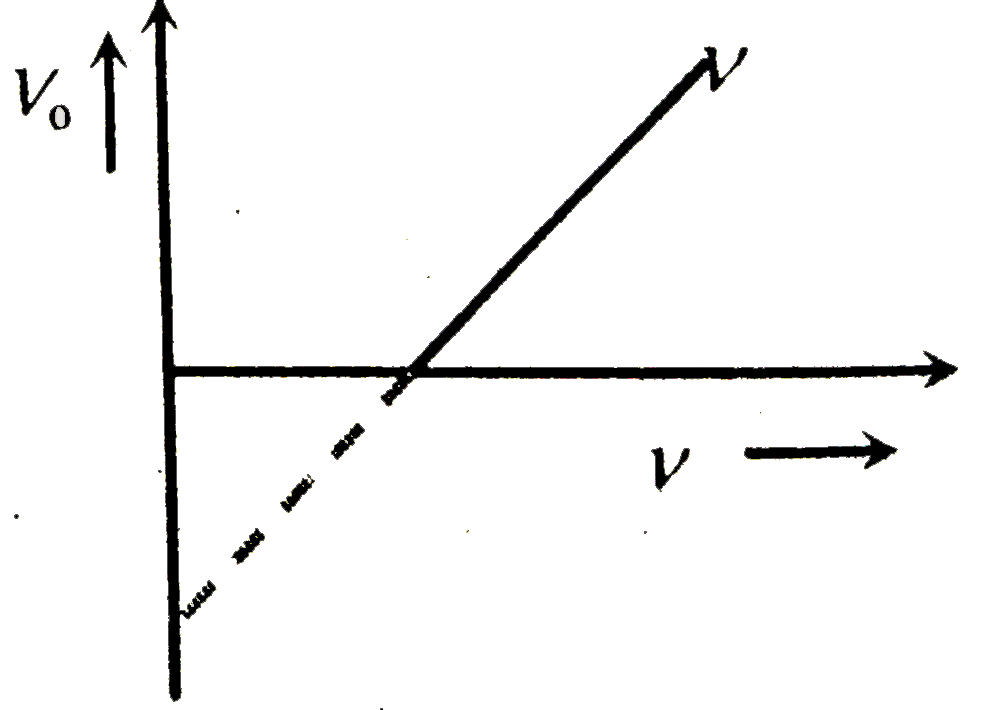
For a photoelectric cell, the graph shown the variation of cut off voltage (V0) with frequency (v) of incident light is
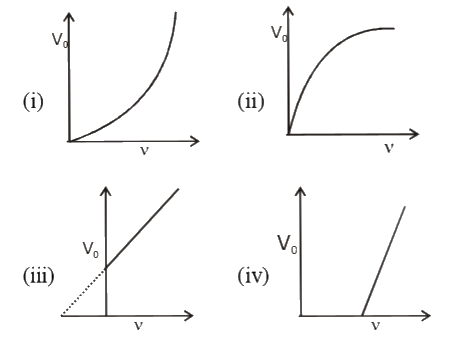 A(i)B(ii)C(iii)D(iv)
For a photoelectric cell the graph showing the variation of cut of voltage (V0) with frequency (v) of incident light is best represented by
 A
A B
B C
C D
D
Plot a graph showing variation of stopping potential (V0) with the frequency (v) of the incident radiation for a given photosensitive material. Hence, state the significance of the threshold frequency in photoelectric emission.
Using the principle of energy conservation, write the equation relating the energy of incident photon, threshold frequency and the maximum kinetic energy of the emitted photoelectrons.
View SolutionFor photoelectric effect in sodium, fig. shows the plot of cut-off voltage versus frequency of the incident radiation. Caclculate:
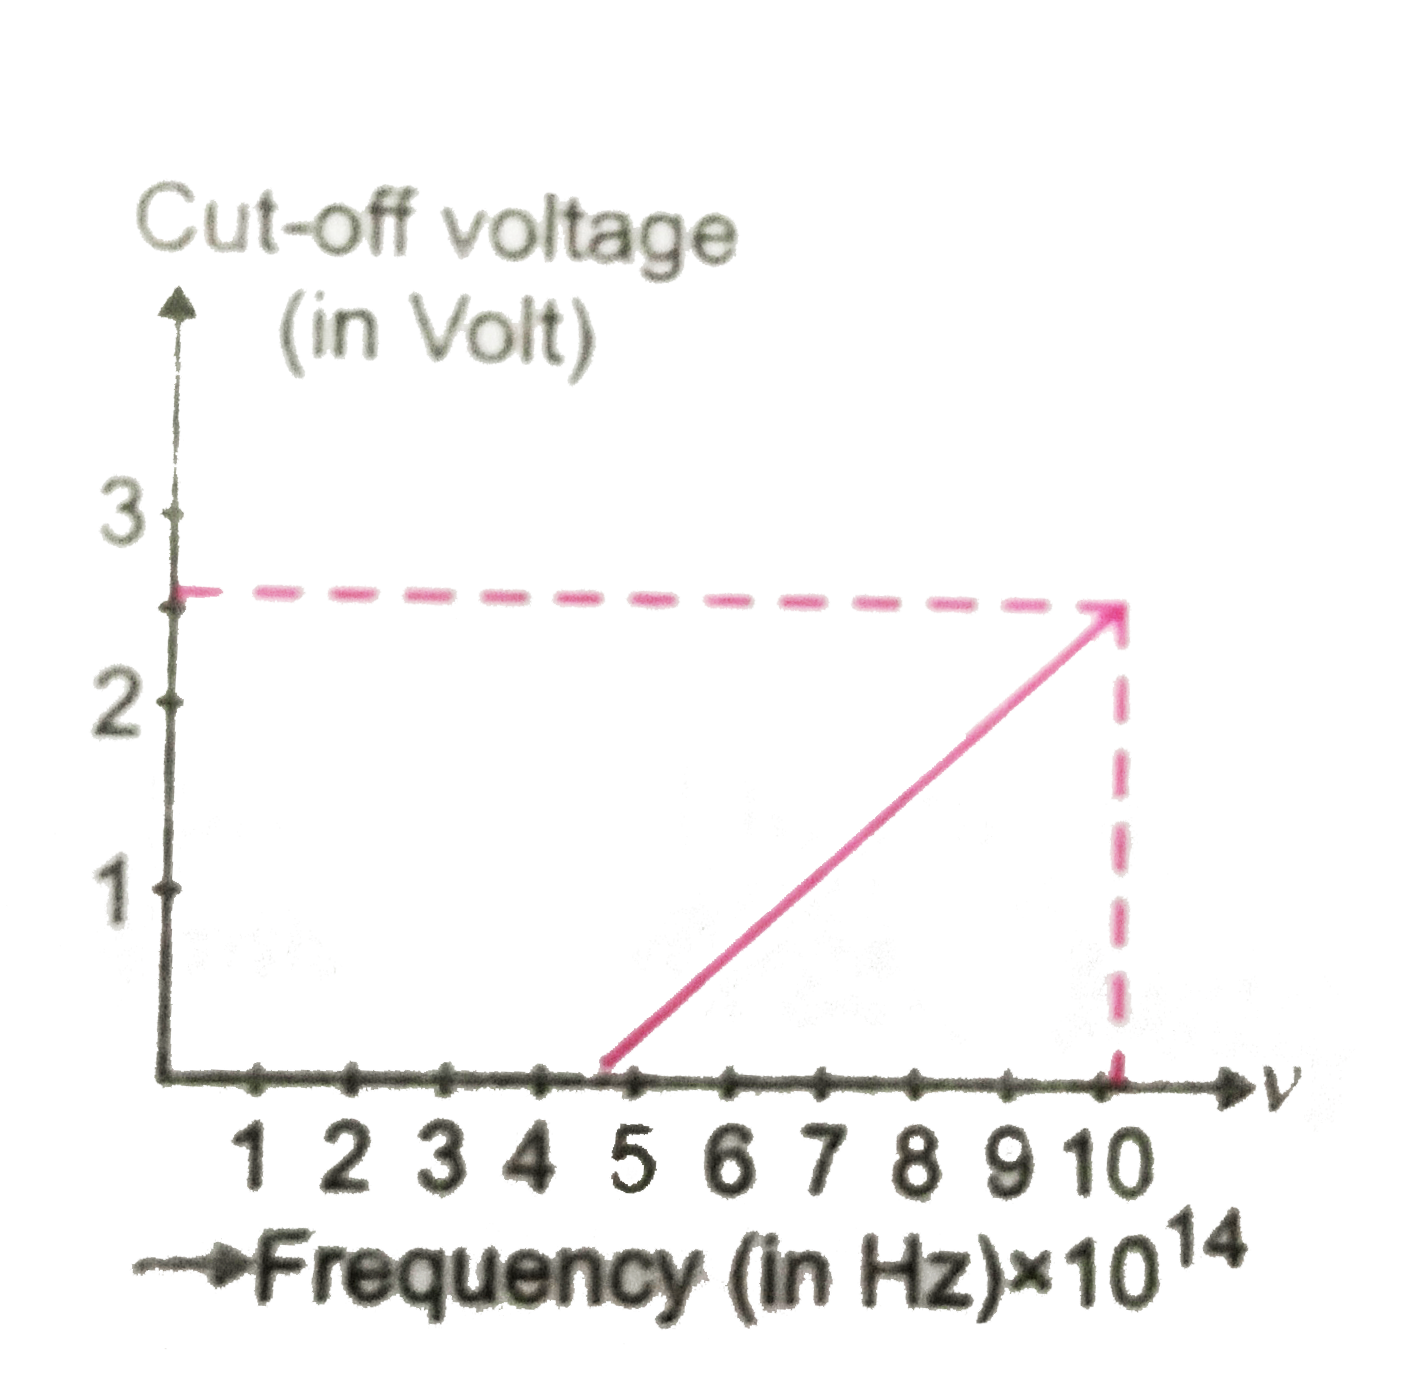
(i) the threshold frequency
(ii) the work function for sodium. (Use h=6.6×10⁻³⁴Js)
View SolutionWhat is photoelectric effect? Give any two practical applications of this effect. Write Einstein's photoelectric equation and use it to explain (i) independence of maximum energy of the emitted photoelectrons from intensity of incident light (ii) existence of a threshold frequency of the emitted photoelectrons from intensity of incident light.
View SolutionSketch a graph between frequency of incident radiations and stopping potential for a given photosenstive material. What information can be obtained from the value of the intercept on the potential axis? A source of light of frequency greater than the threshold frequency is placed at a distance of 1m from the cathode of a photocell. The stopping potential is found to be V. If the distance of the light source from the cathode is reduced, explain giving reasons, what change will you observe in the (i) photoelectric current (i) stopping potential?
View SolutionIn an experiment on photoelectric effect, the slope of the cut off voltage versus frequency of incident light is found to be 4.12×10⁻¹⁵Vs. Given e=1.6×10⁻¹⁹C, estimate the value of Planck's constant.
View Solution
