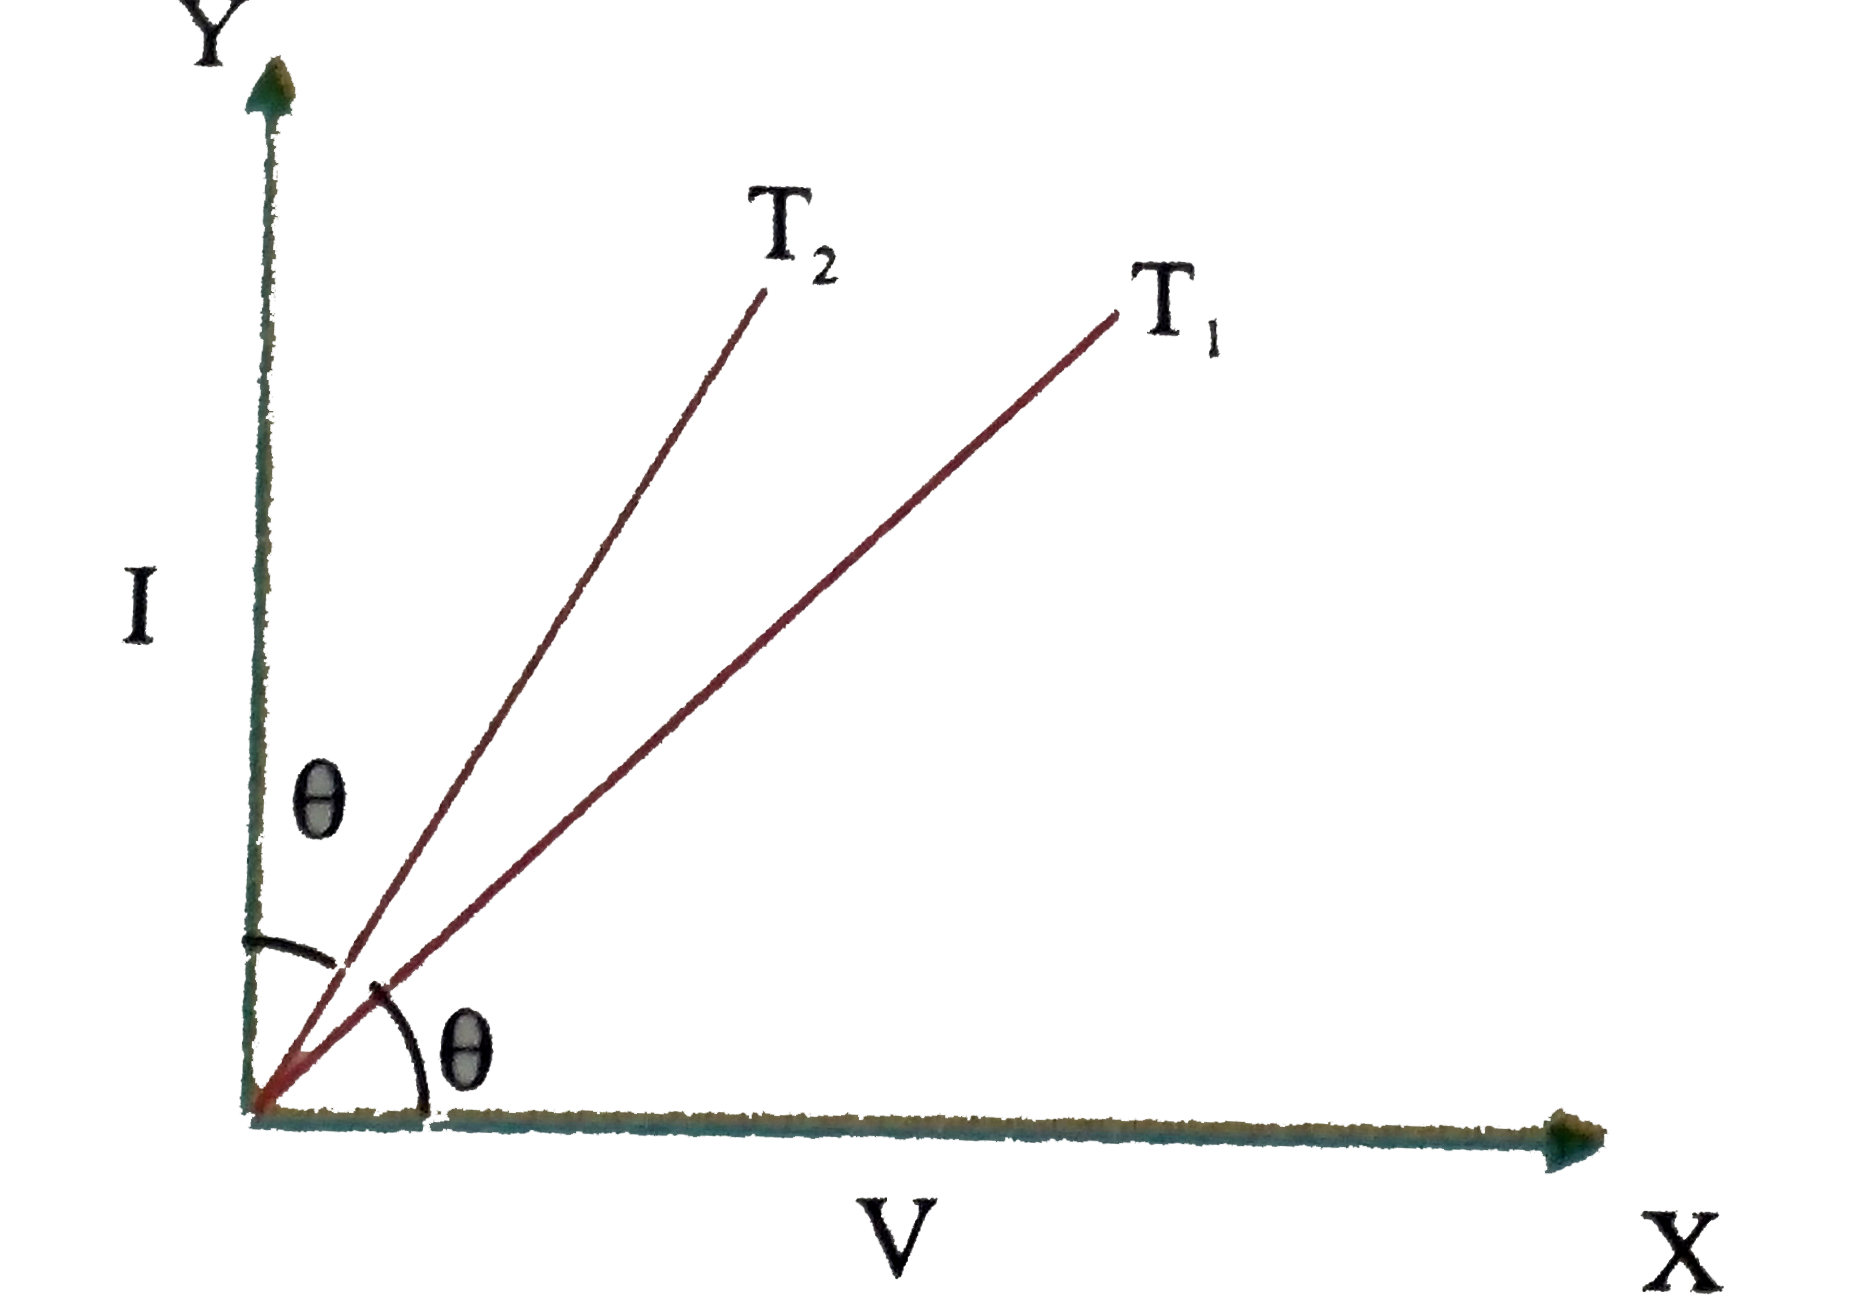
V−I graphs for a material is shown in the figure. The graphs are drawn at two different temperatures.
T1−T2∝cot2θ
T1−T2∝sin2θ
T1−T2∝tan2θ
T1−T2∝cos2θ
The correct Answer is:A
Step by step video, text & image solution for V-I graphs for a material is shown in the figure. The graphs are drawn at two different temperatures. by Physics experts to help you in doubts & scoring excellent marks in Class 12 exams.
Updated on:21/07/2023Topper's Solved these Questions
- CURRENT ELECTRICITYBOOK - NARAYNACHAPTER - CURRENT ELECTRICITYEXERCISE - Level 1 C.W
64 Videos
- CURRENT ELECTRICITYBOOK - NARAYNACHAPTER - CURRENT ELECTRICITYEXERCISE - Level 1 H.W
63 Videos
- CURRENT ELECTRICITYBOOK - NARAYNACHAPTER - CURRENT ELECTRICITYEXERCISE - Level 6
43 Videos
- COMMUNICATION SYSTEMBOOK - NARAYNACHAPTER - COMMUNICATION SYSTEMEXERCISE - Level-II(H.W)
25 Videos
- DUAL NATURE OF RADIATION AND MATTERBOOK - NARAYNACHAPTER - DUAL NATURE OF RADIATION AND MATTEREXERCISE - ASSERTION AND REASON
15 Videos
Similar Questions
The stress-strain graphs for two materials A and B are shown in the figure. The graphs are drawn to the same scale.
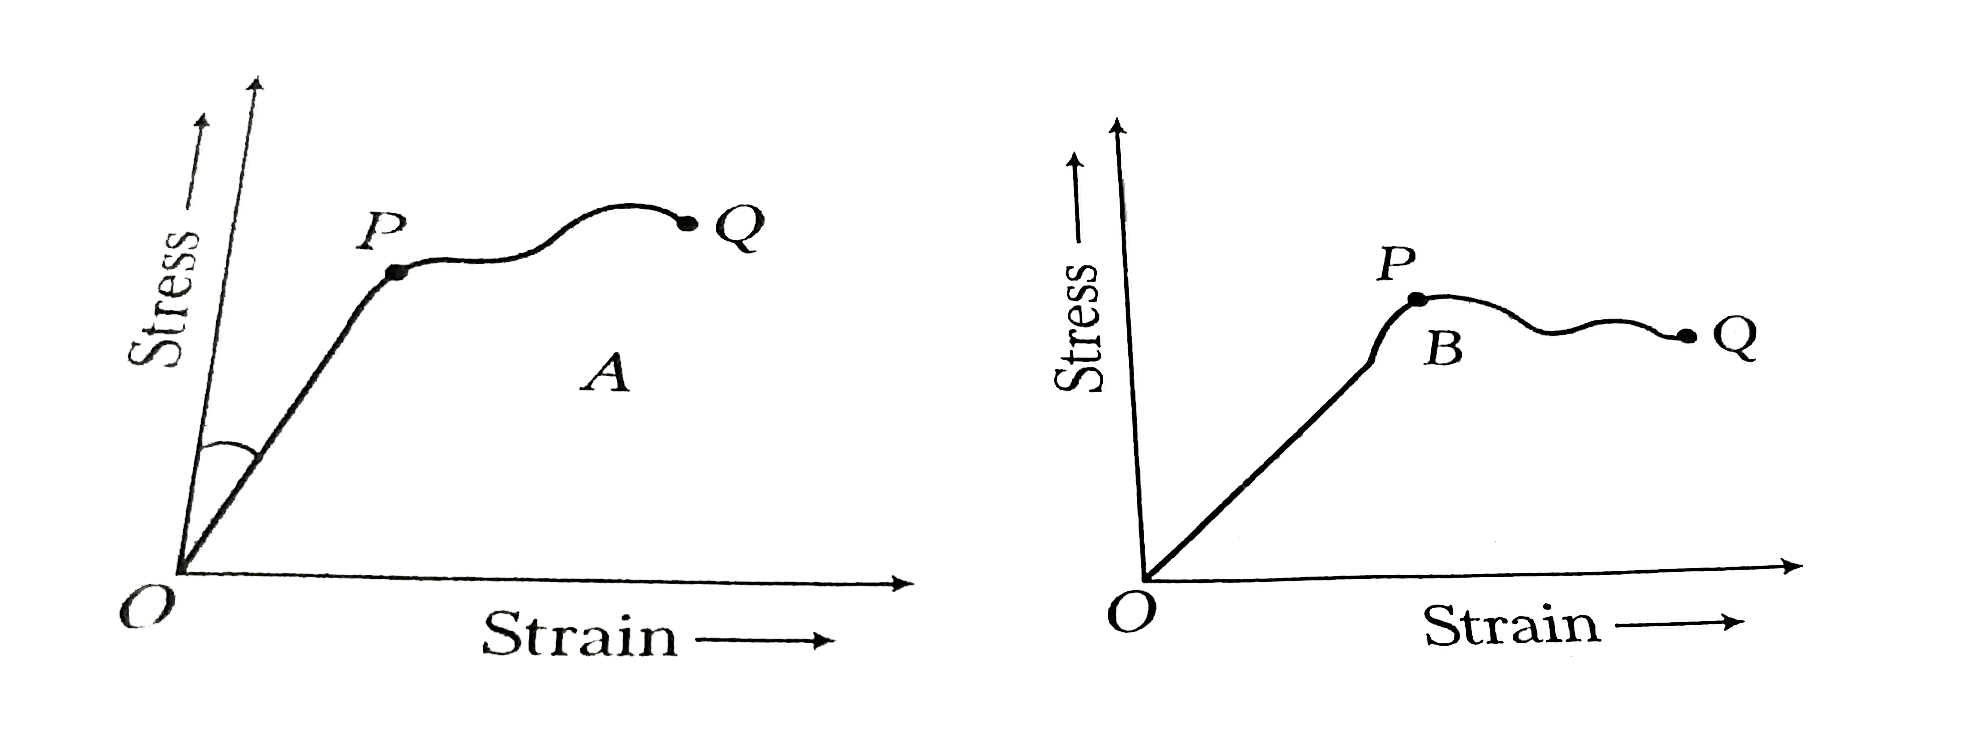
(a) Which material has a greater Young's modulus ?
(b) Which material is more ductile ?
(c) Which material is more brittle?
(d) Which of the two is the stronger material ?
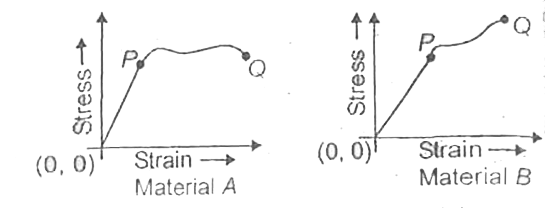
View SolutionThe stress-strain graphs for two materials A and are shown in figure. The graphs are drawn to the same scale. Select the correct statement
View Solution
Knowledge Check
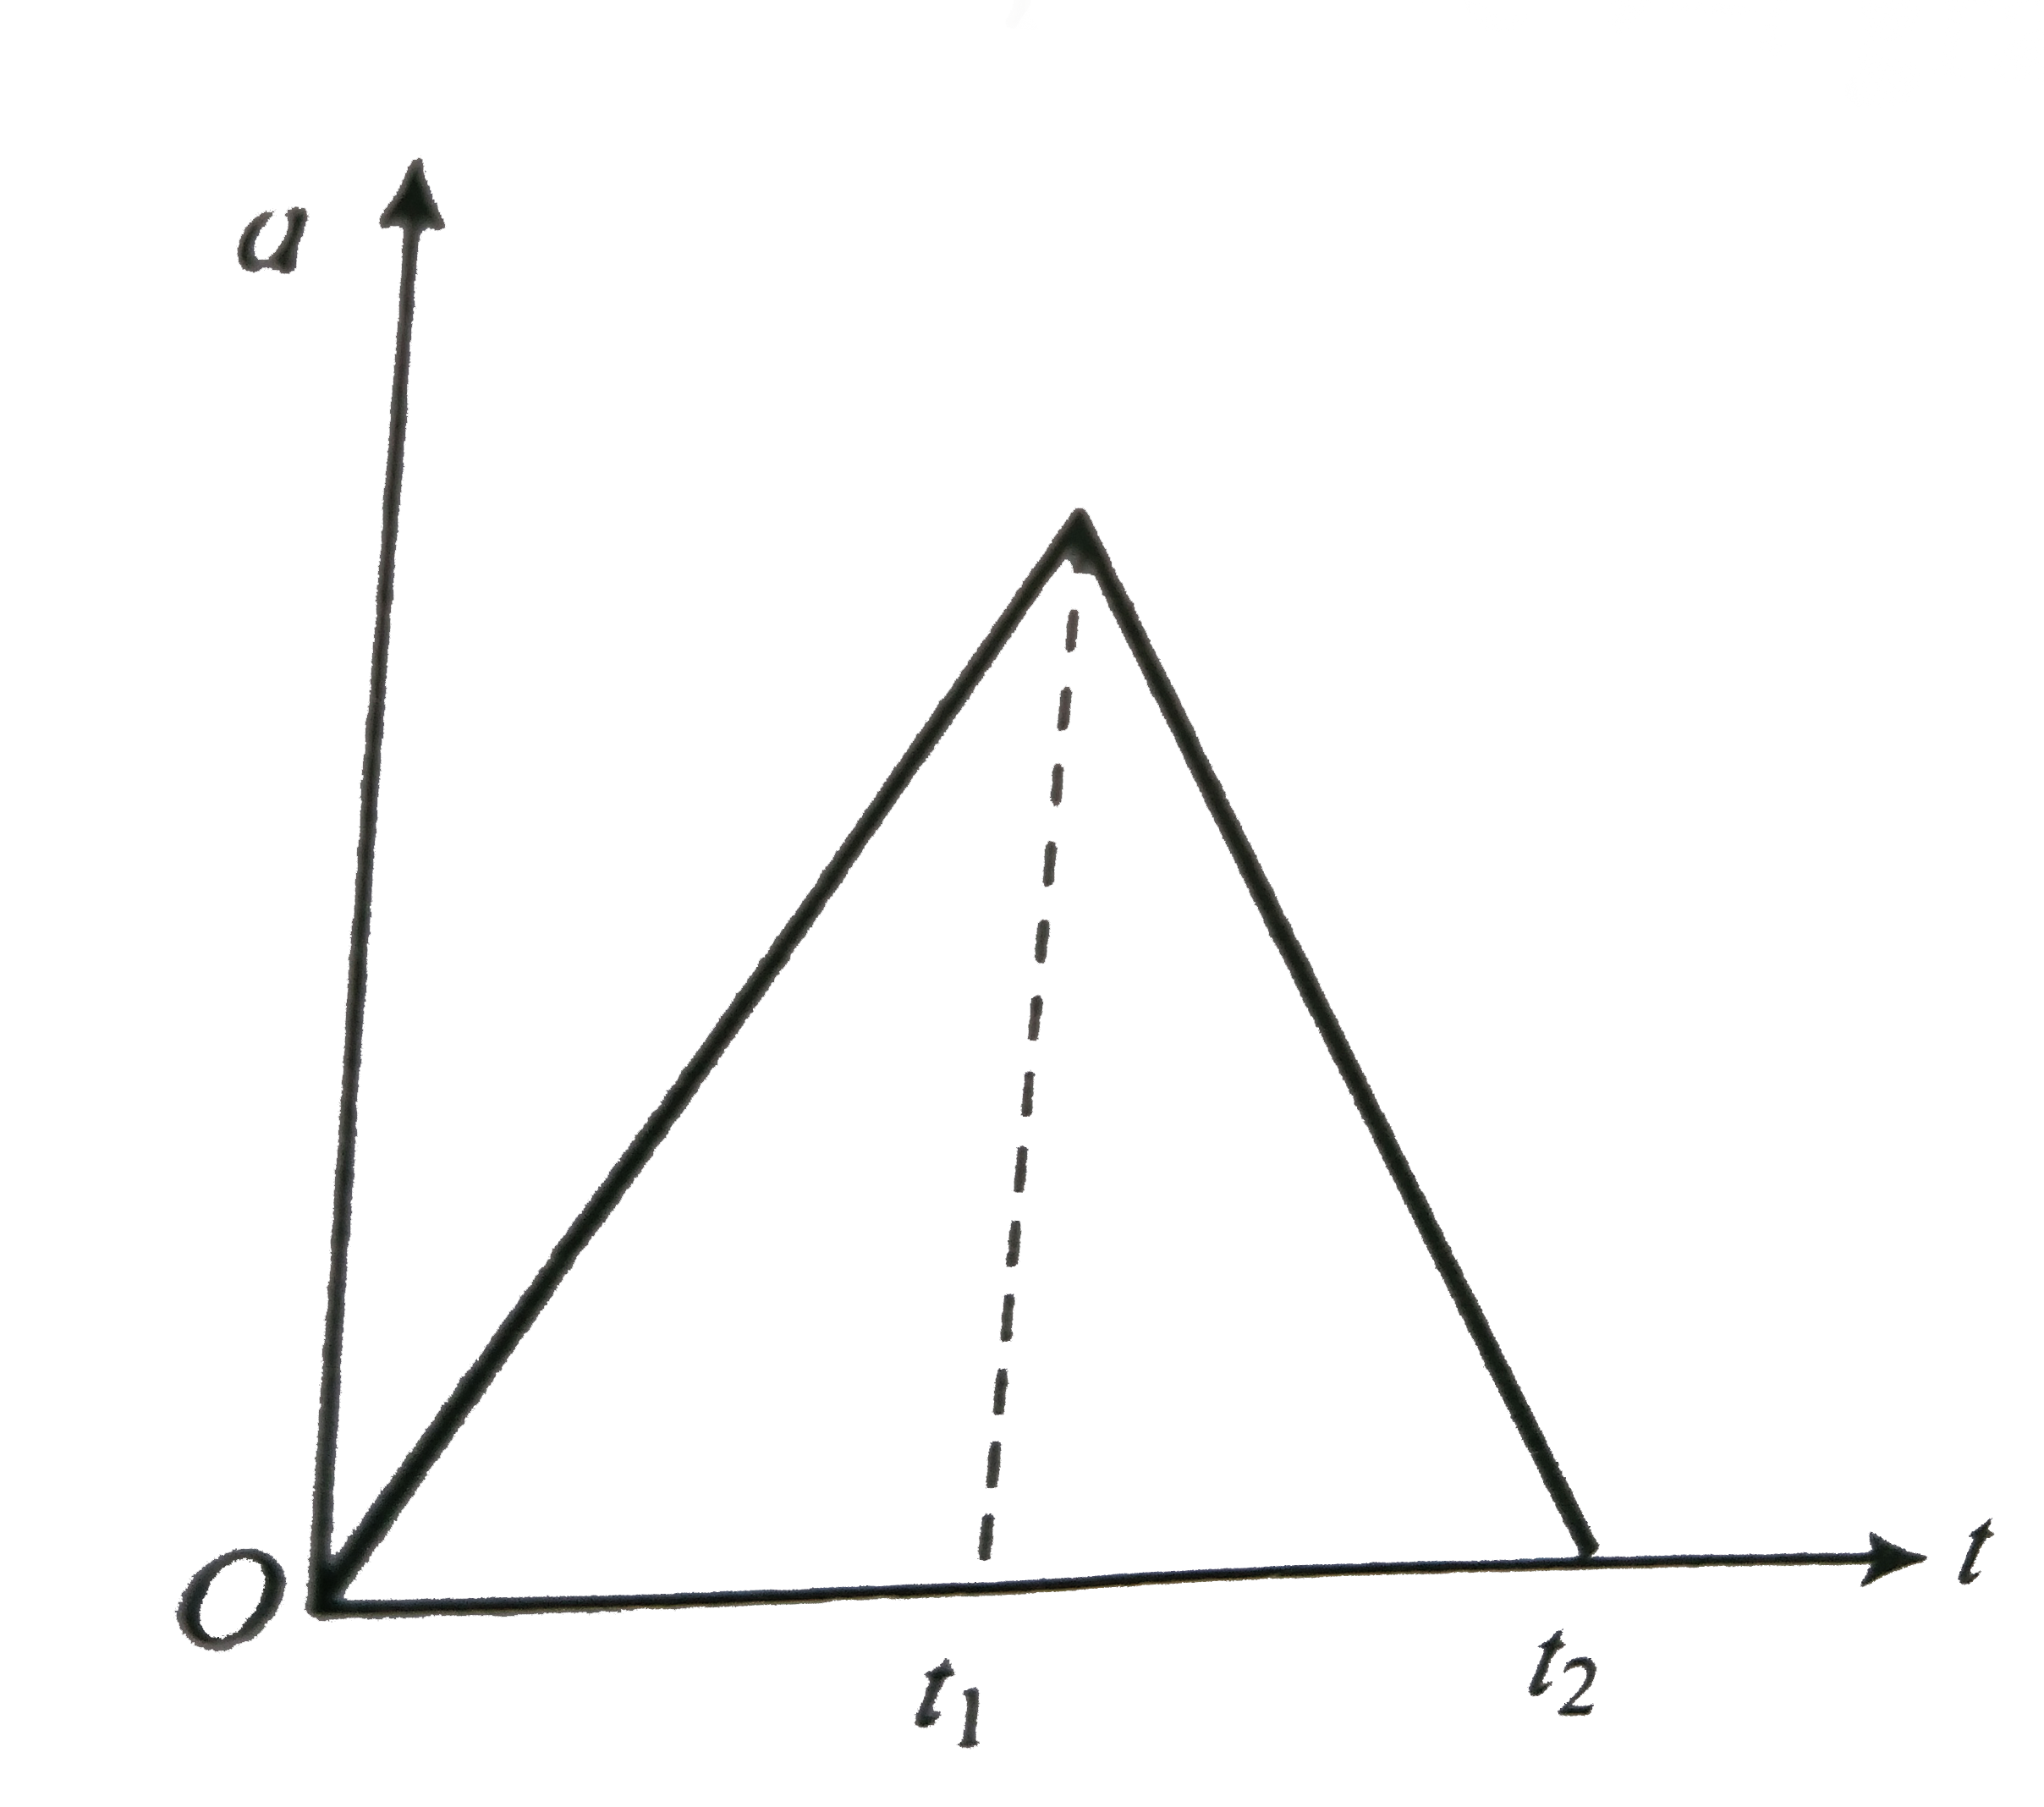
The acceleration versus time graph of a particle is shown in the figure. The respective v−t graph of the particle is .
 .A
.A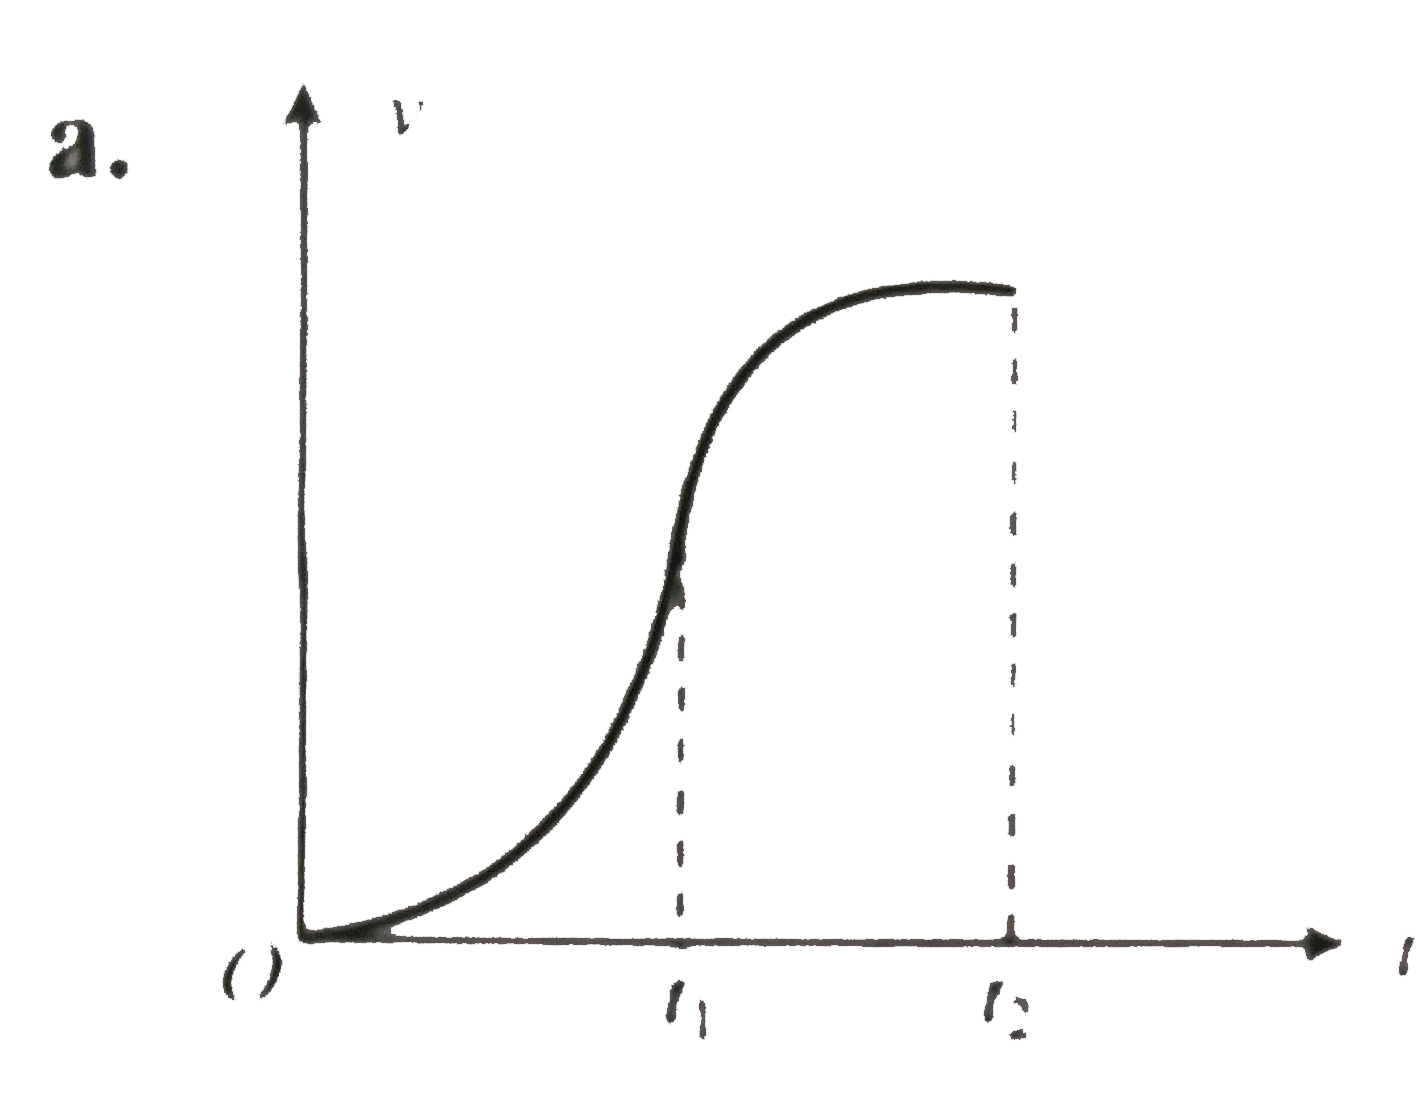 .B
.B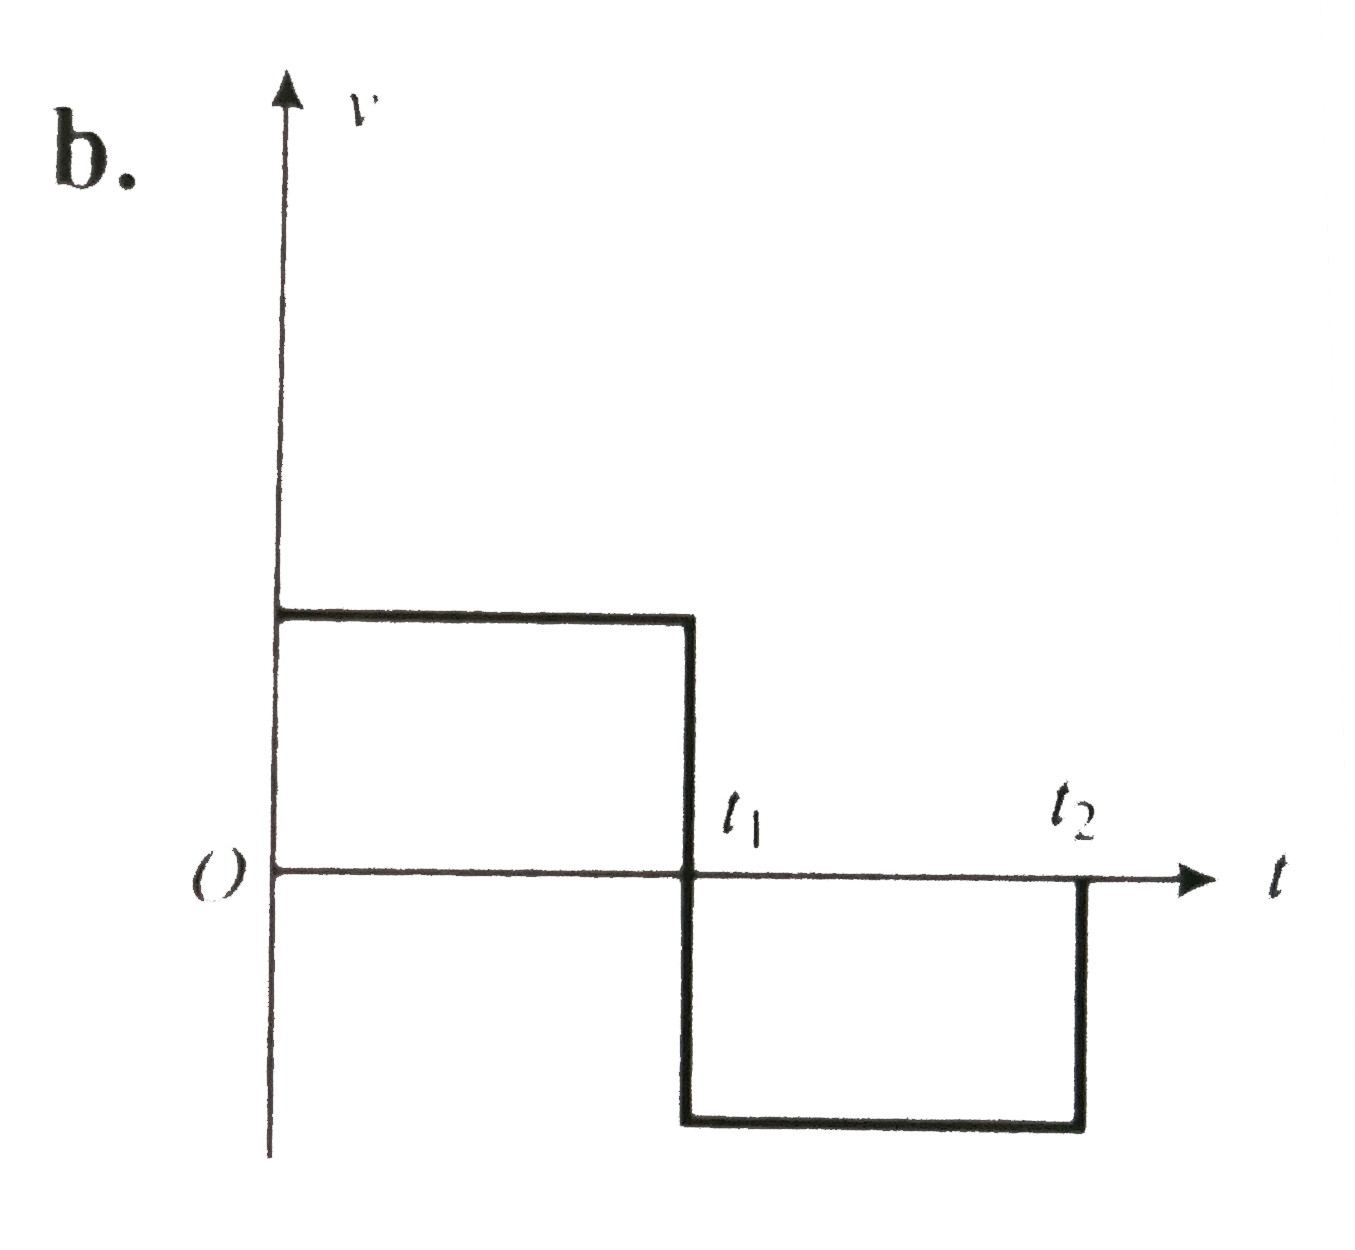 .C
.C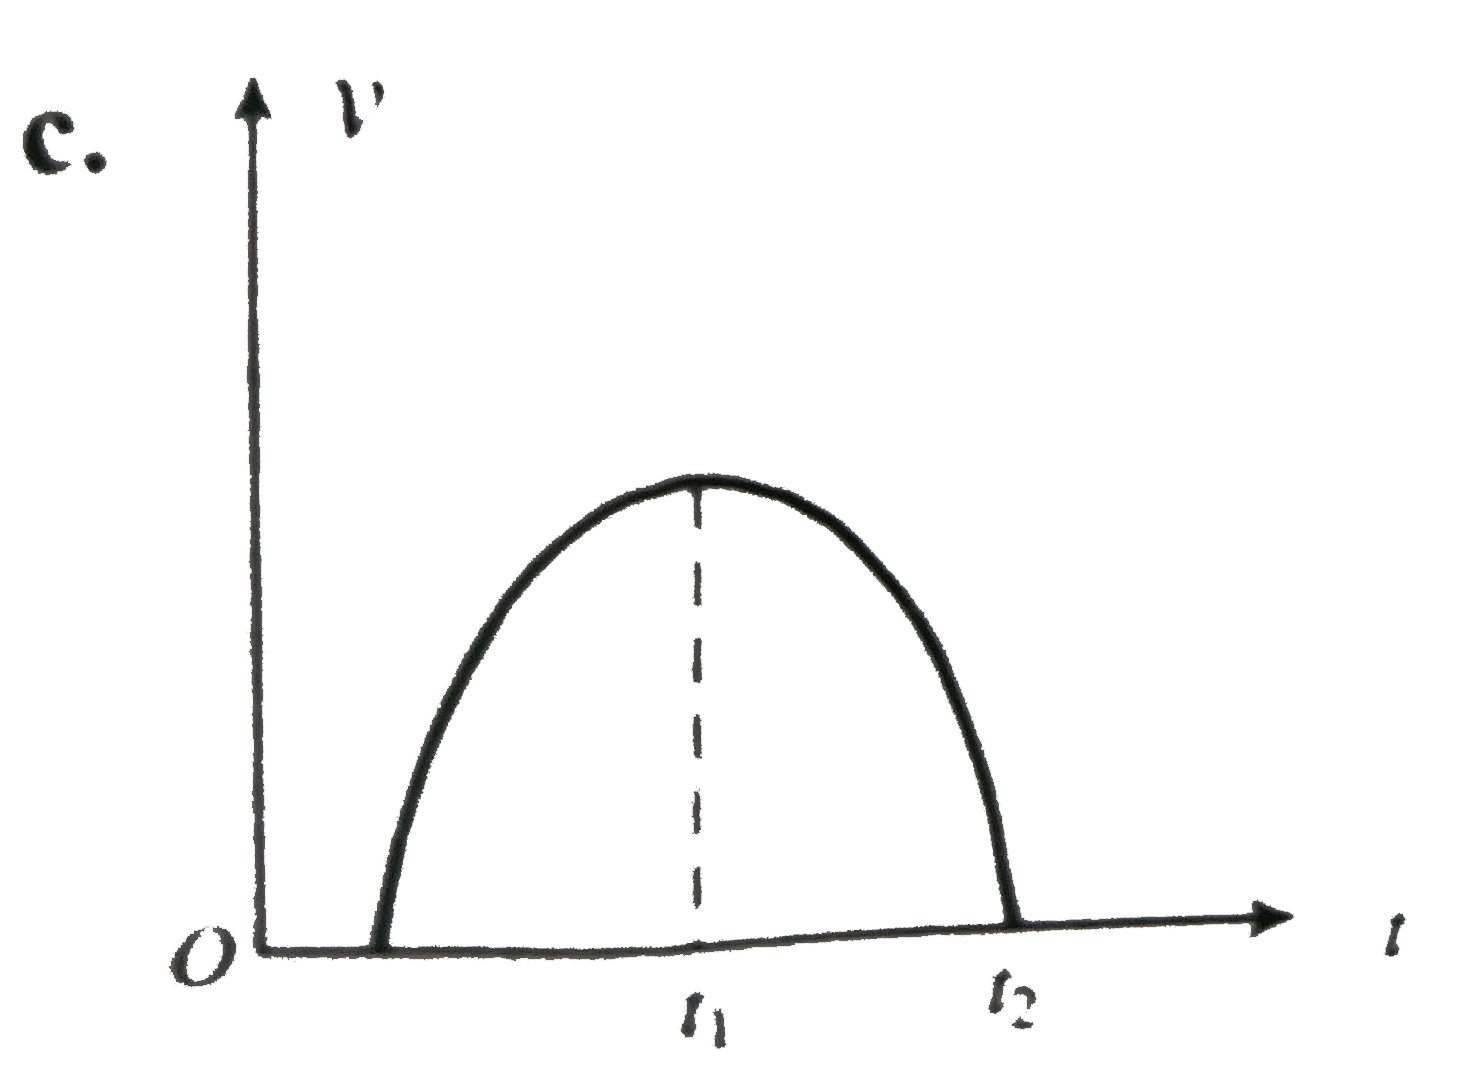 .D
.D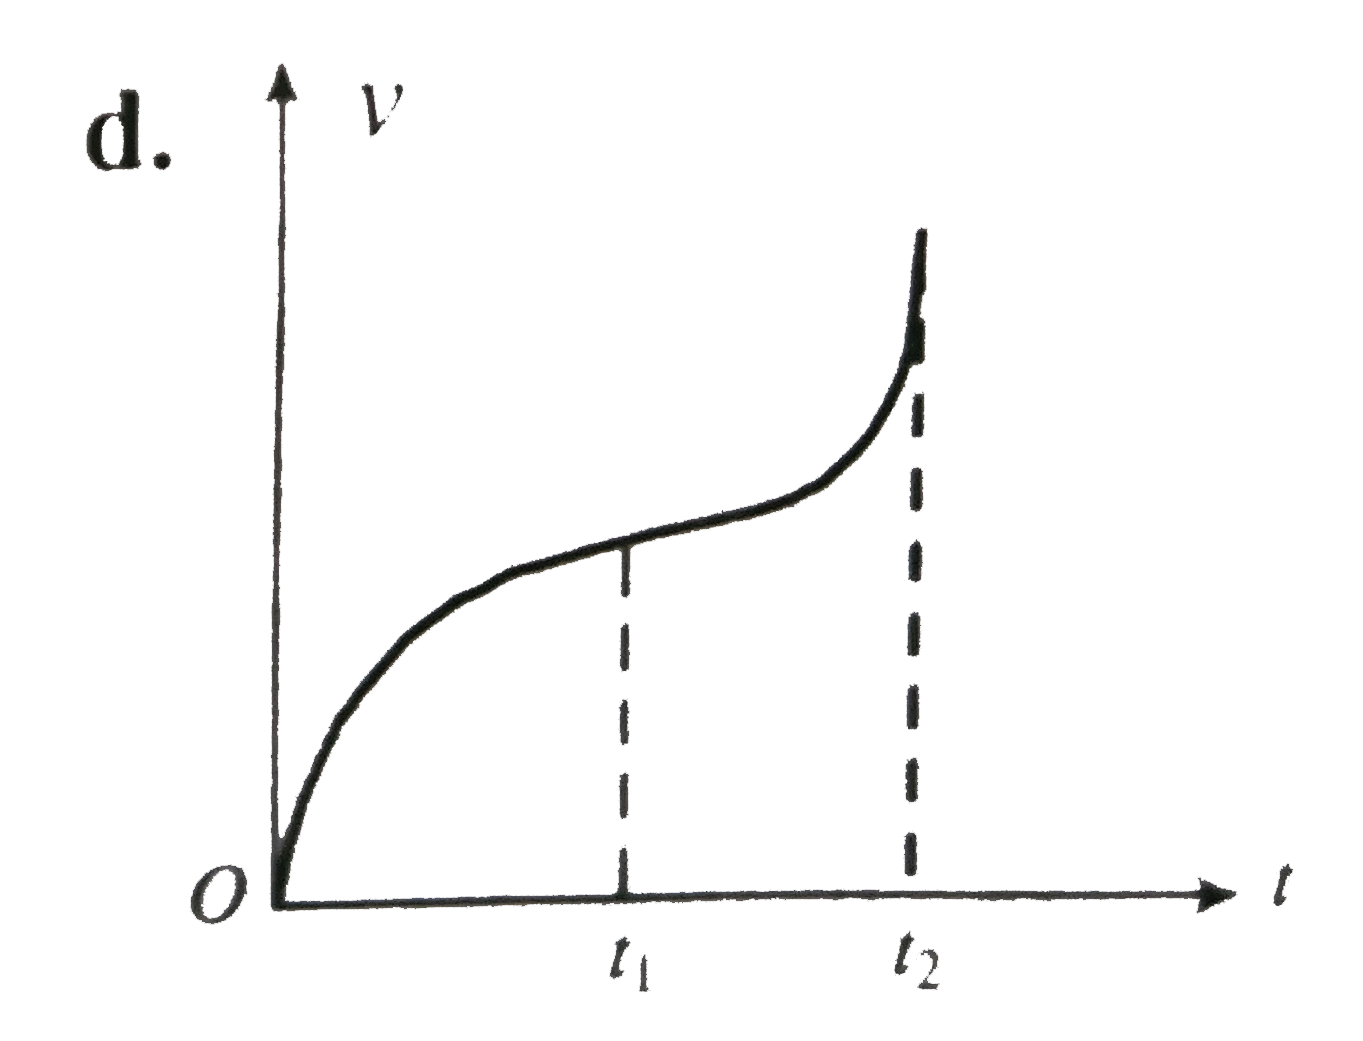 .
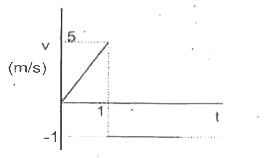
.The velocity time graph for a particle moving along X-axis is shown in the figure. The corresponding displacement time graph is correctly shown by
 A
A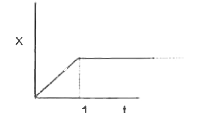 B
B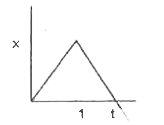 C
C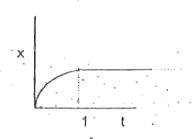 D
D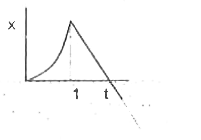
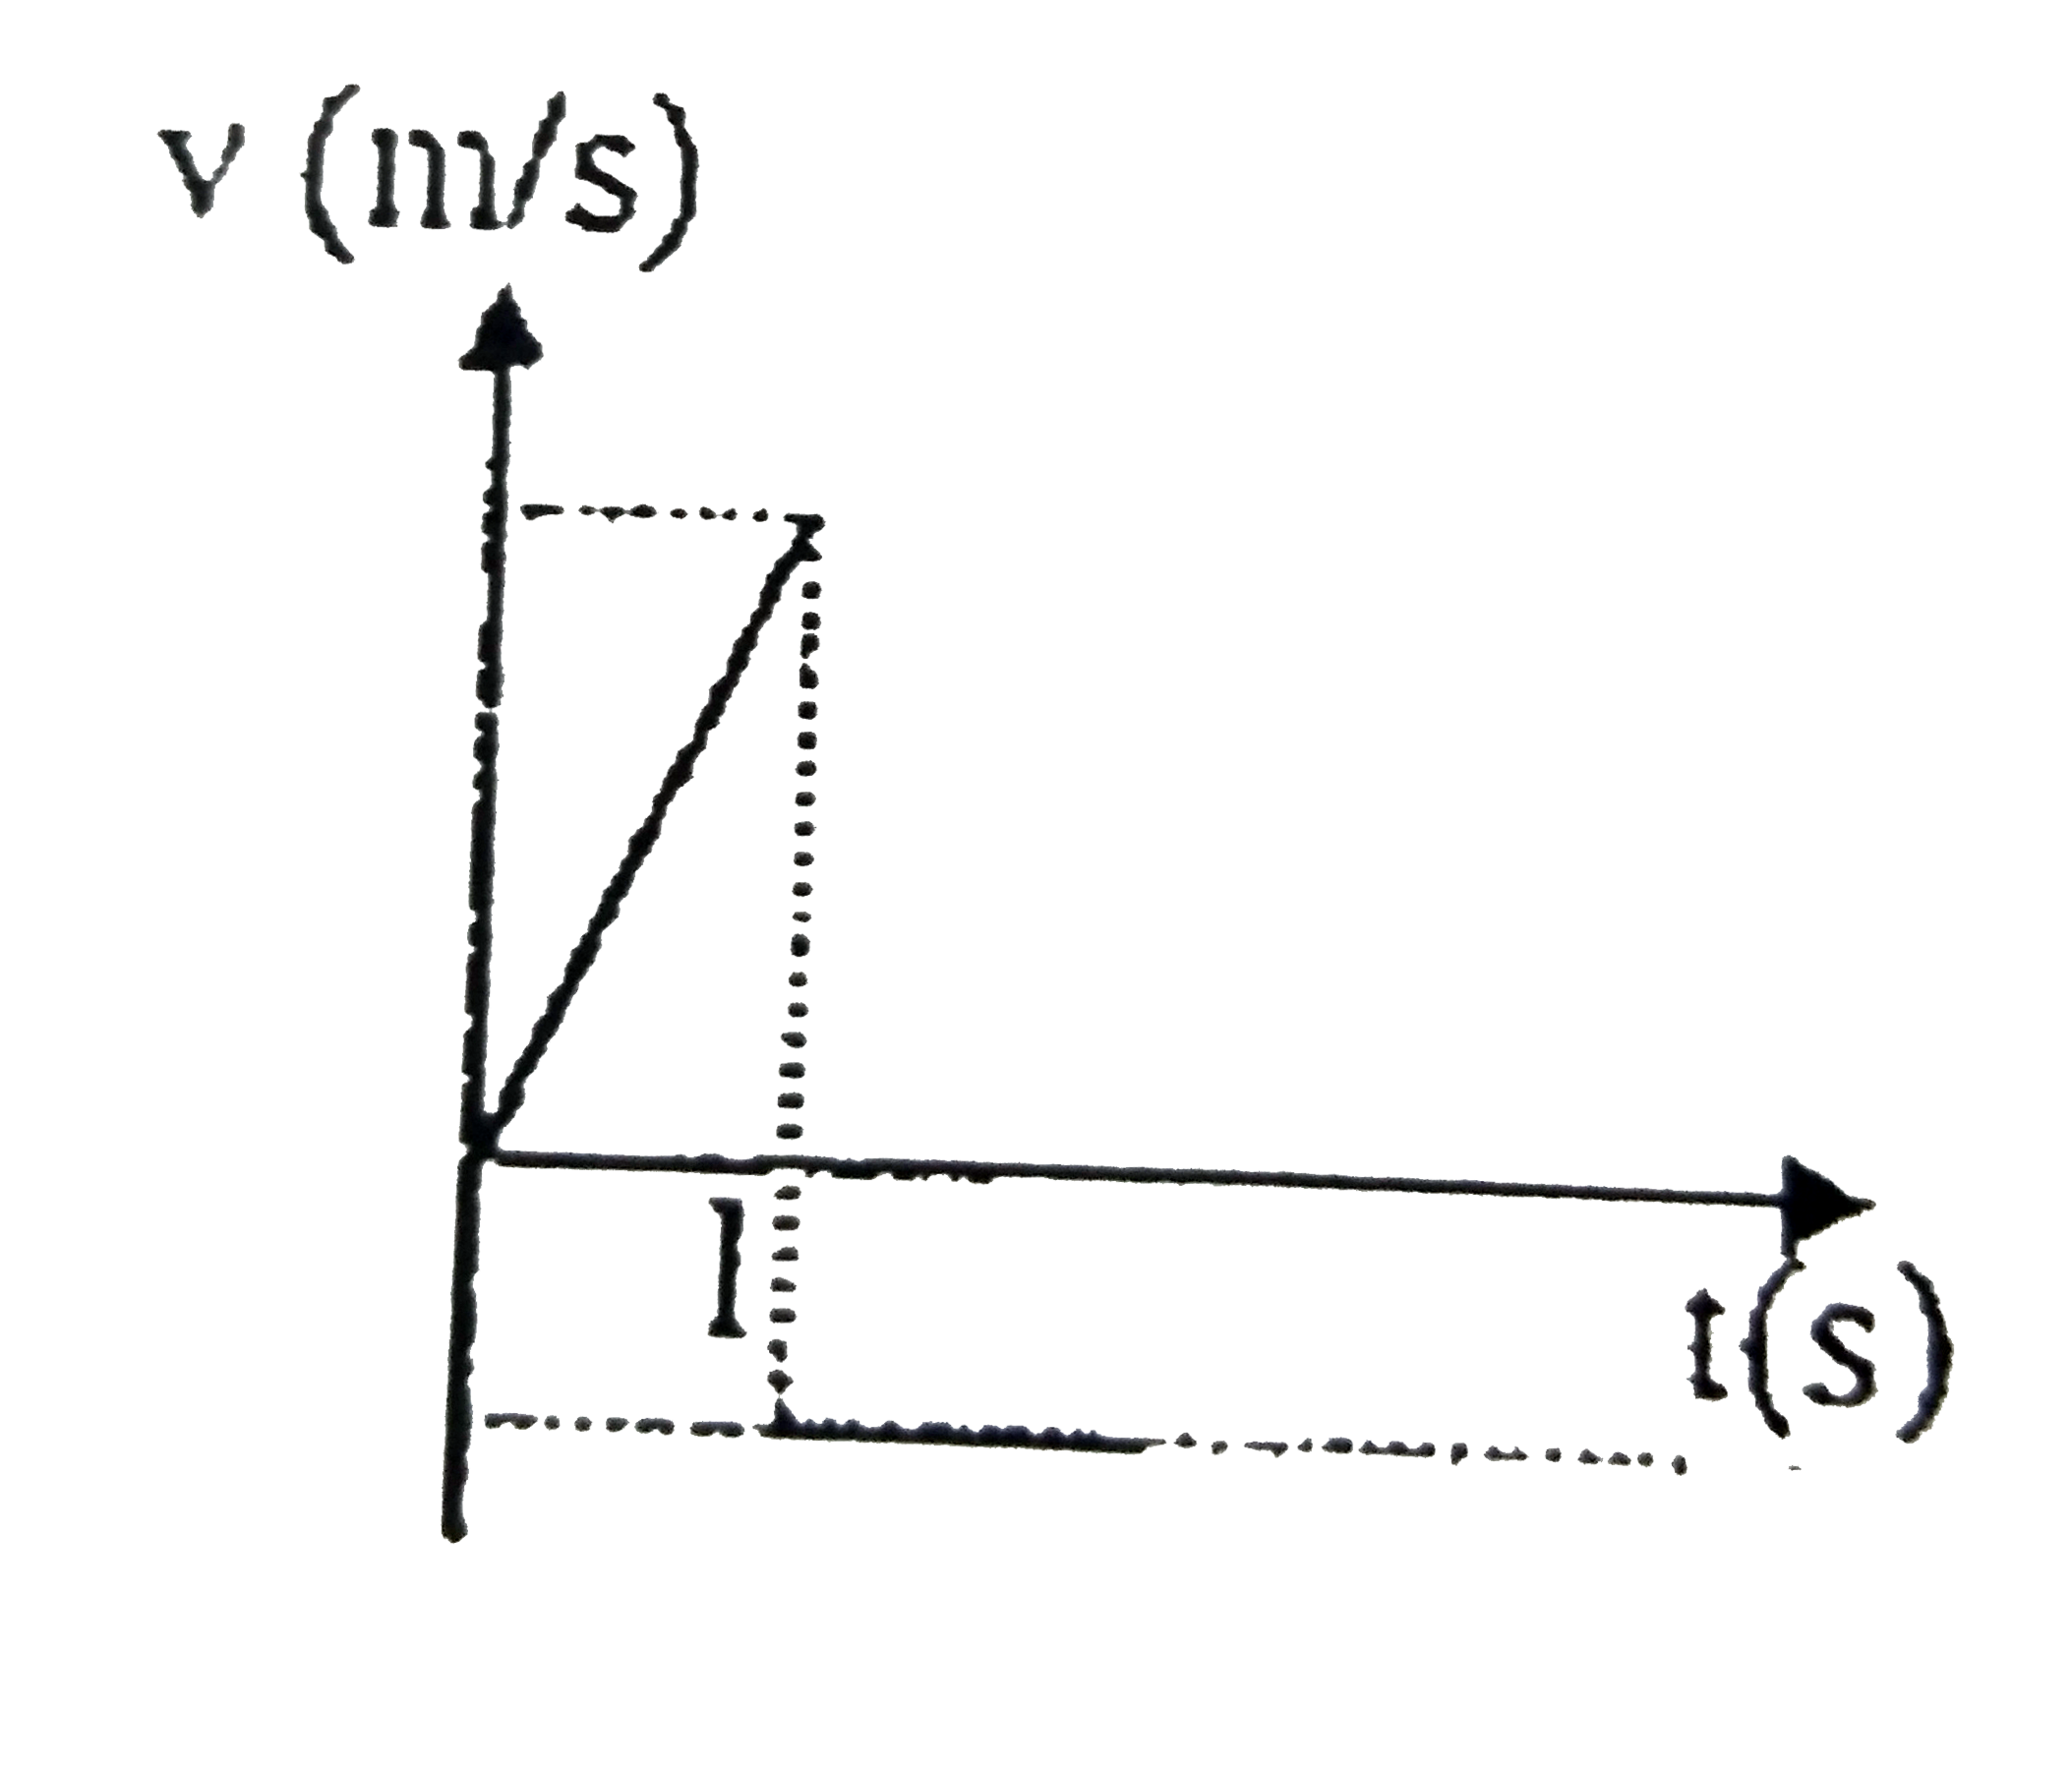
The velocity time graph for a particle moving along x-axis is shown in the figure. The corresponding displacement time graph is correctly shown by
 A
A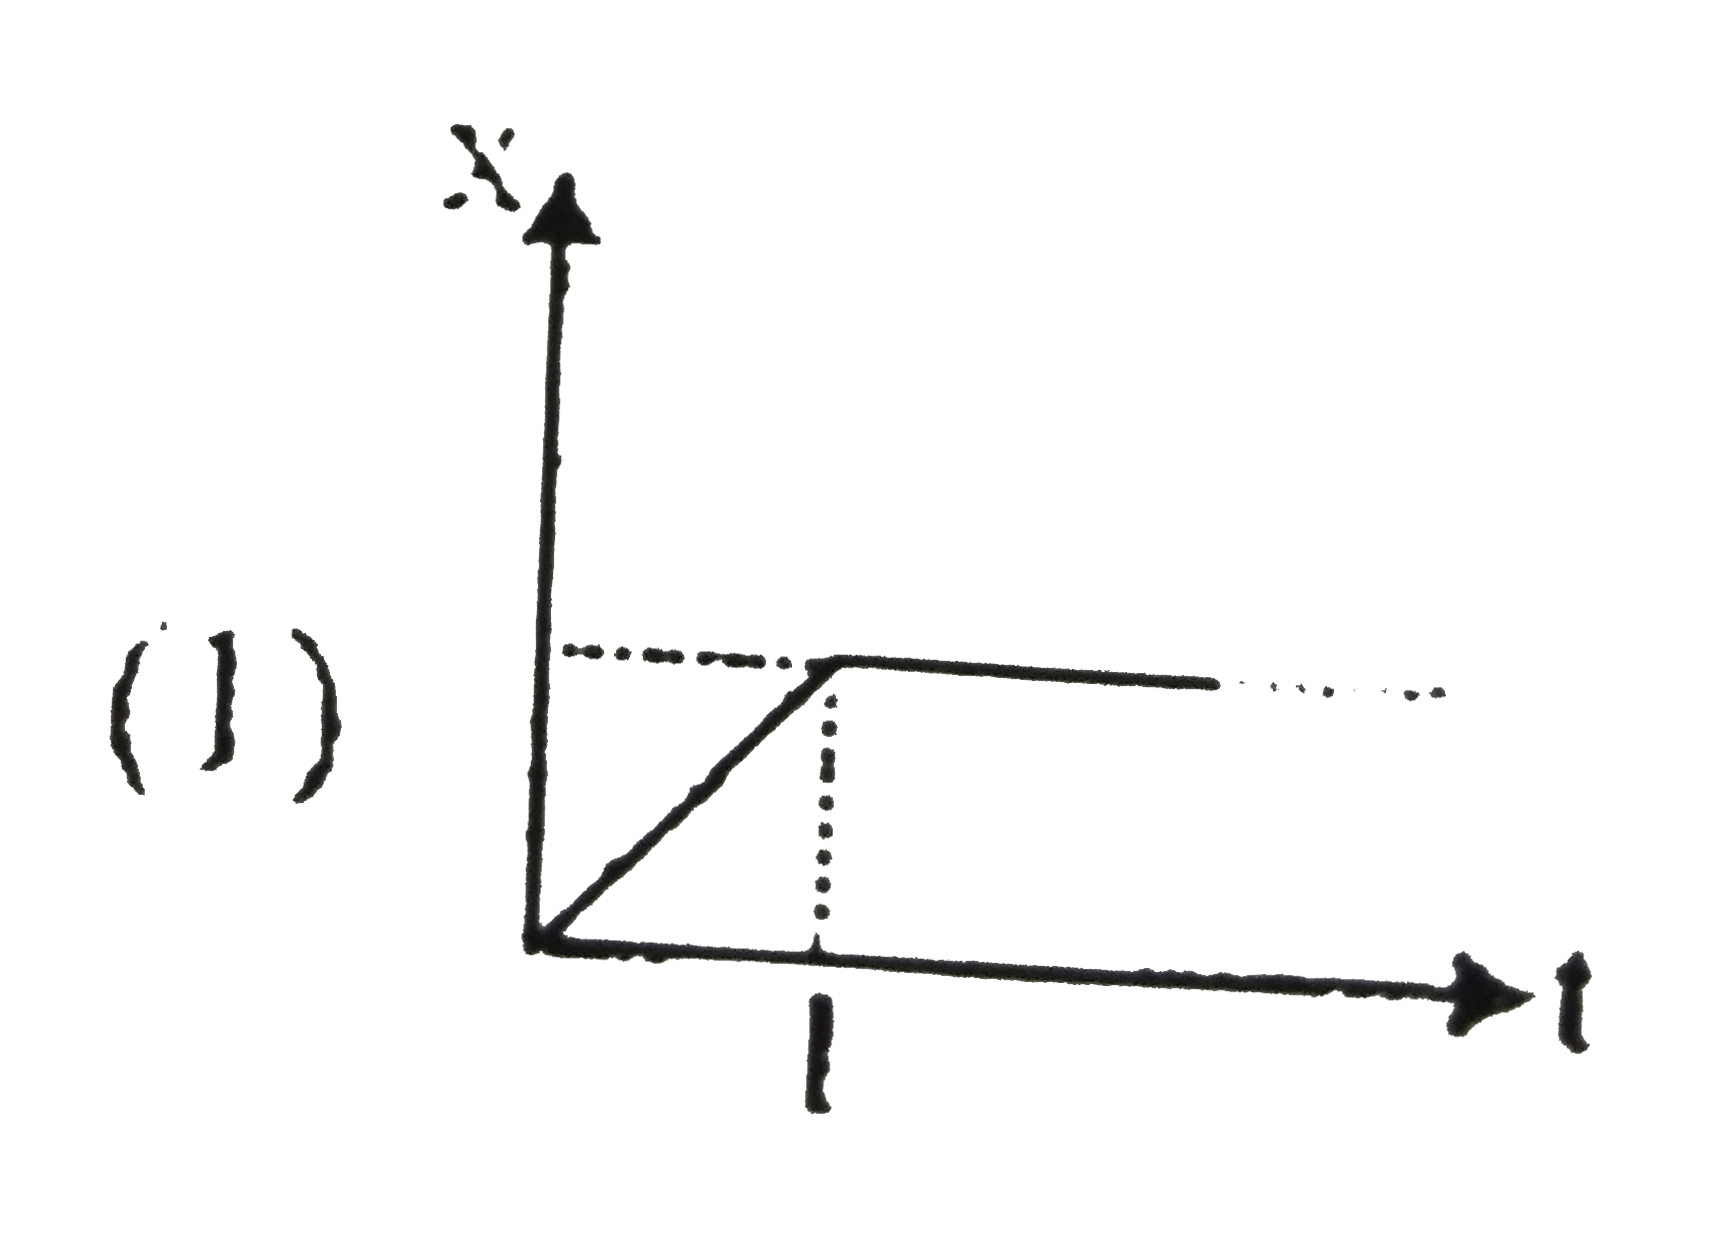 B
B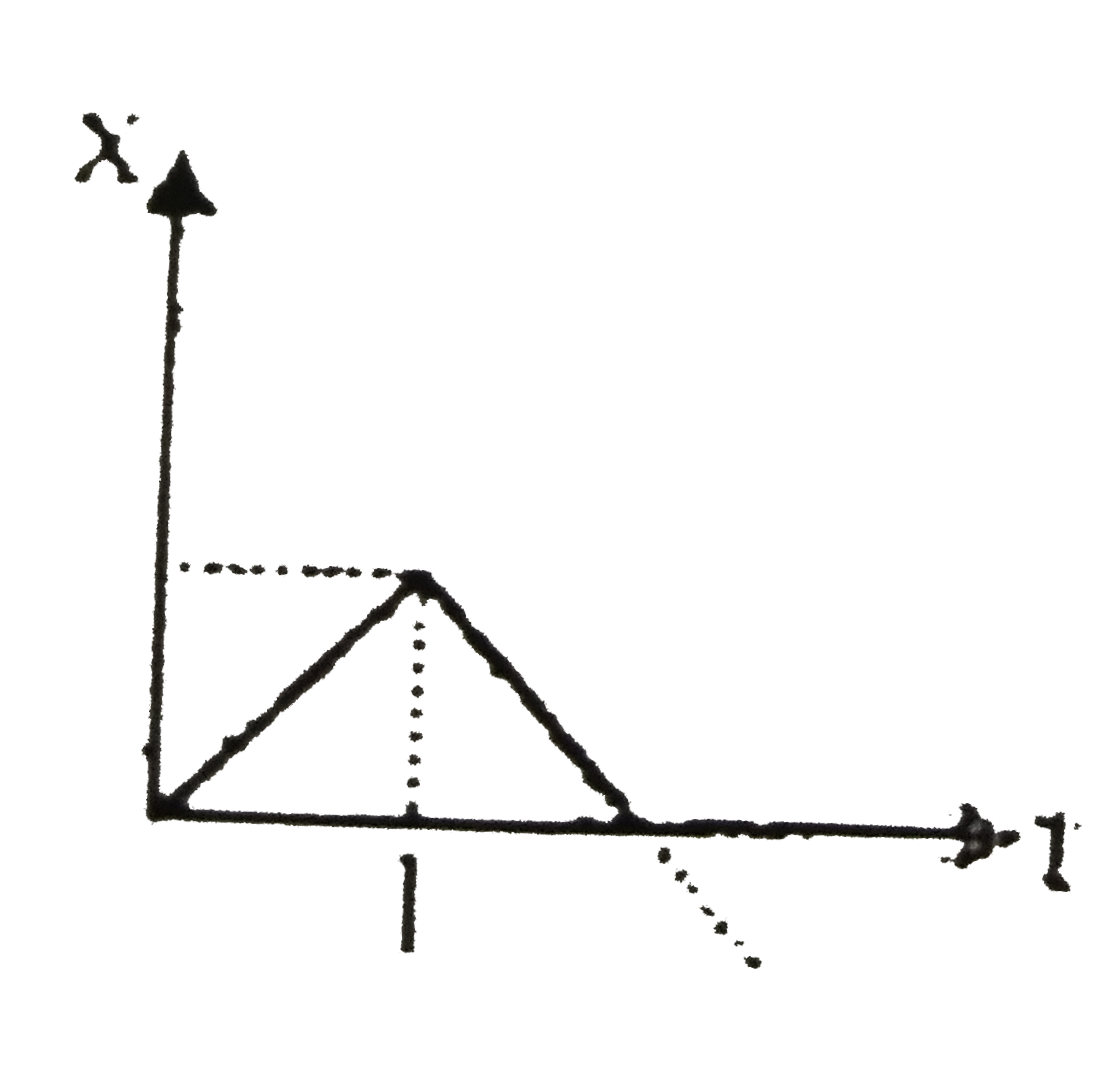 C
C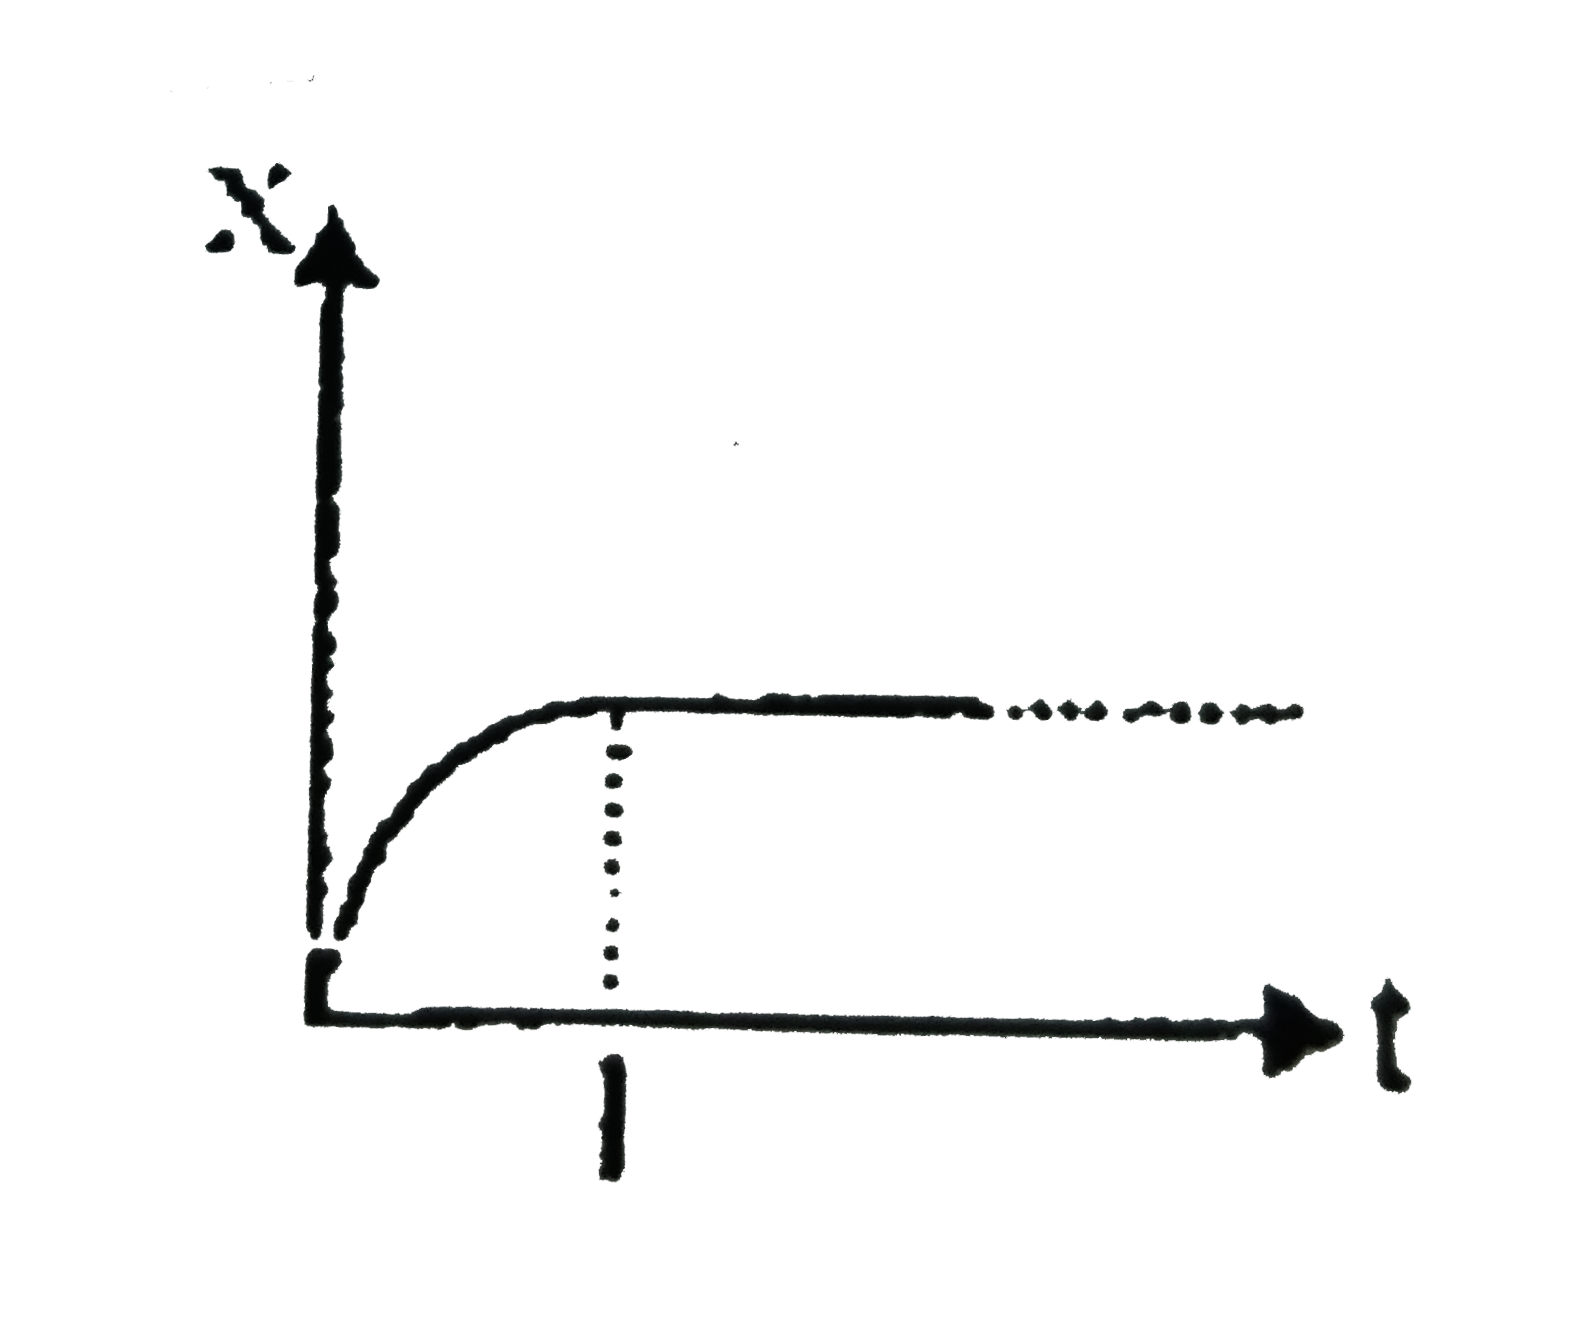 D
D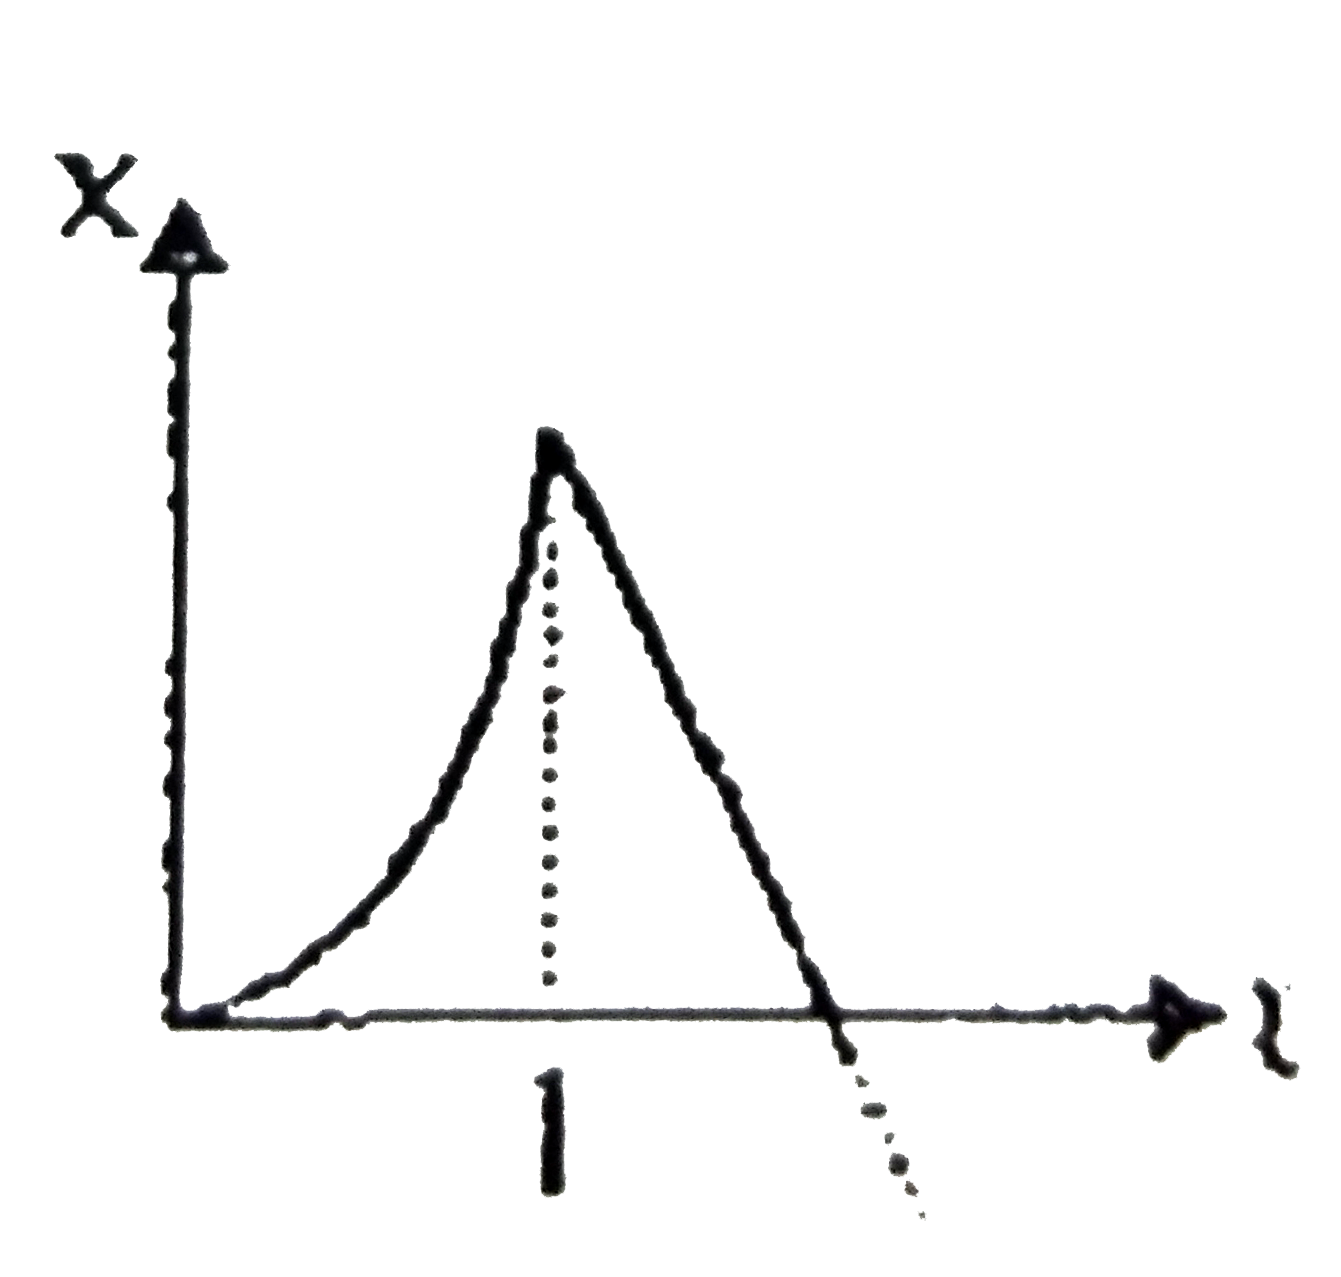
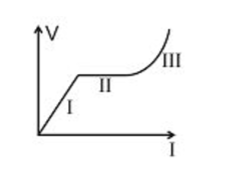
Voltage V v/s I graph is shown in the figure.
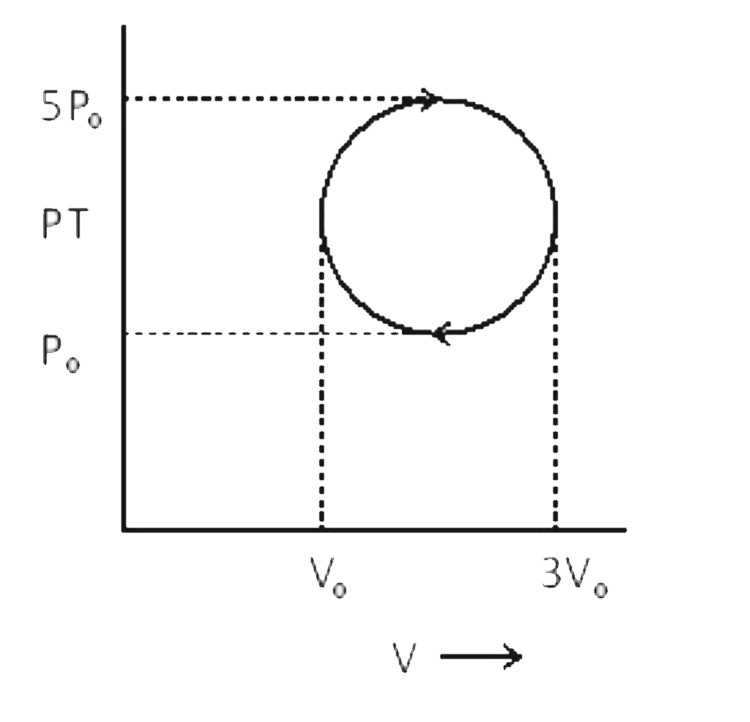
View SolutionP – V graph for a cyclic process is shown in figure . Work done is given by
View SolutionThe load versus elongation graph for four wires of the same material is shown in the figure. The thickest wire is represented by
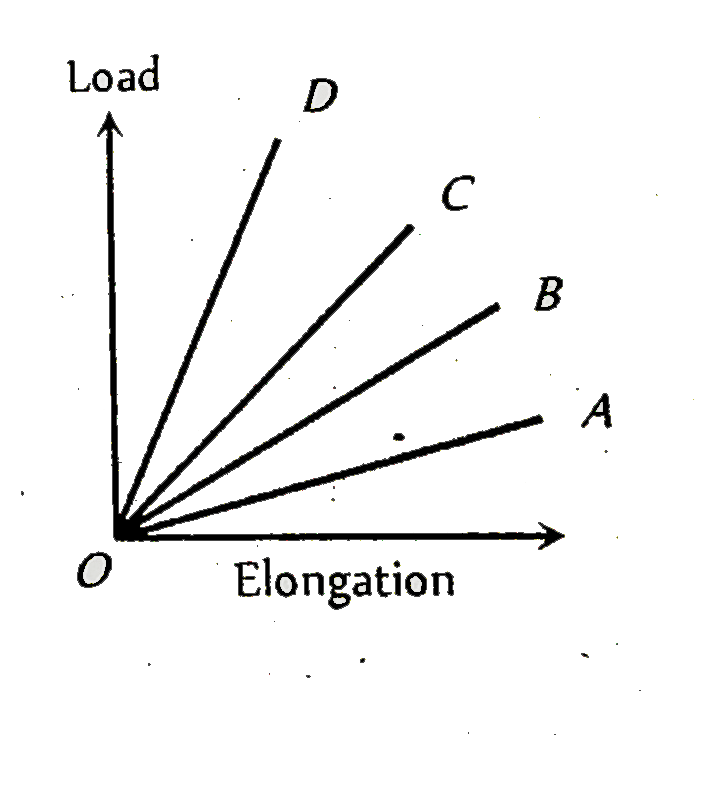
View SolutionThe velocity-time graph for a particle moving along X-axis is shown in the figure. The corresponding displacement-time graph is correctly shown by
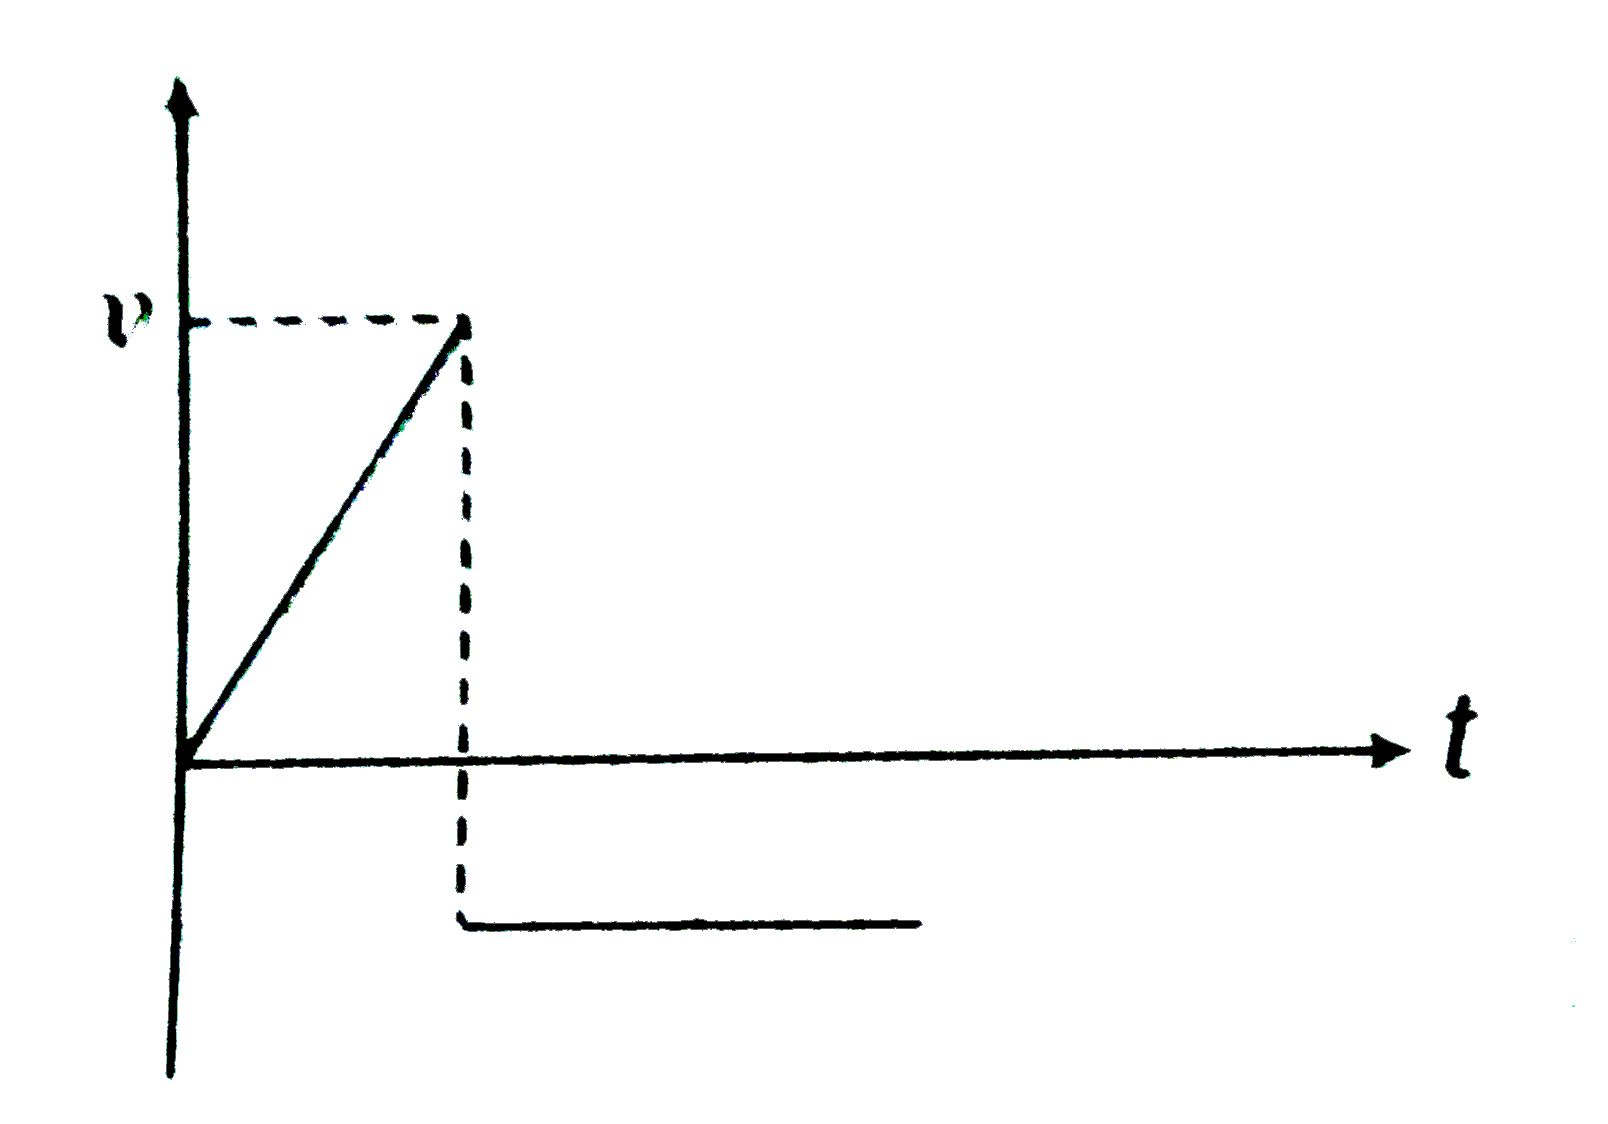
View Solutionv−t graph of a particle in SHM is as shown is figure. Choose the wrong option.
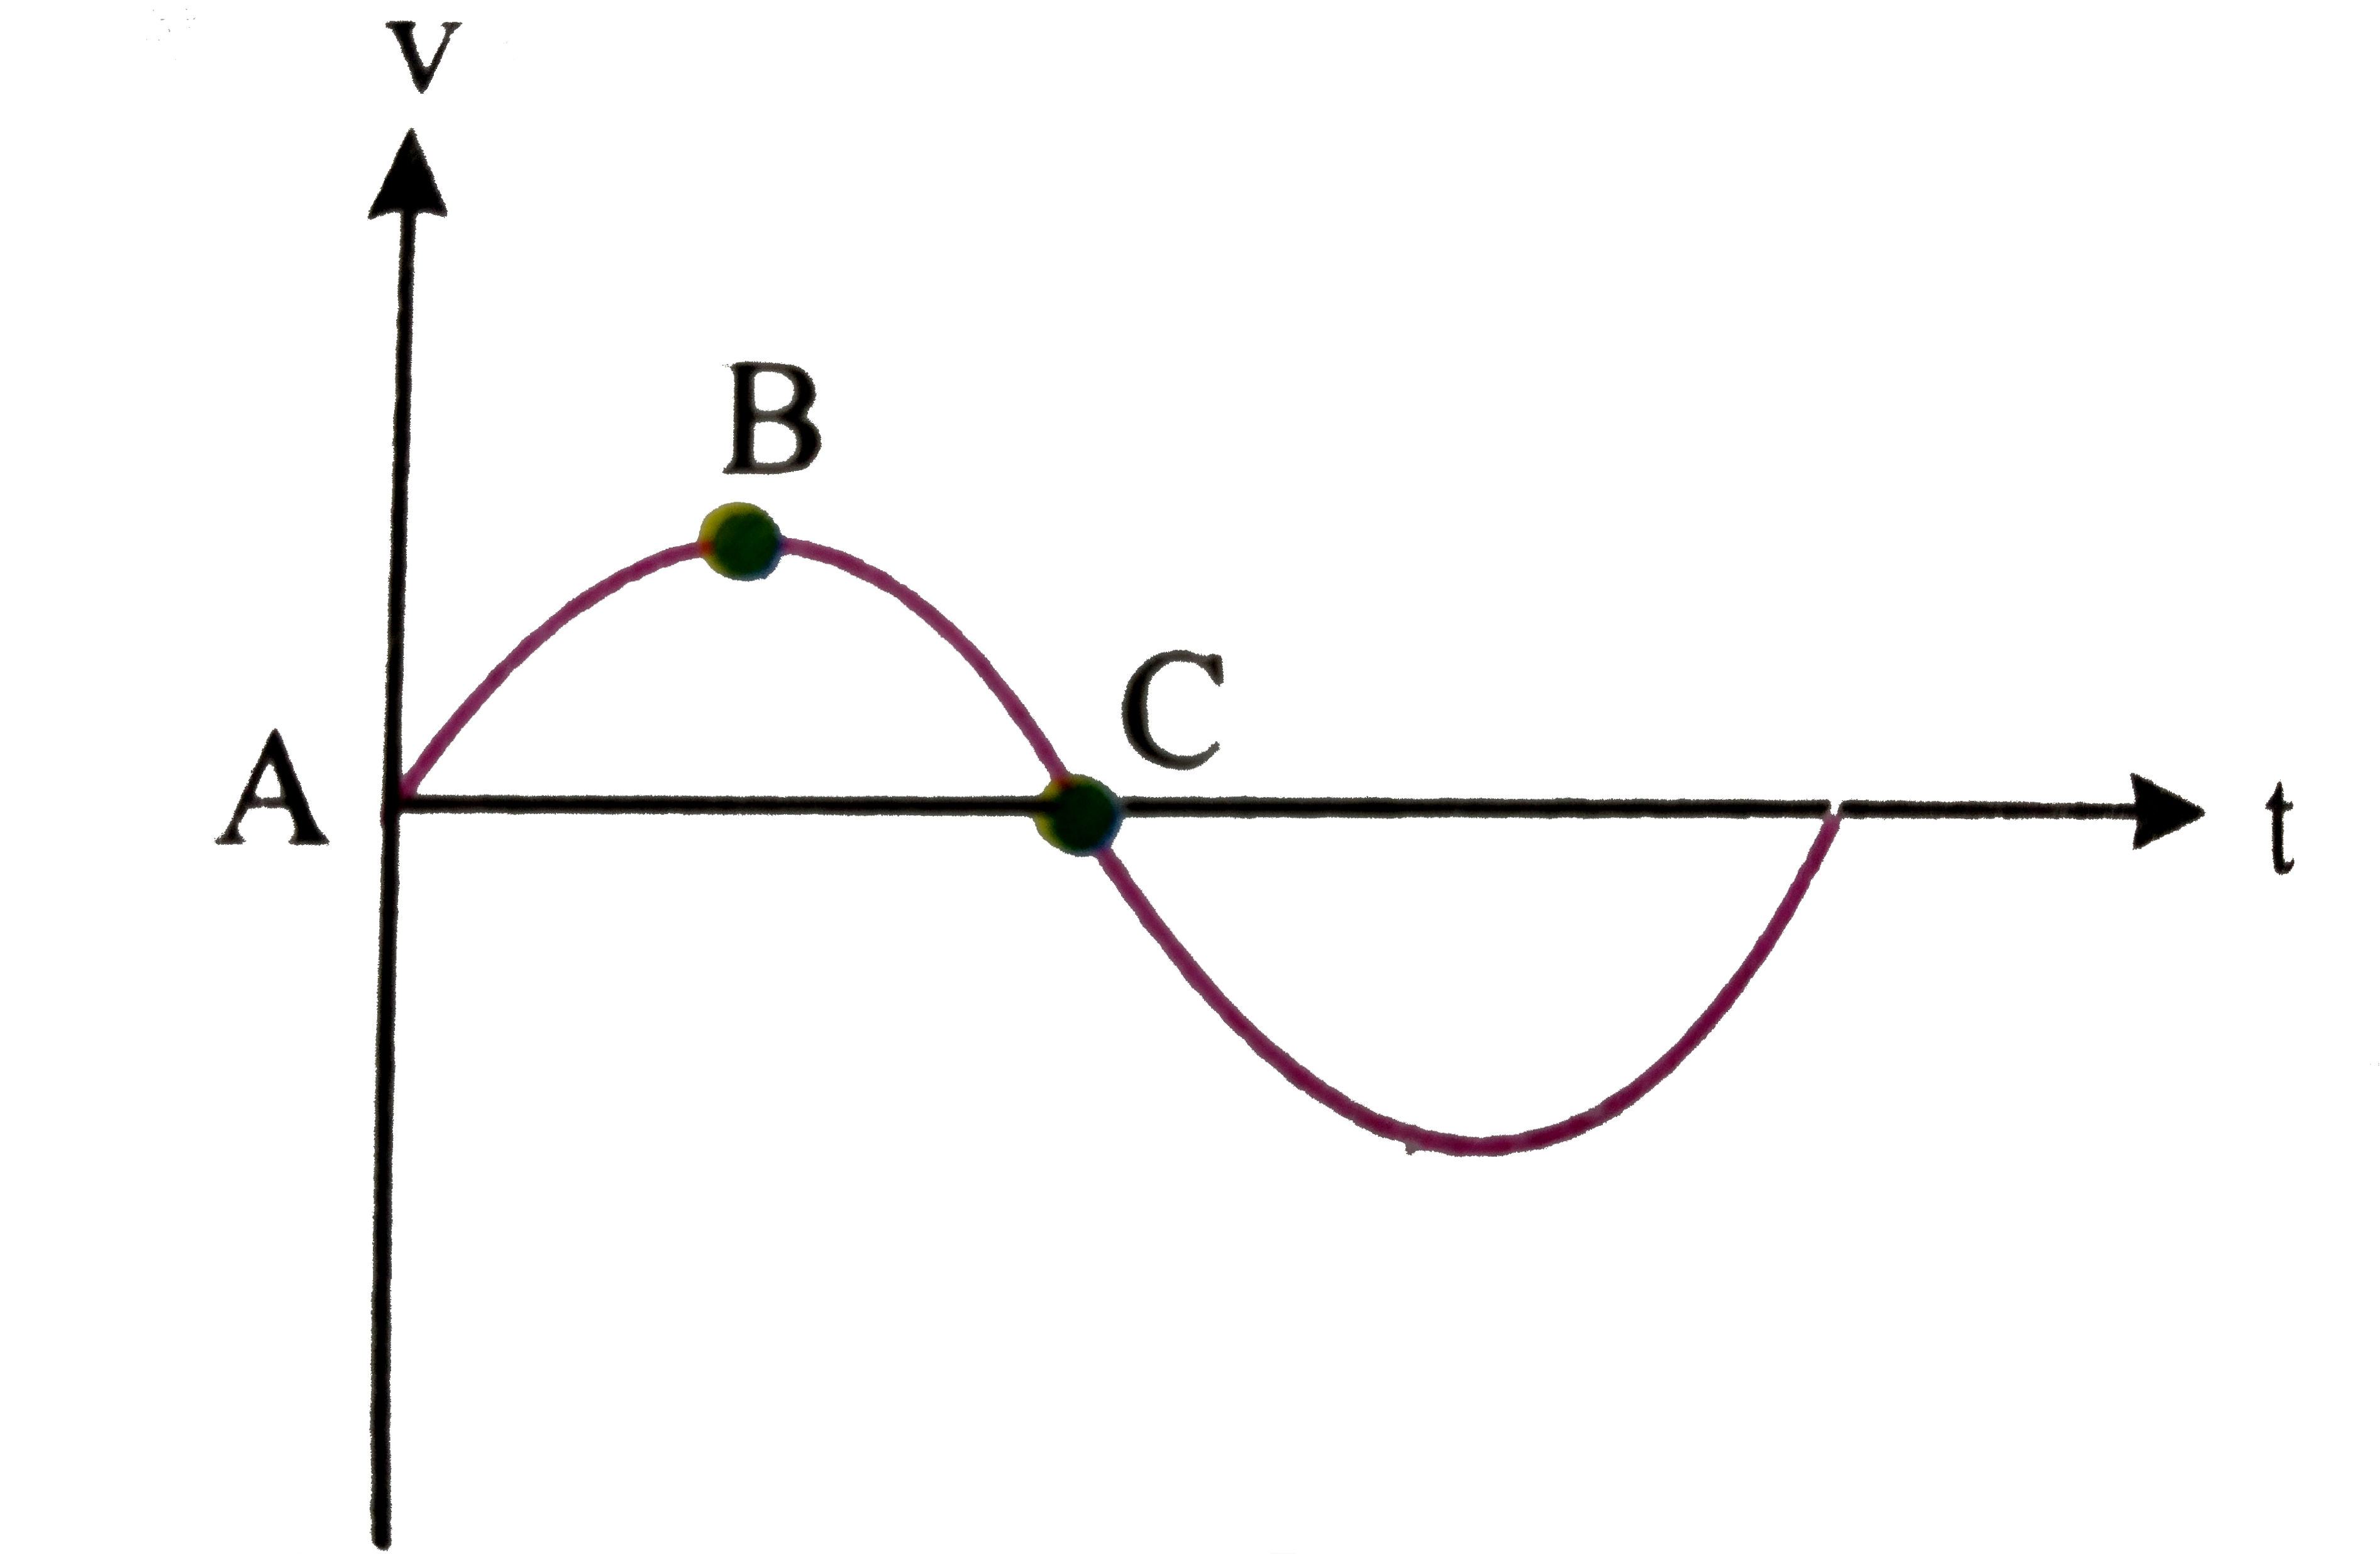
View Solution
