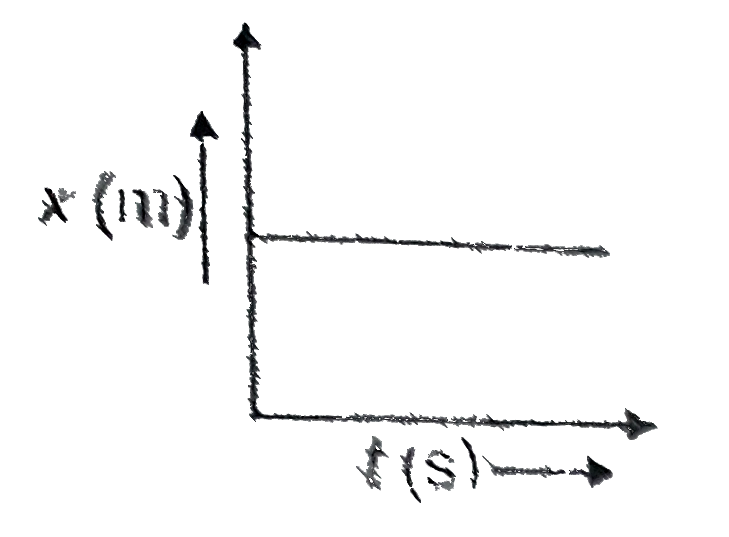
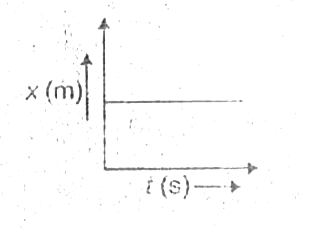
What will be the position-time graph of a city bus standing at rest at a depot ?
To determine the position-time graph of a city bus standing at rest at a depot, we can follow these steps:
1. Understand the Concept of Position-Time Graph:
- A position-time graph shows how the position of an object changes over time. The x-axis typically represents time, while the y-axis represents position.
2. Identify the Condition:
- The bus is at rest, meaning its position does not change over time. It remains stationary at the depot.
3. Determine the Position:
- Since the bus is standing still, its position remains constant. Let's assume the bus is at position x=0 meters at time t=0 seconds.
4. Plot the Graph:
- For every time interval (e.g., 0 seconds, 1 second, 2 seconds, etc.), the position of the bus will still be 0 meters.
- This means that no matter how much time passes, the position remains unchanged.
5. Draw the Graph:
- On the graph, plot points at (0,0), (1,0), (2,0), (3,0), etc.
- Connect these points to form a horizontal line along the x-axis at y=0.
6. Conclusion:
- The resulting graph will be a horizontal line, indicating that the position of the bus does not change over time.
Final Graph Representation:
- The position-time graph of a city bus standing at rest at a depot is a horizontal line along the time axis, indicating that the position remains constant at all times.
- A position-time graph shows how the position of an object changes over time. The x-axis typically represents time, while the y-axis represents position.
- The bus is at rest, meaning its position does not change over time. It remains stationary at the depot.
- Since the bus is standing still, its position remains constant. Let's assume the bus is at position x=0 meters at time t=0 seconds.
- For every time interval (e.g., 0 seconds, 1 second, 2 seconds, etc.), the position of the bus will still be 0 meters.
- This means that no matter how much time passes, the position remains unchanged.
- On the graph, plot points at (0,0), (1,0), (2,0), (3,0), etc.
- Connect these points to form a horizontal line along the x-axis at y=0.
- The resulting graph will be a horizontal line, indicating that the position of the bus does not change over time.
- The position-time graph of a city bus standing at rest at a depot is a horizontal line along the time axis, indicating that the position remains constant at all times.
Topper's Solved these Questions
Similar Questions
Knowledge Check
While walking down on the pavements of New York city. I notice that every 20 minute there is a city bus coming in the opposite direction and every 30 minute there is a city bus overtaking me from behind. What is the time gap between one city bus passing a stationary point known as Local Bus Stop beside the route and the immediately next city bus in the same direction passing the same stationary point?
A27 minB24 minC25 minDcan't be determined
Draw position vs time graph of uniform velocity.
View SolutionDifine uniform velocity of an object moving along a straight line. What will be the shapes of position-time and velocitu-time graphs of such a motion ?
View SolutionCan position-time graph have negative slope ?
View SolutionThe position-time graph of an object is given below. What is the velocity of the object?

View SolutionThe position-time graph of an object is given below. What is the velocity of the object?

View SolutionThe position - time graph of an object is given below. What is the velocity of the object?

View SolutionThe position - time graph of an object is given below. What is the velocity of the object?

View Solution
