Which graph represents the uniform acceleration


The correct Answer is:A
To determine which graph represents uniform acceleration, we can follow these steps:
Step 1: Understand Uniform Acceleration
Uniform acceleration means that the acceleration is constant over time. This implies that the velocity of the object changes at a constant rate.
Step 2: Relate Acceleration to Velocity
Since acceleration (a) is defined as the rate of change of velocity (v) with respect to time (t), we can express this mathematically as:
a=dvdt
For uniform acceleration, this means that a is a constant value (let's denote it as k):
dvdt=k
Step 3: Integrate to Find Velocity
Integrating both sides with respect to time gives us the velocity as a function of time:
dv=kdt
Integrating:
v=kt+C
where C is the constant of integration, which represents the initial velocity.
Step 4: Relate Velocity to Displacement
Now, we can relate velocity to displacement (s) using the formula:
v=dsdt
Substituting the expression for v:
dsdt=kt+C
Step 5: Integrate to Find Displacement
Integrating this equation with respect to time gives us the displacement:
ds=(kt+C)dt
Integrating:
s=k2t2+Ct+D
where D is another constant of integration.
Step 6: Identify the Form of the Displacement Equation
The displacement equation can be simplified to:
s=k2t2+Ct+D
This is a quadratic equation in t, which means that the graph of displacement (s) versus time (t) will be a parabola.
Step 7: Determine the Shape of the Graph
Since the coefficient of t2 is positive (k2), the parabola opens upwards. This indicates that the object is experiencing uniform acceleration.
Step 8: Compare with Given Options
Now, we compare the derived graph (upward-opening parabola) with the options provided in the question. The correct option will be the one that shows an upward-opening parabola.
Conclusion
The graph that represents uniform acceleration is the one that is a parabola opening upwards.
---
Uniform acceleration means that the acceleration is constant over time. This implies that the velocity of the object changes at a constant rate.
Since acceleration (a) is defined as the rate of change of velocity (v) with respect to time (t), we can express this mathematically as:
a=dvdt
For uniform acceleration, this means that a is a constant value (let's denote it as k):
dvdt=k
Integrating both sides with respect to time gives us the velocity as a function of time:
dv=kdt
Integrating:
v=kt+C
where C is the constant of integration, which represents the initial velocity.
Now, we can relate velocity to displacement (s) using the formula:
v=dsdt
Substituting the expression for v:
dsdt=kt+C
Integrating this equation with respect to time gives us the displacement:
ds=(kt+C)dt
Integrating:
s=k2t2+Ct+D
where D is another constant of integration.
The displacement equation can be simplified to:
s=k2t2+Ct+D
This is a quadratic equation in t, which means that the graph of displacement (s) versus time (t) will be a parabola.
Since the coefficient of t2 is positive (k2), the parabola opens upwards. This indicates that the object is experiencing uniform acceleration.
Now, we compare the derived graph (upward-opening parabola) with the options provided in the question. The correct option will be the one that shows an upward-opening parabola.
The graph that represents uniform acceleration is the one that is a parabola opening upwards.
Topper's Solved these Questions
- MOTION IN ONE DIMENSIONBOOK - ERRORLESS CHAPTER - MOTION IN ONE DIMENSIONEXERCISE - Assertion & Reason
30 Videos
- MOTION IN ONE DIMENSIONBOOK - ERRORLESS CHAPTER - MOTION IN ONE DIMENSIONEXERCISE - Motion In One Dimension
24 Videos
- MOTION IN ONE DIMENSIONBOOK - ERRORLESS CHAPTER - MOTION IN ONE DIMENSIONEXERCISE - Critical Thinking
19 Videos
- GRAVITATIONBOOK - ERRORLESS CHAPTER - GRAVITATIONEXERCISE - SET
27 Videos
- MOTION IN TWO DIMENSIONBOOK - ERRORLESS CHAPTER - MOTION IN TWO DIMENSIONEXERCISE - Exercise
319 Videos
Similar Questions
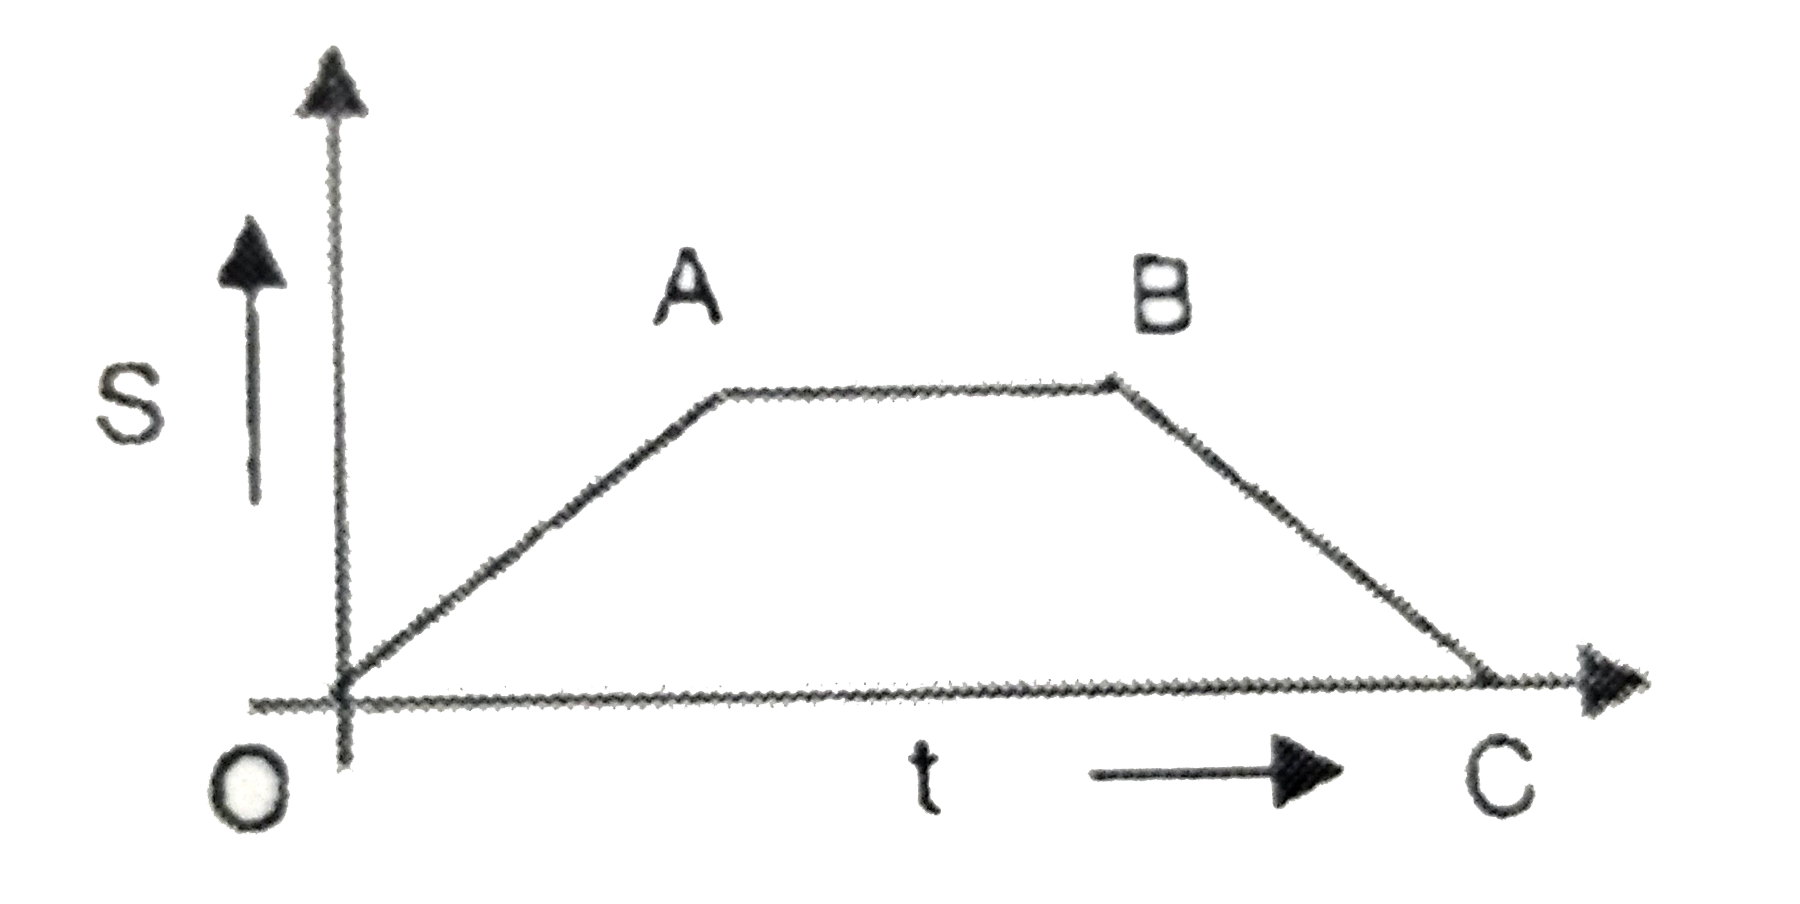
The displacement-time graph of a body is shown in the figure below. The part of the graph that represents the uniform motion of the body is _________
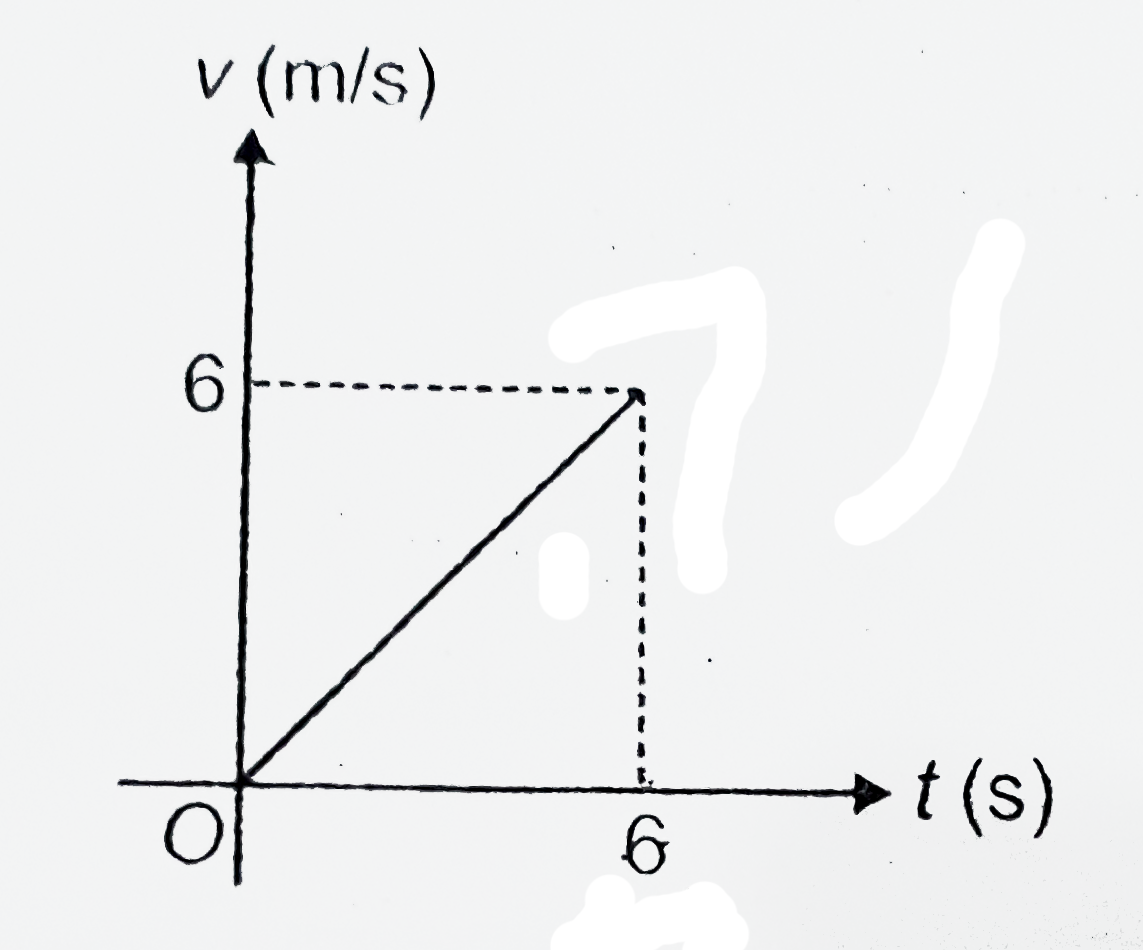
View SolutionGraphs are very useful to represent a physical situation. Various quantities can be easily represented on graphs and other quantites can be determined from the graph. For example the slope of velocity-time graph represents instantaneous acceleration. For a motion with constant acceleration slope of velocity-time graph is constant. If acceleration is changing with time, slope with change and thus velocity-time graph will be a non-linear curve. Further the area of velocity-time graph gives displacement.
For the given velocity-time graph the fisplacement of the object vetween t = 2 s to t = 4 s is
View Solution
Knowledge Check
Which graph represents positive acceleration ?
A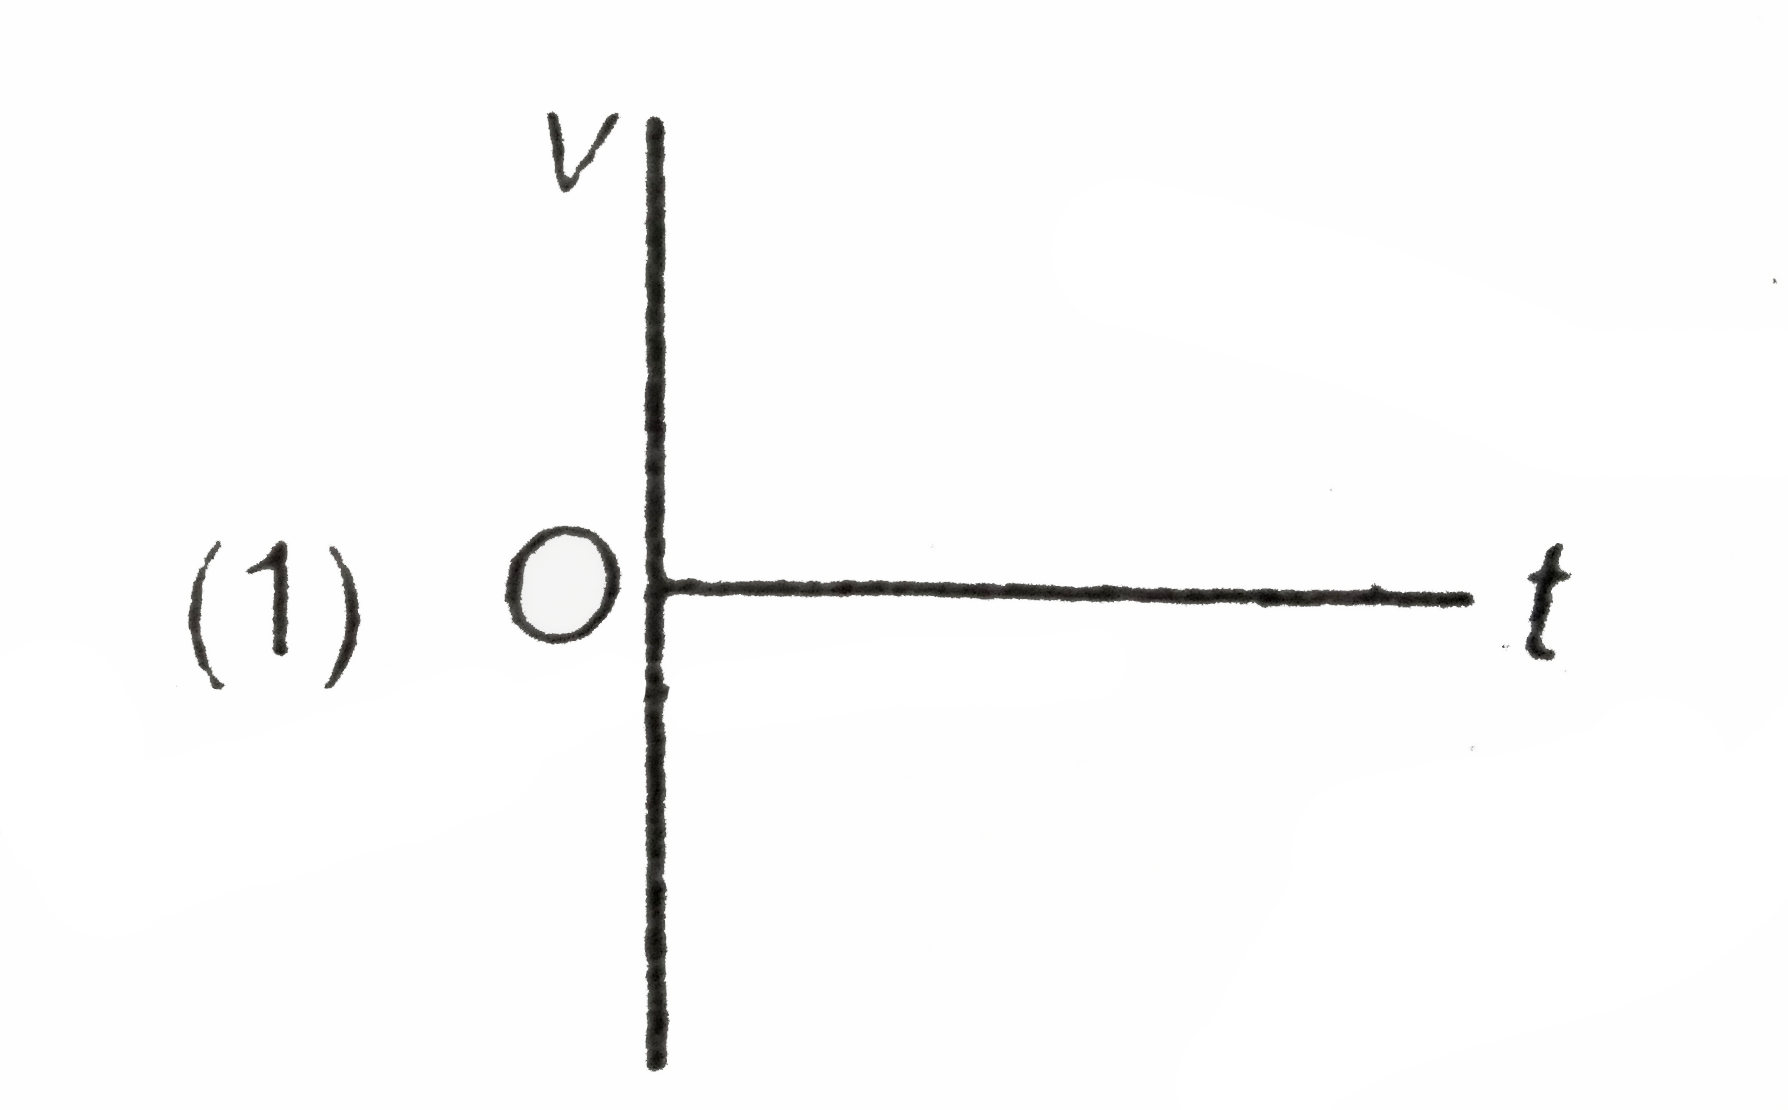 B
B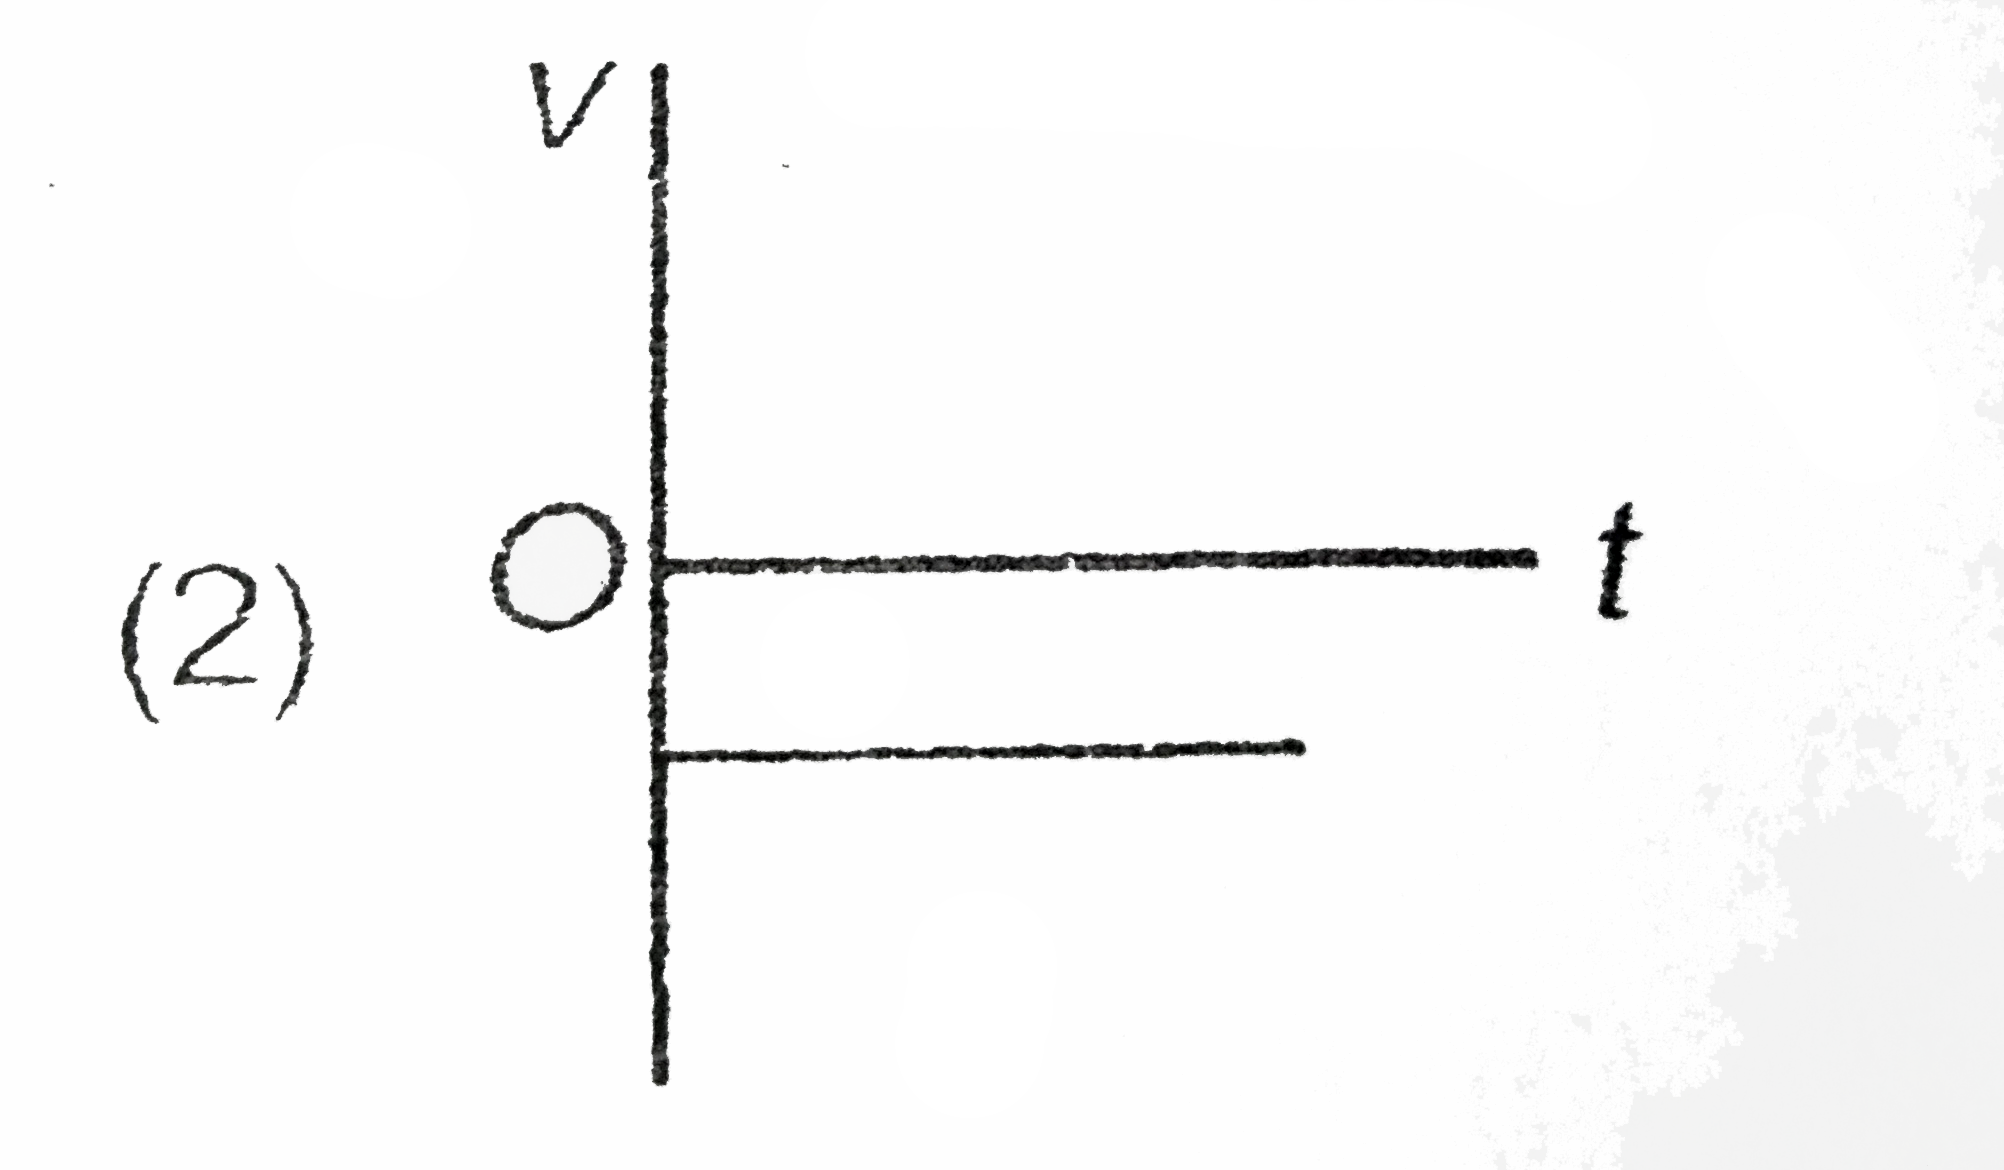 C
C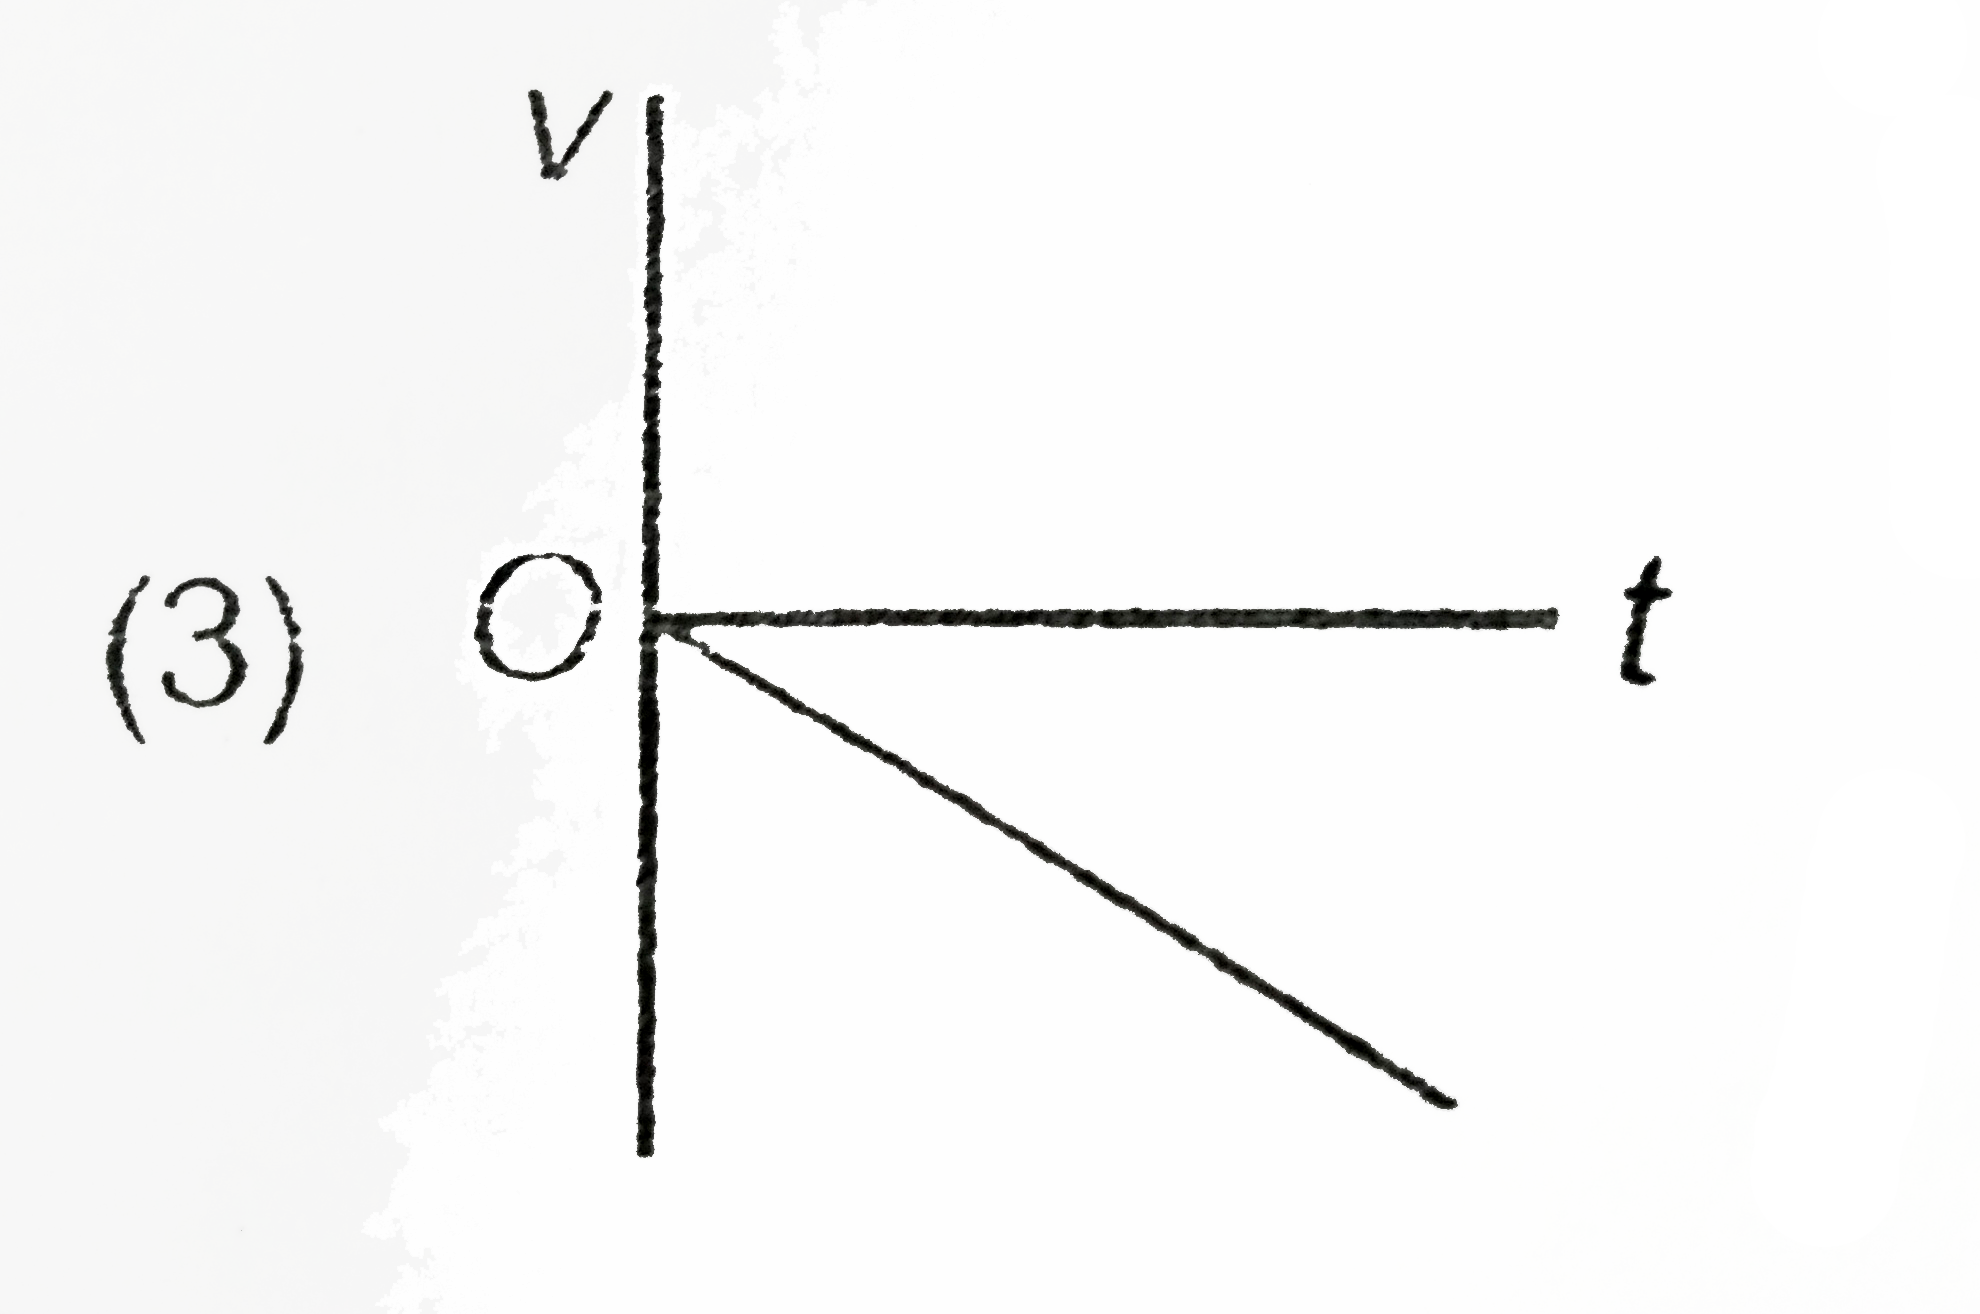 D
D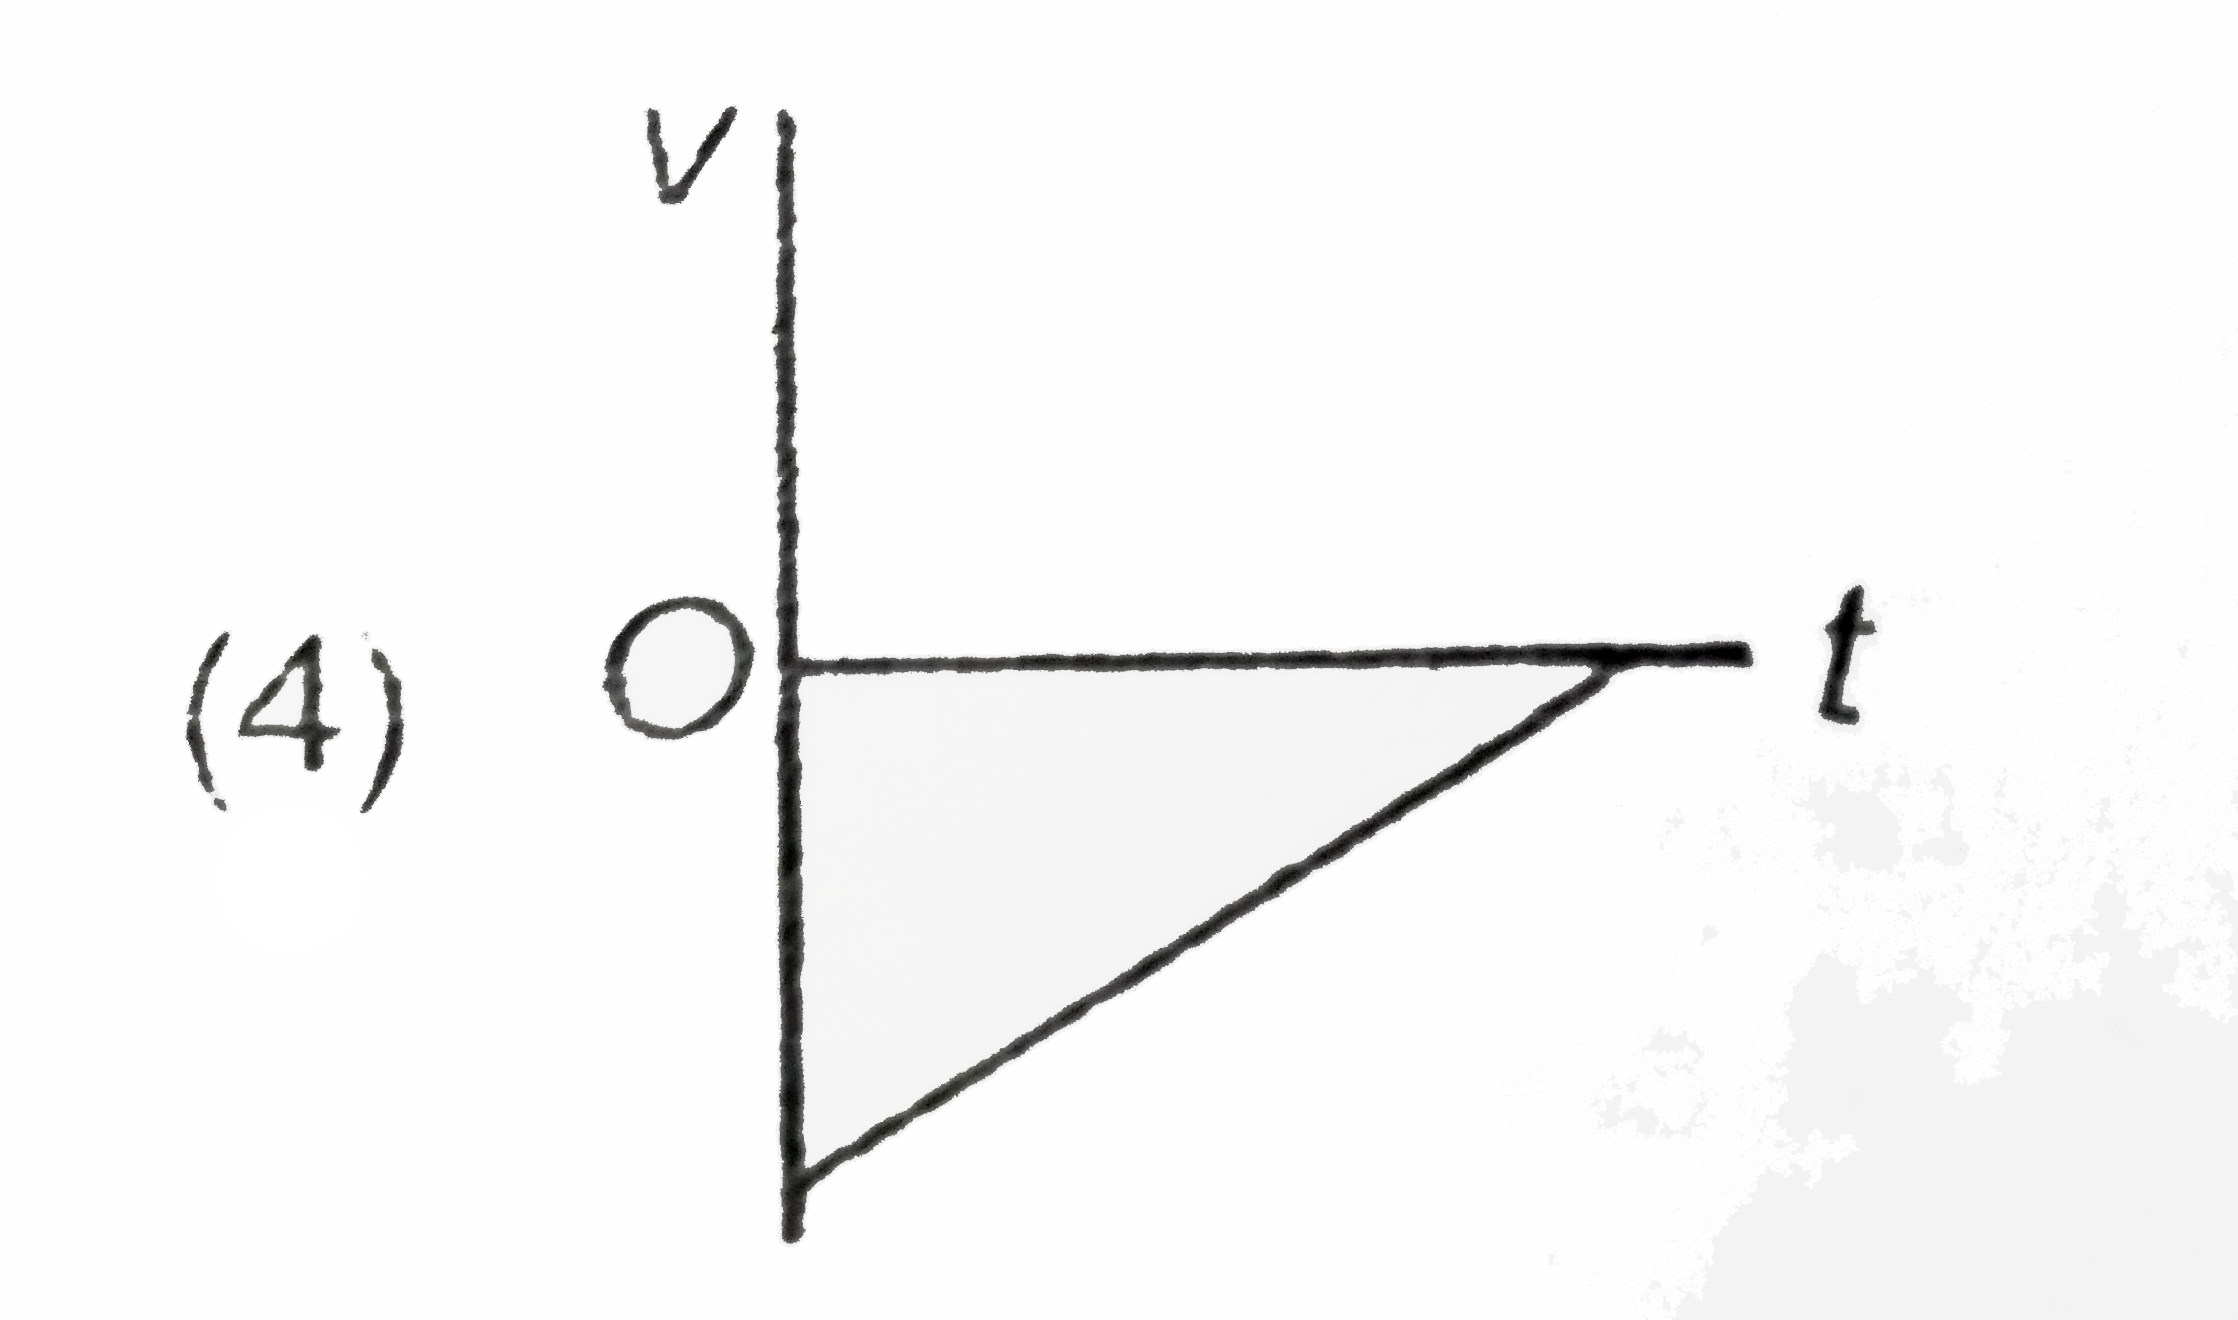
Which of the following graphs represent a uniformaly accelerated motion ?
A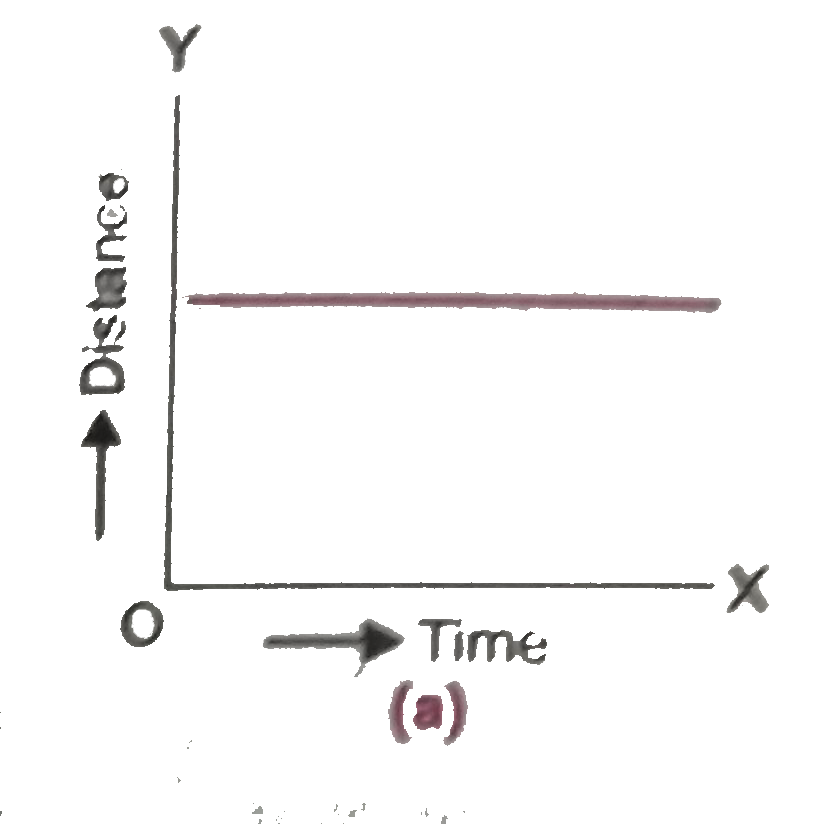 B
B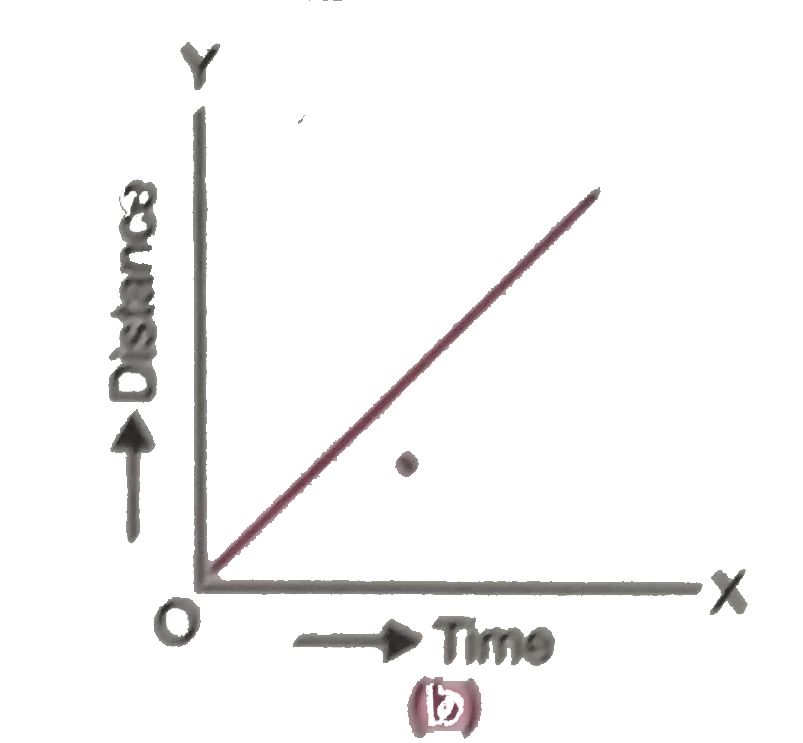 C
C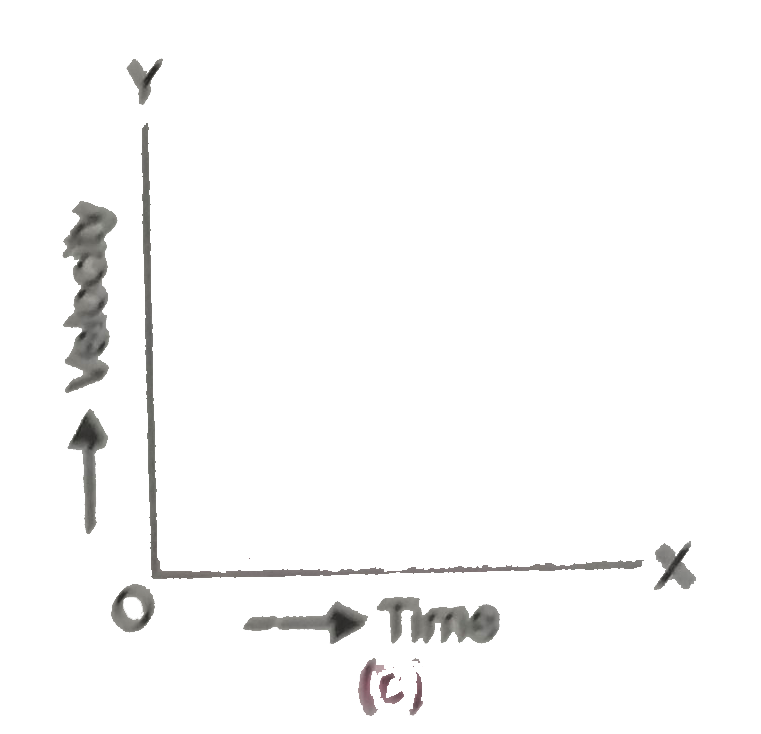 D
D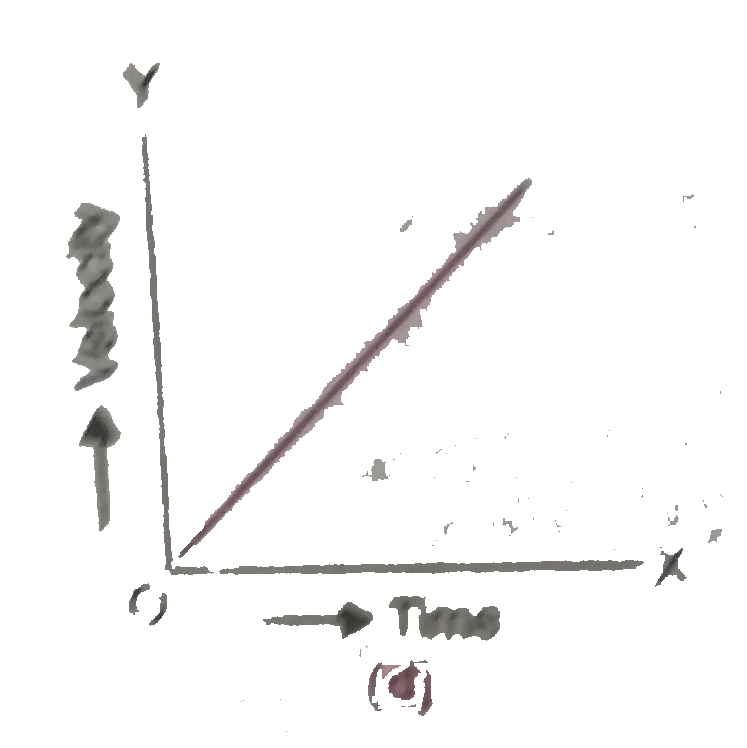
The graph below shws the velocity versus time graph for a body
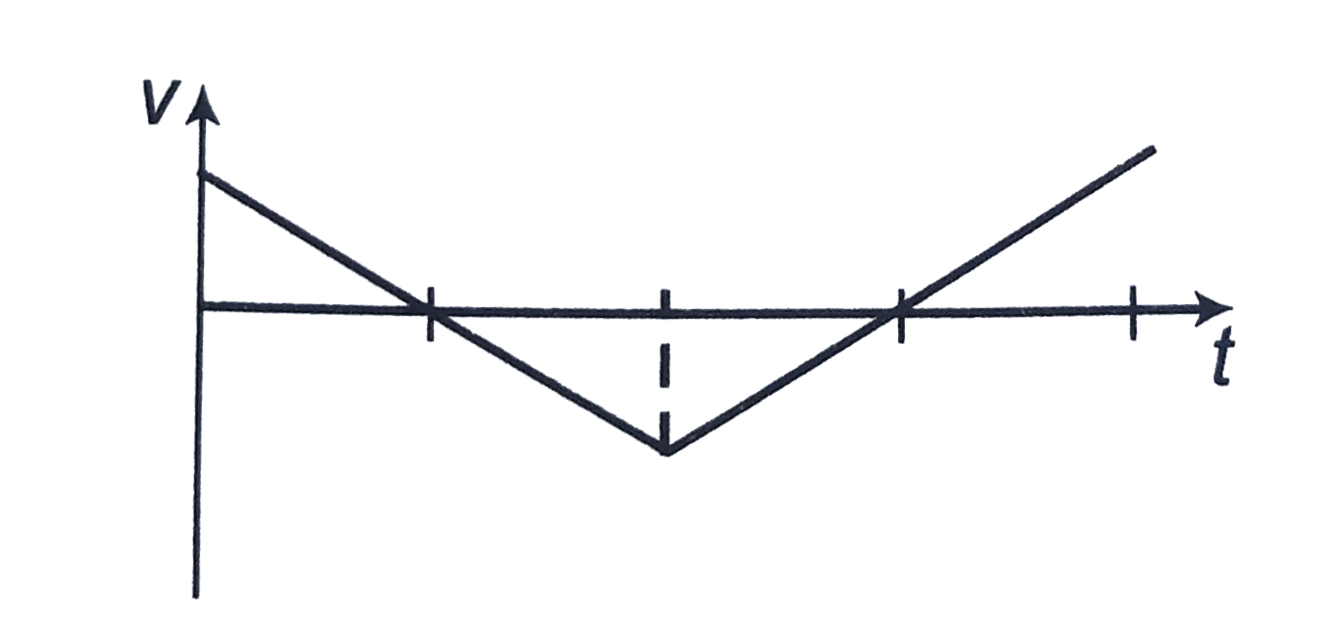
Which of the following graph represents the corresponding acceleration v//s time graph?A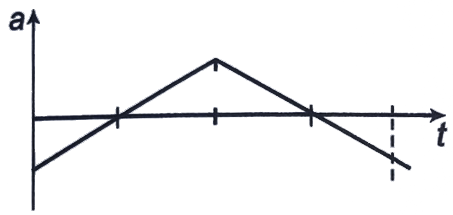 B
B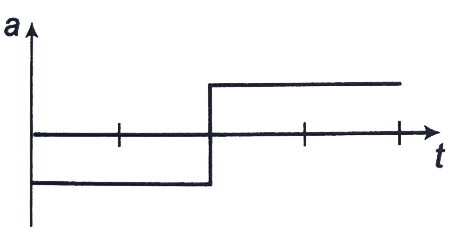 C
C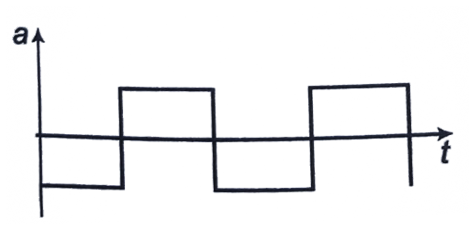 D
D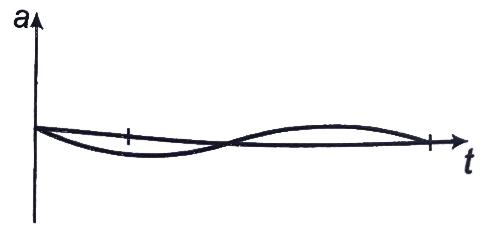
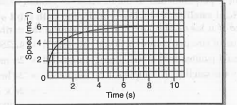
Speed - time graph for a car is show in the fig 1.13:Which part of the graph represents uniform motion of the car ?
View SolutionWhich of the following graph represents uniform motion
View SolutionGraphs are very useful to represent a physical situation. Various quantities can be easily represented on graphs and other quantites can be determined from the graph. For example the slope of velocity-time graph represents instantaneous acceleration. For a motion with constant acceleration slope of velocity-time graph is constant. If acceleration is changing with time, slope with change and thus velocity-time graph will be a non-linear curve. Further the area of velocity-time graph gives displacement.
The average velocity of the car for the entire trip is
View SolutionGraphs are very useful to represent a physical situation. Various quantities can be easily represented on graphs and other quantites can be determined from the graph. For example the slope of velocity-time graph represents instantaneous acceleration. For a motion with constant acceleration slope of velocity-time graph is constant. If acceleration is changing with time, slope with change and thus velocity-time graph will be a non-linear curve. Further the area of velocity-time graph gives displacement.
The correct relation between v0,a1,a2andt0 is
View SolutionWhich of the following velocity-time graphs (v−tgraph) represent uniform motion
View Solution
