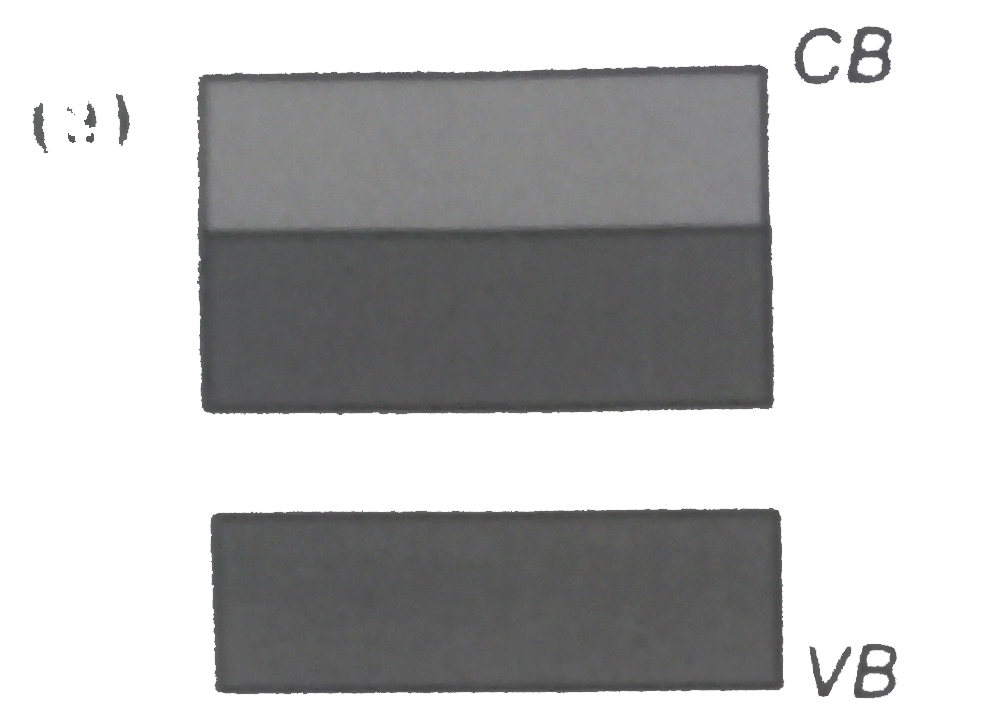
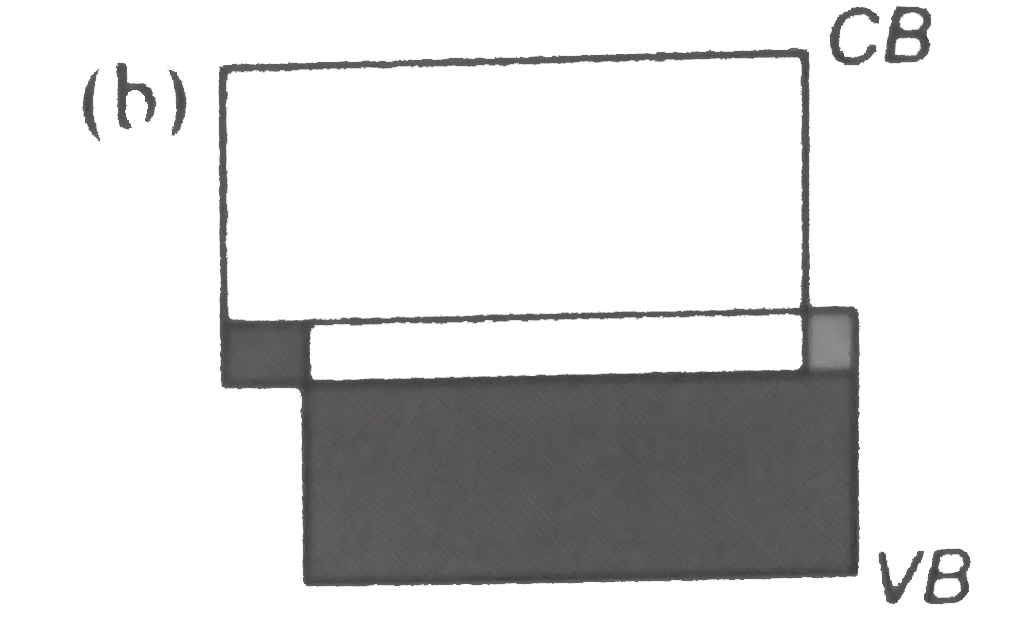
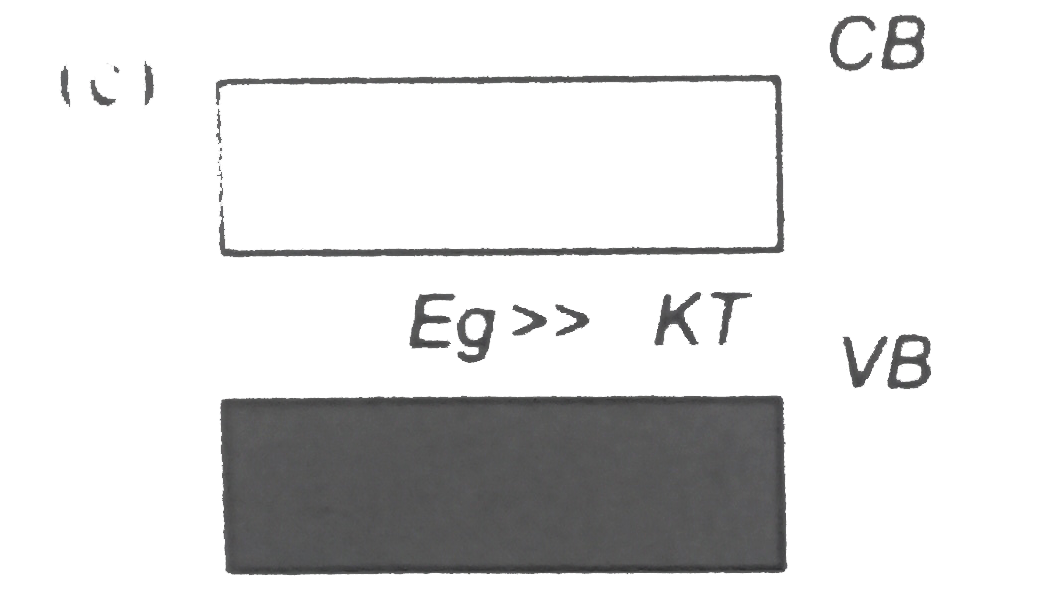
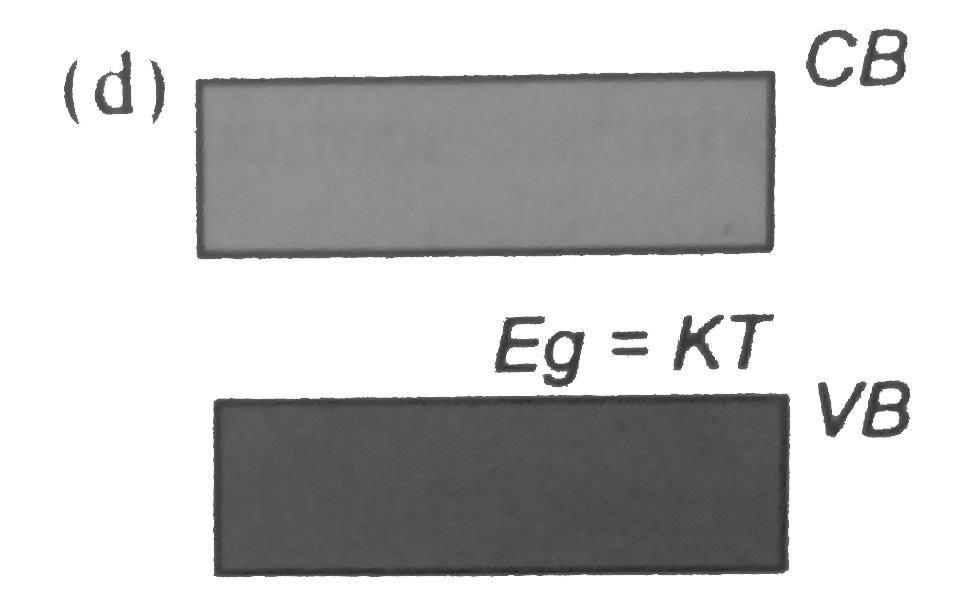
Which of the energy band diagrams shown in the figure corresponds to that of a semiconductor?
A
B
C
D
Video Solution
Text Solution
The correct Answer is:D
In semiconductors, forbidden energy gap between the velence band and conduction band is very small, almost equal to . Morever, velence band is completely filled where as conduction band is empty.
|
Topper's Solved these Questions
- SEMICONDUCTOR ELECTRONICSBOOK - A2ZCHAPTER - SEMICONDUCTOR ELECTRONICSEXERCISE - Junction Diode
57 Videos
- SEMICONDUCTOR ELECTRONICSBOOK - A2ZCHAPTER - SEMICONDUCTOR ELECTRONICSEXERCISE - Diode In Circuits
40 Videos
- SEMICONDUCTOR ELECTRONICSBOOK - A2ZCHAPTER - SEMICONDUCTOR ELECTRONICSEXERCISE - EXERCISE
29 Videos
- NUCLEAR PHYSICSBOOK - A2ZCHAPTER - NUCLEAR PHYSICSEXERCISE - Section D - Chapter End Test
29 Videos
- SOURCE AND EFFECT OF MAGNETIC FIELDBOOK - A2ZCHAPTER - SOURCE AND EFFECT OF MAGNETIC FIELDEXERCISE - Section D - Chapter End Test
30 Videos
Similar Questions
Knowledge Check
Which of the following energy band diagrams shows the N-type semiconductor?
A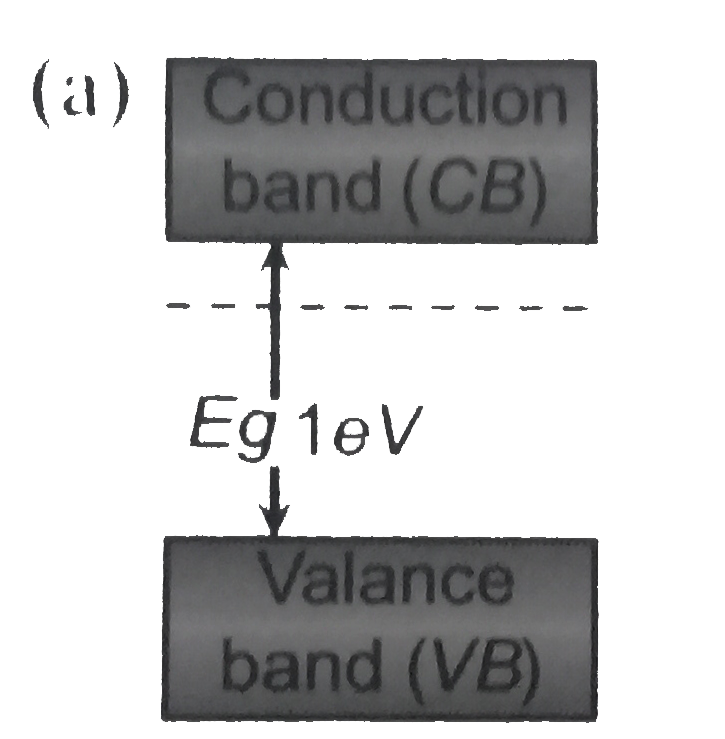 B
B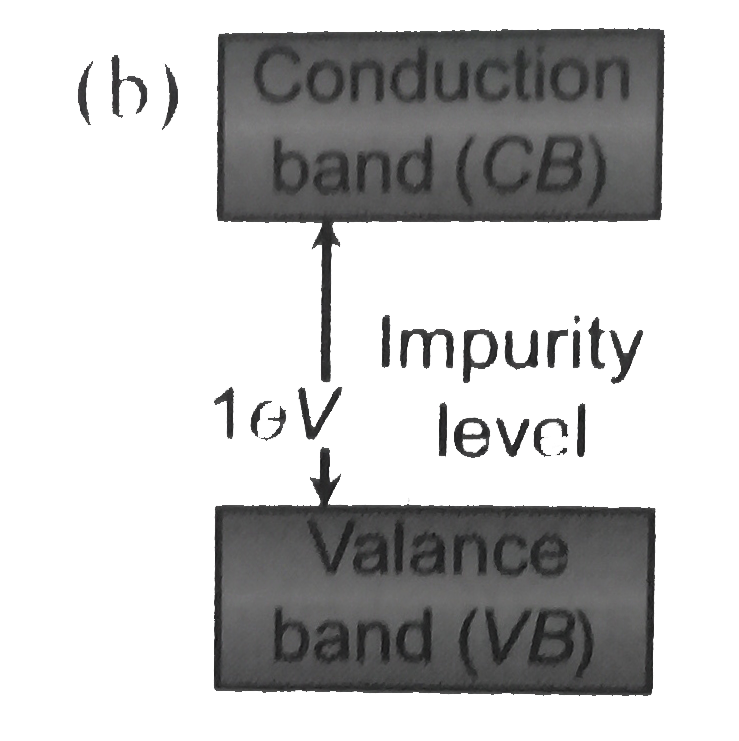 C
C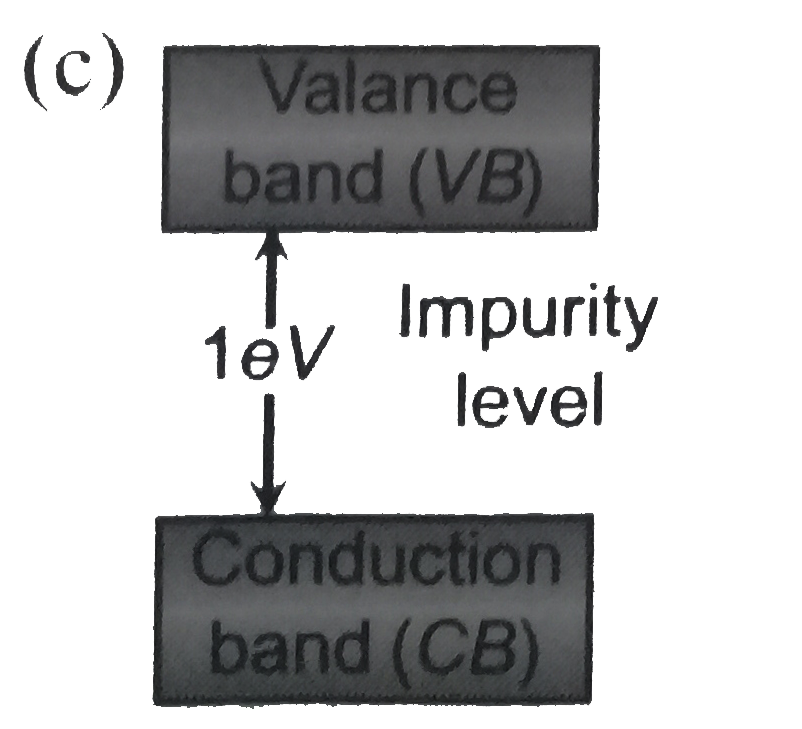 D
D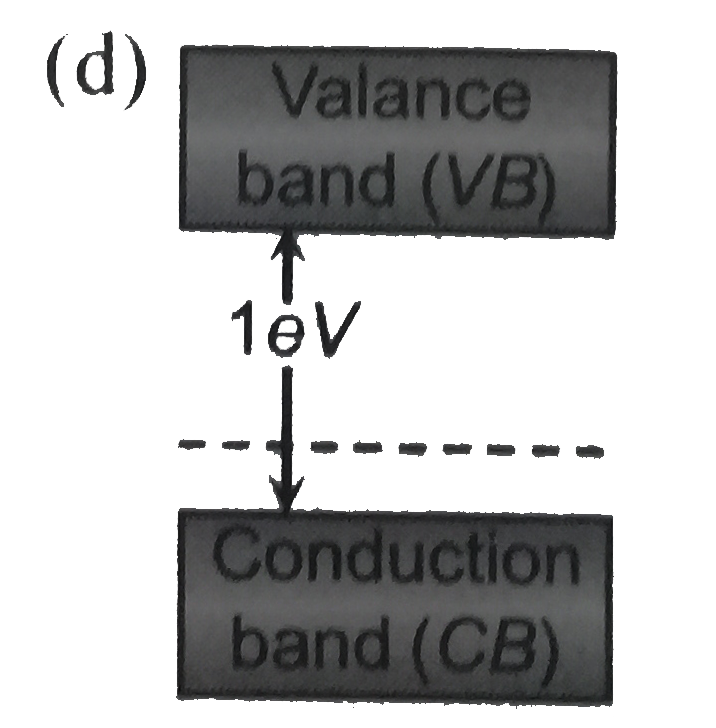
Which of the diagram shown in figures respresents variation of total mechanical energy of a pendulam oscillation in air as function of time?
A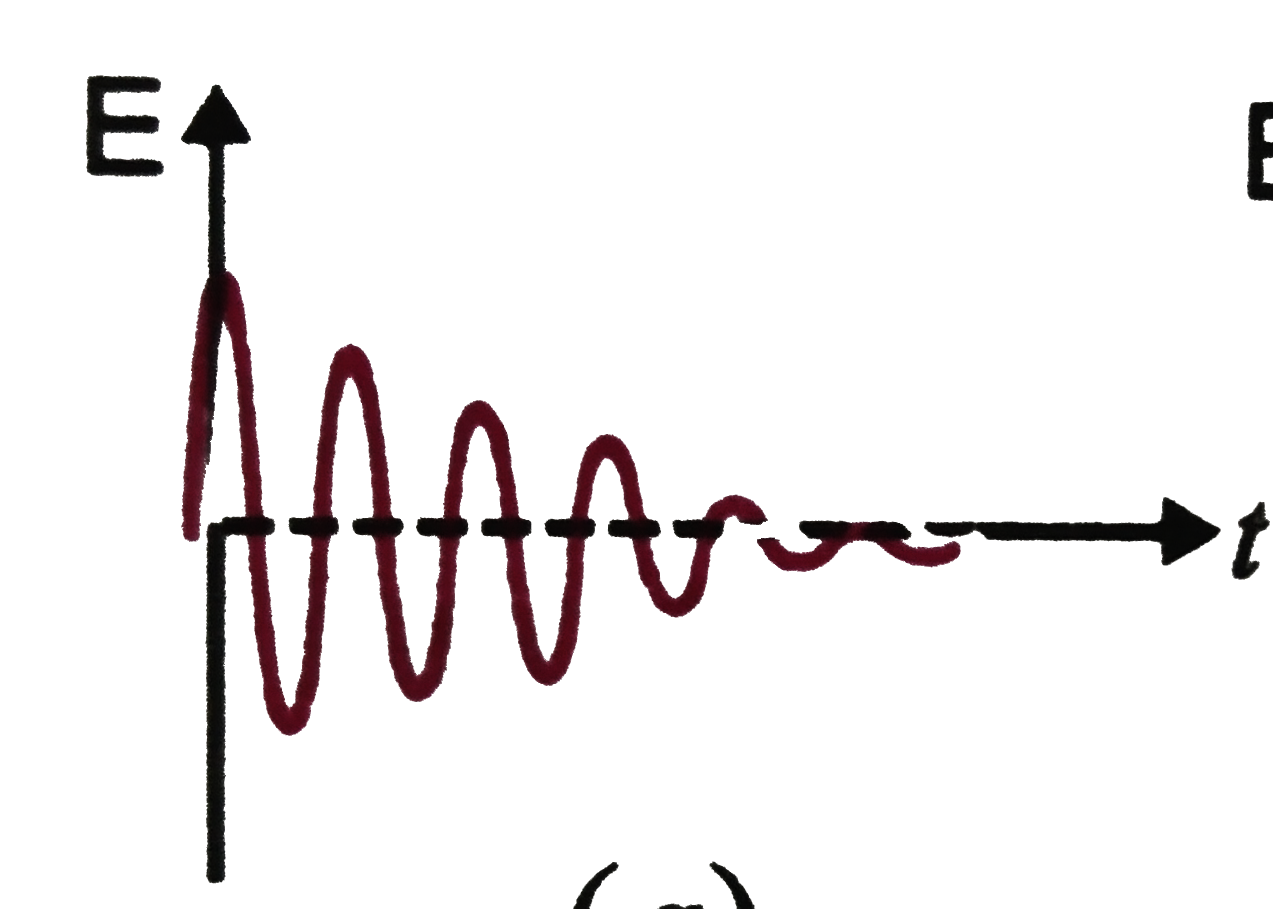 B
B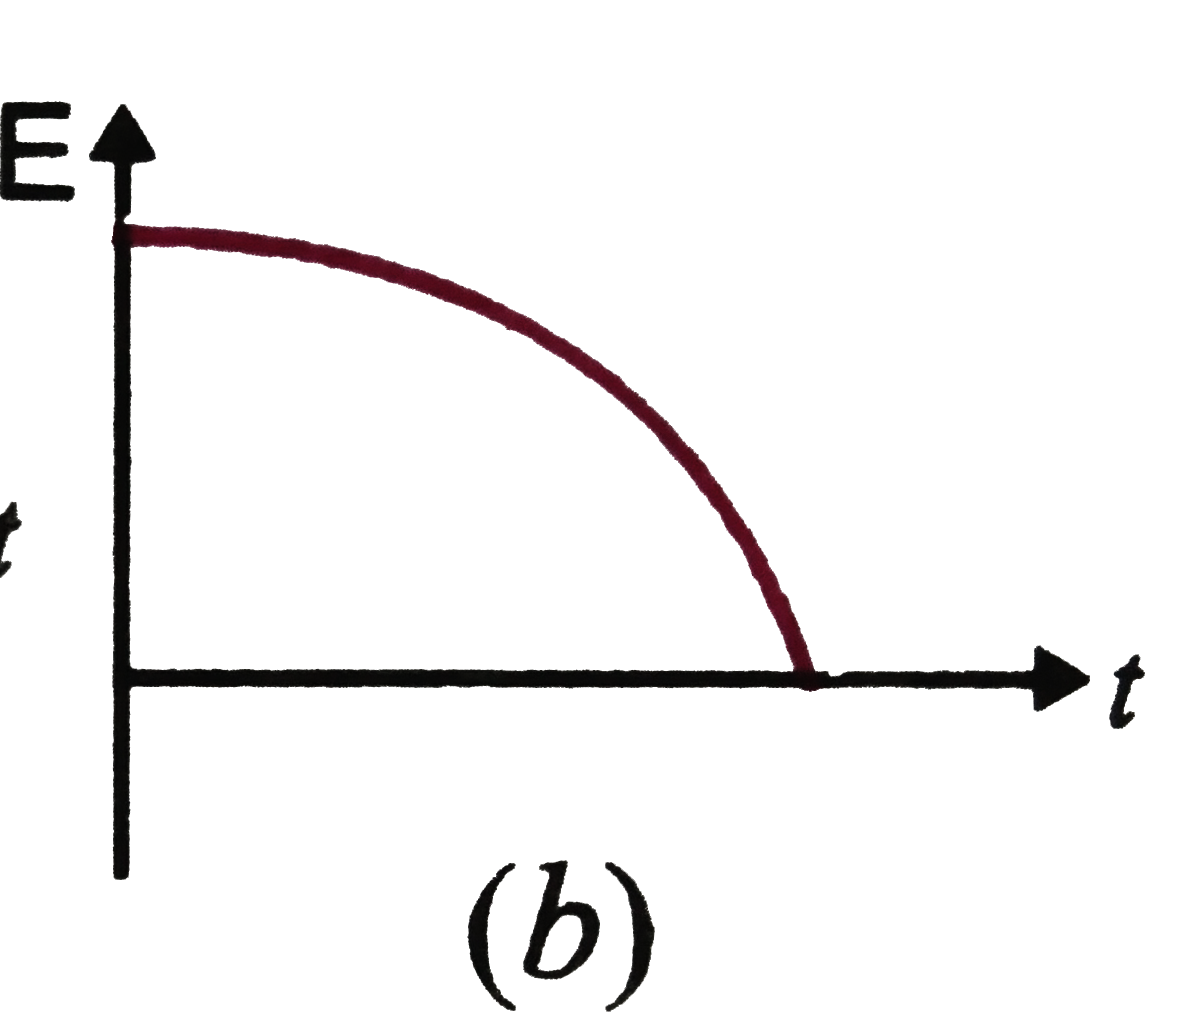 C
C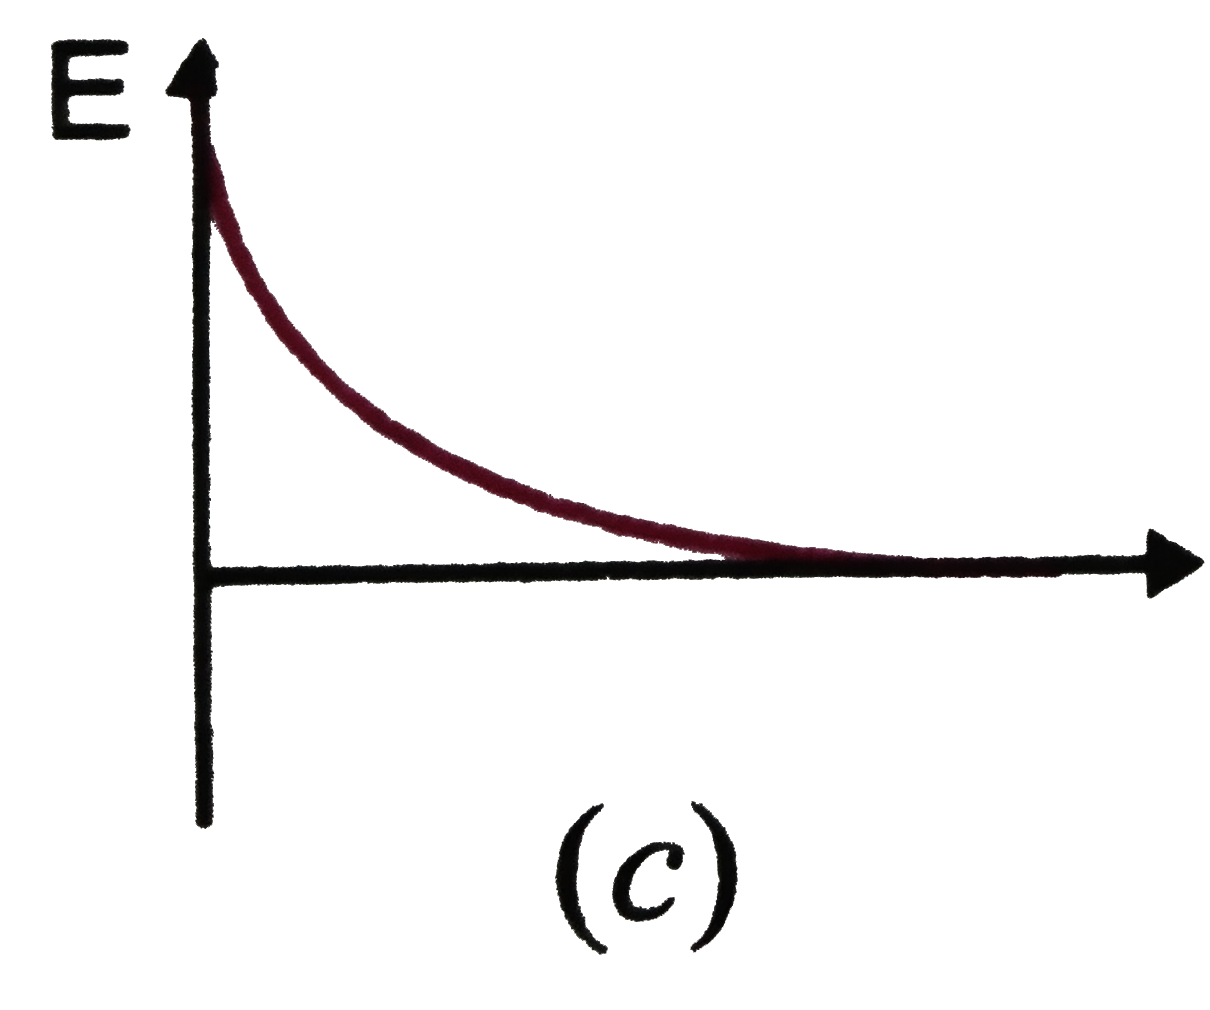 D
D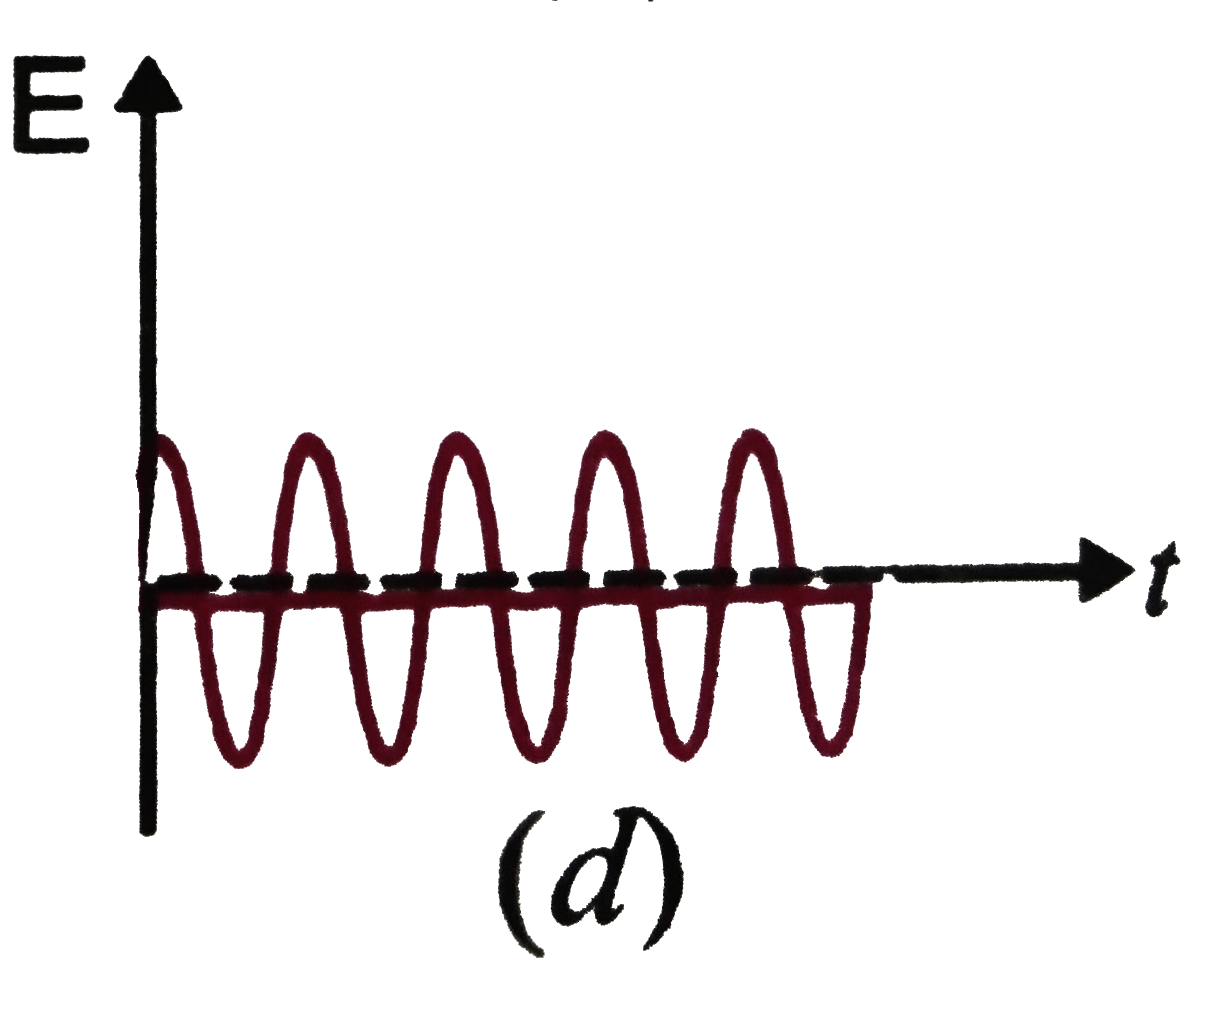
Which of the diagram shown in figures respresents variation of total mechanical energy of a pendulam oscillation in air as function of time?
A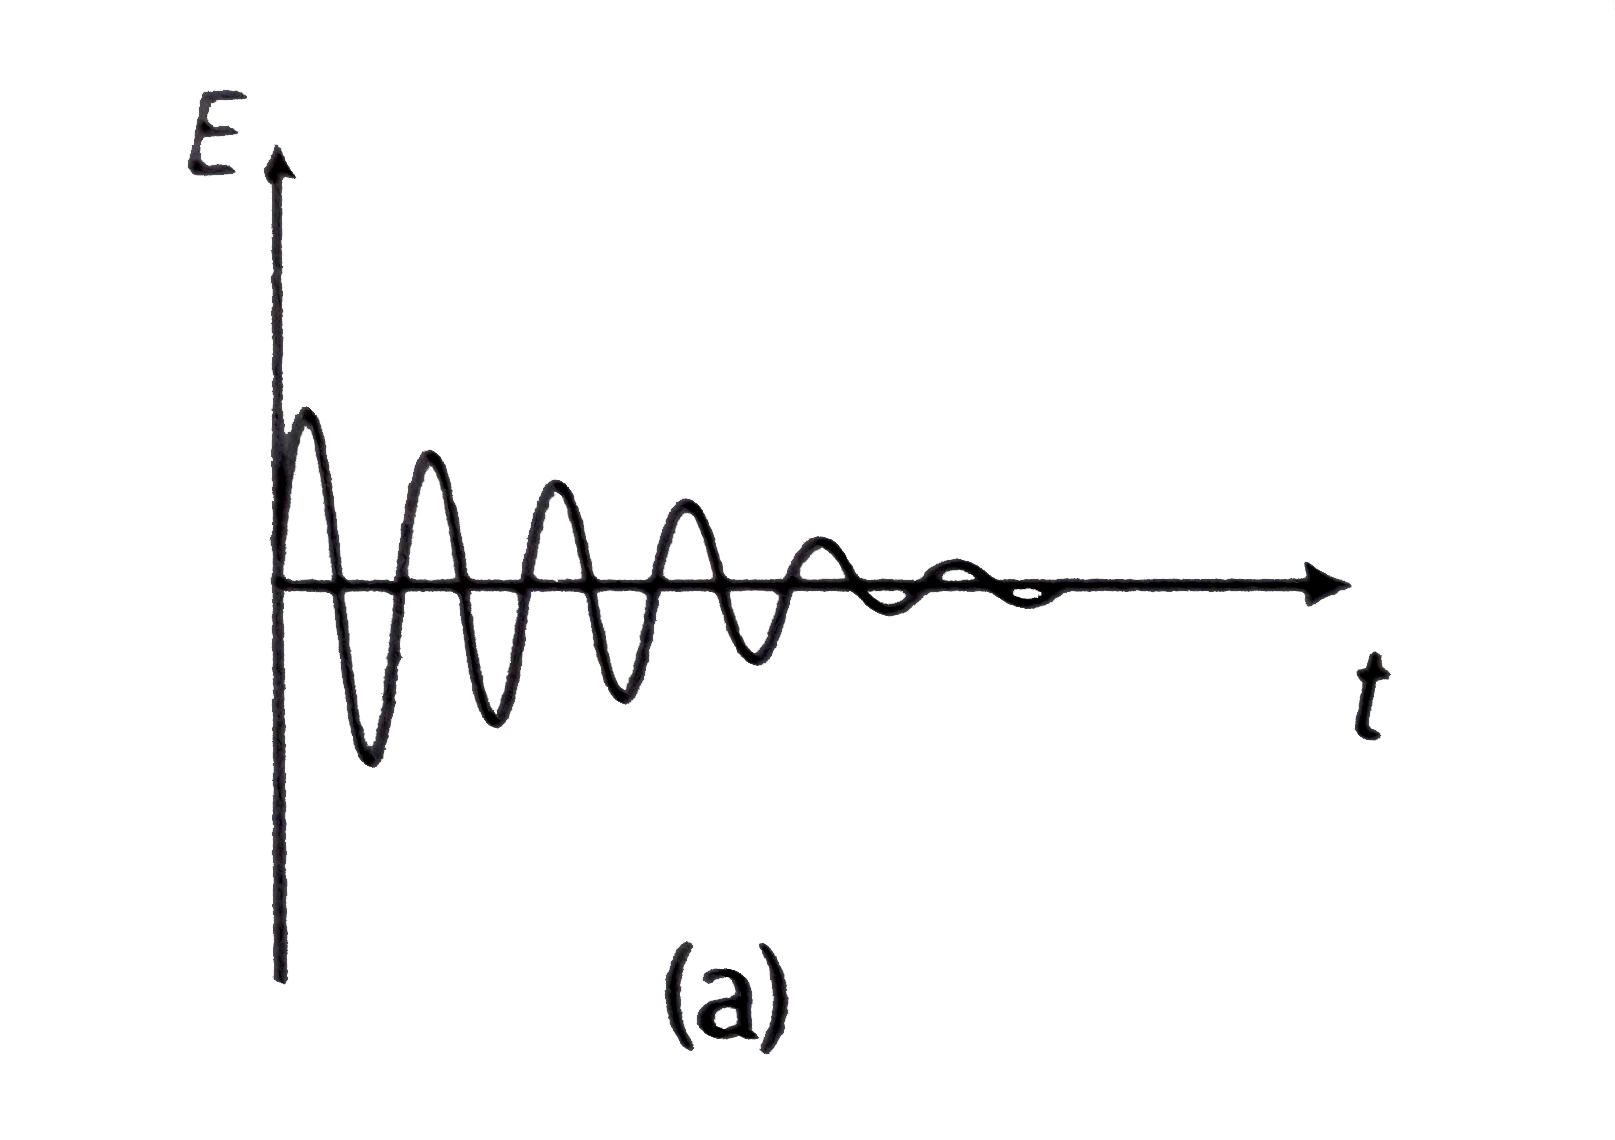 B
B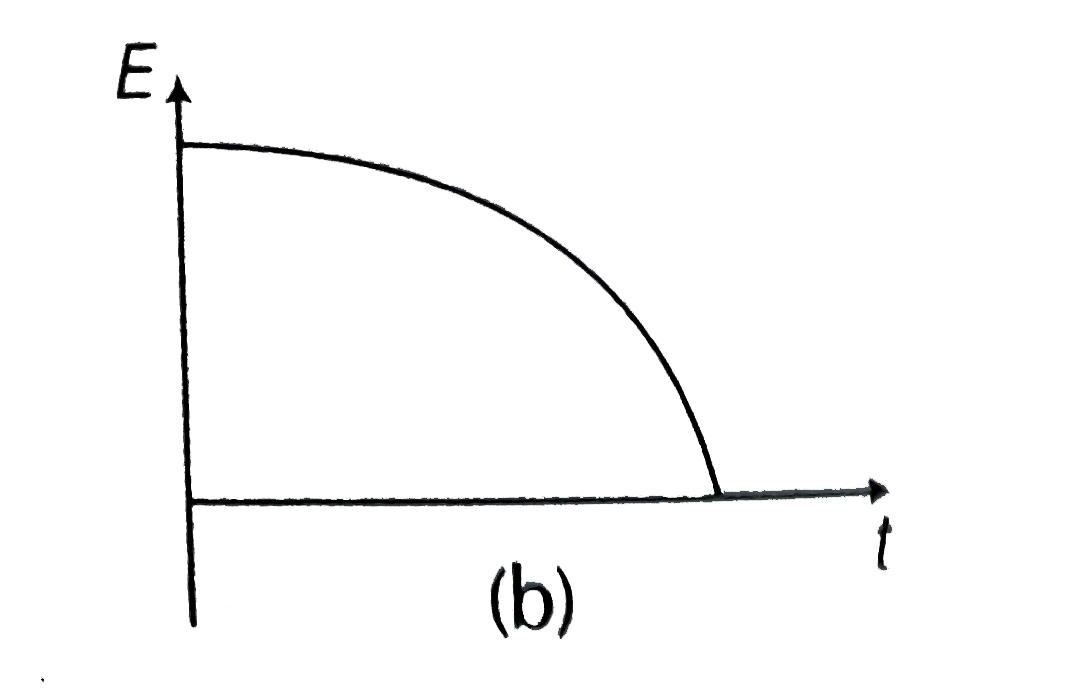 C
C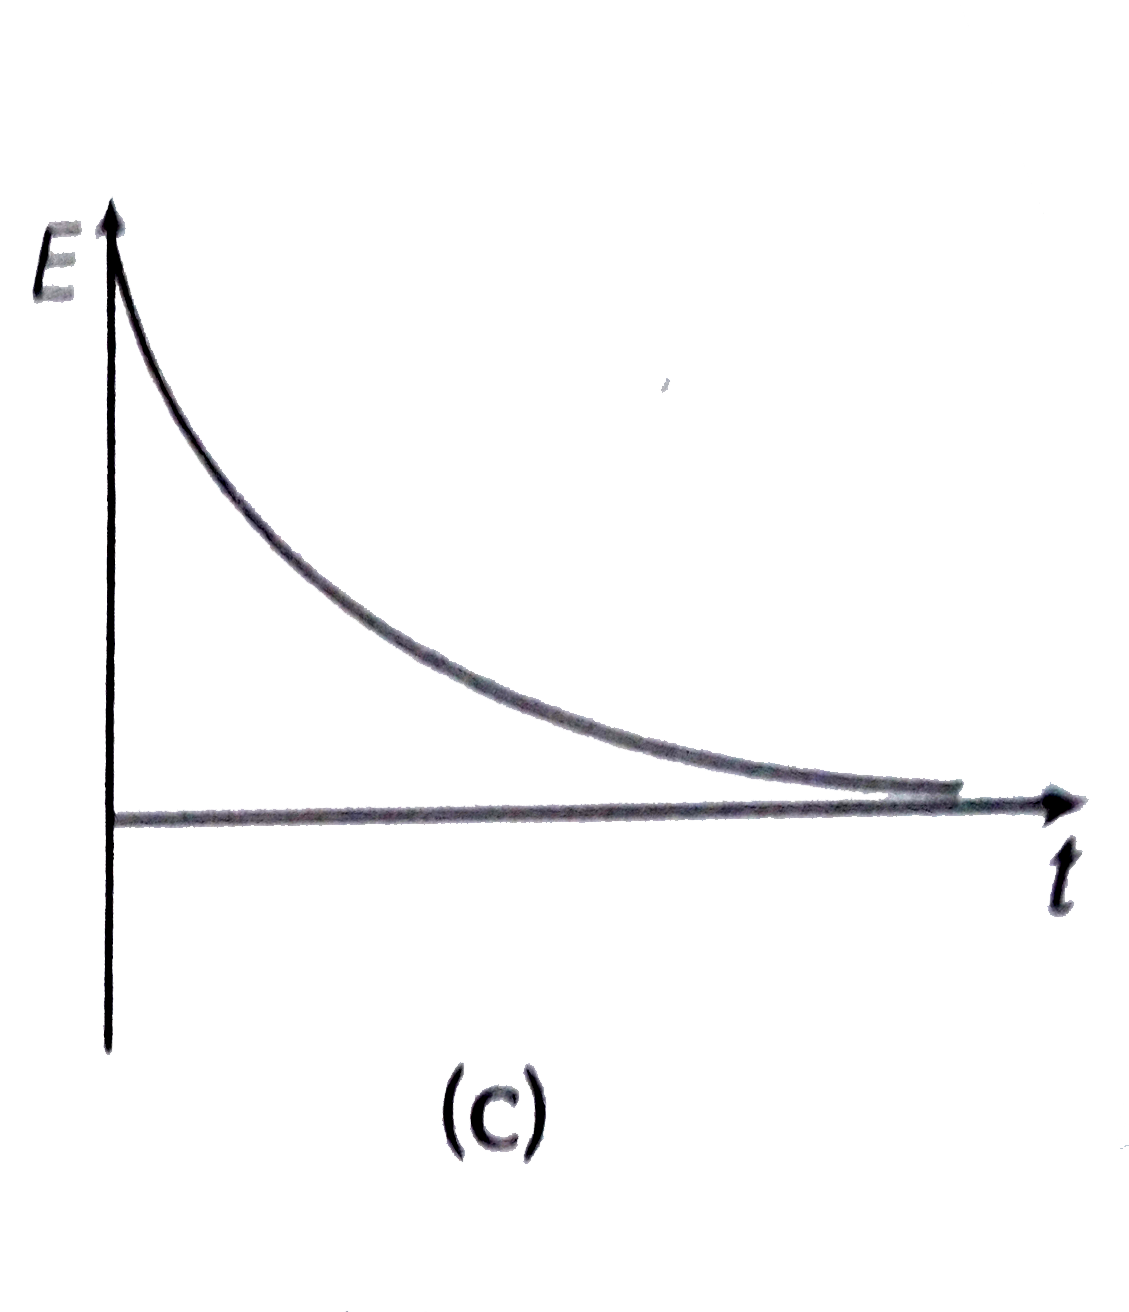 D
D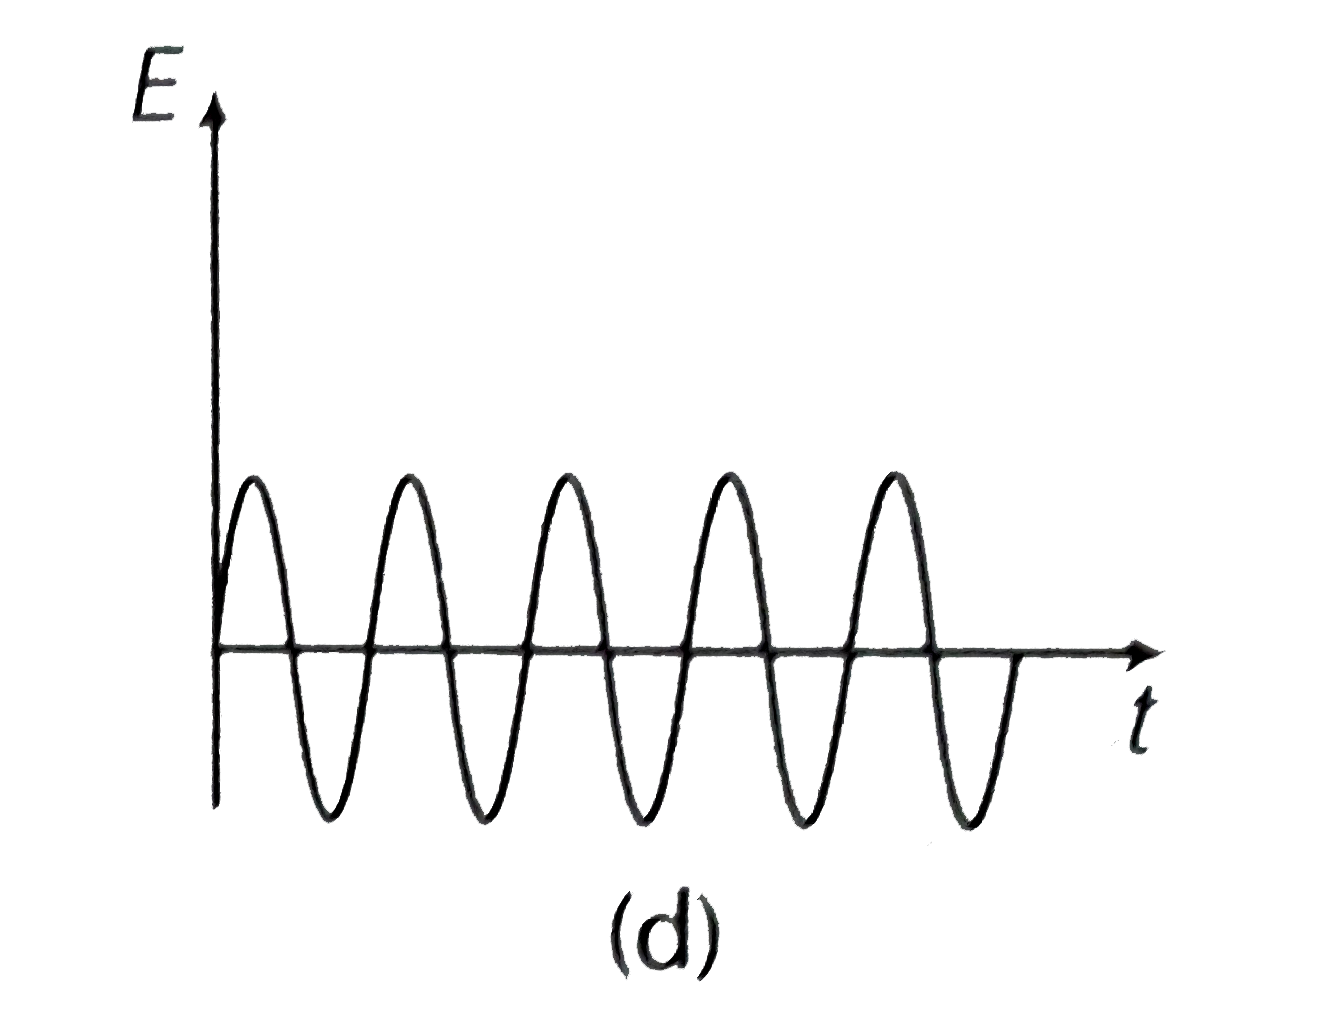
Draw the energy band diagram of a p-type semiconductor. Deduce an expression for the conductivity of a p-type semiconductor.
View SolutionWith a neat labelled energy band diagram, explain the working of an LED.
View SolutionP−T diagram is shown in Fig. Choose the corresponding V−T diagram.
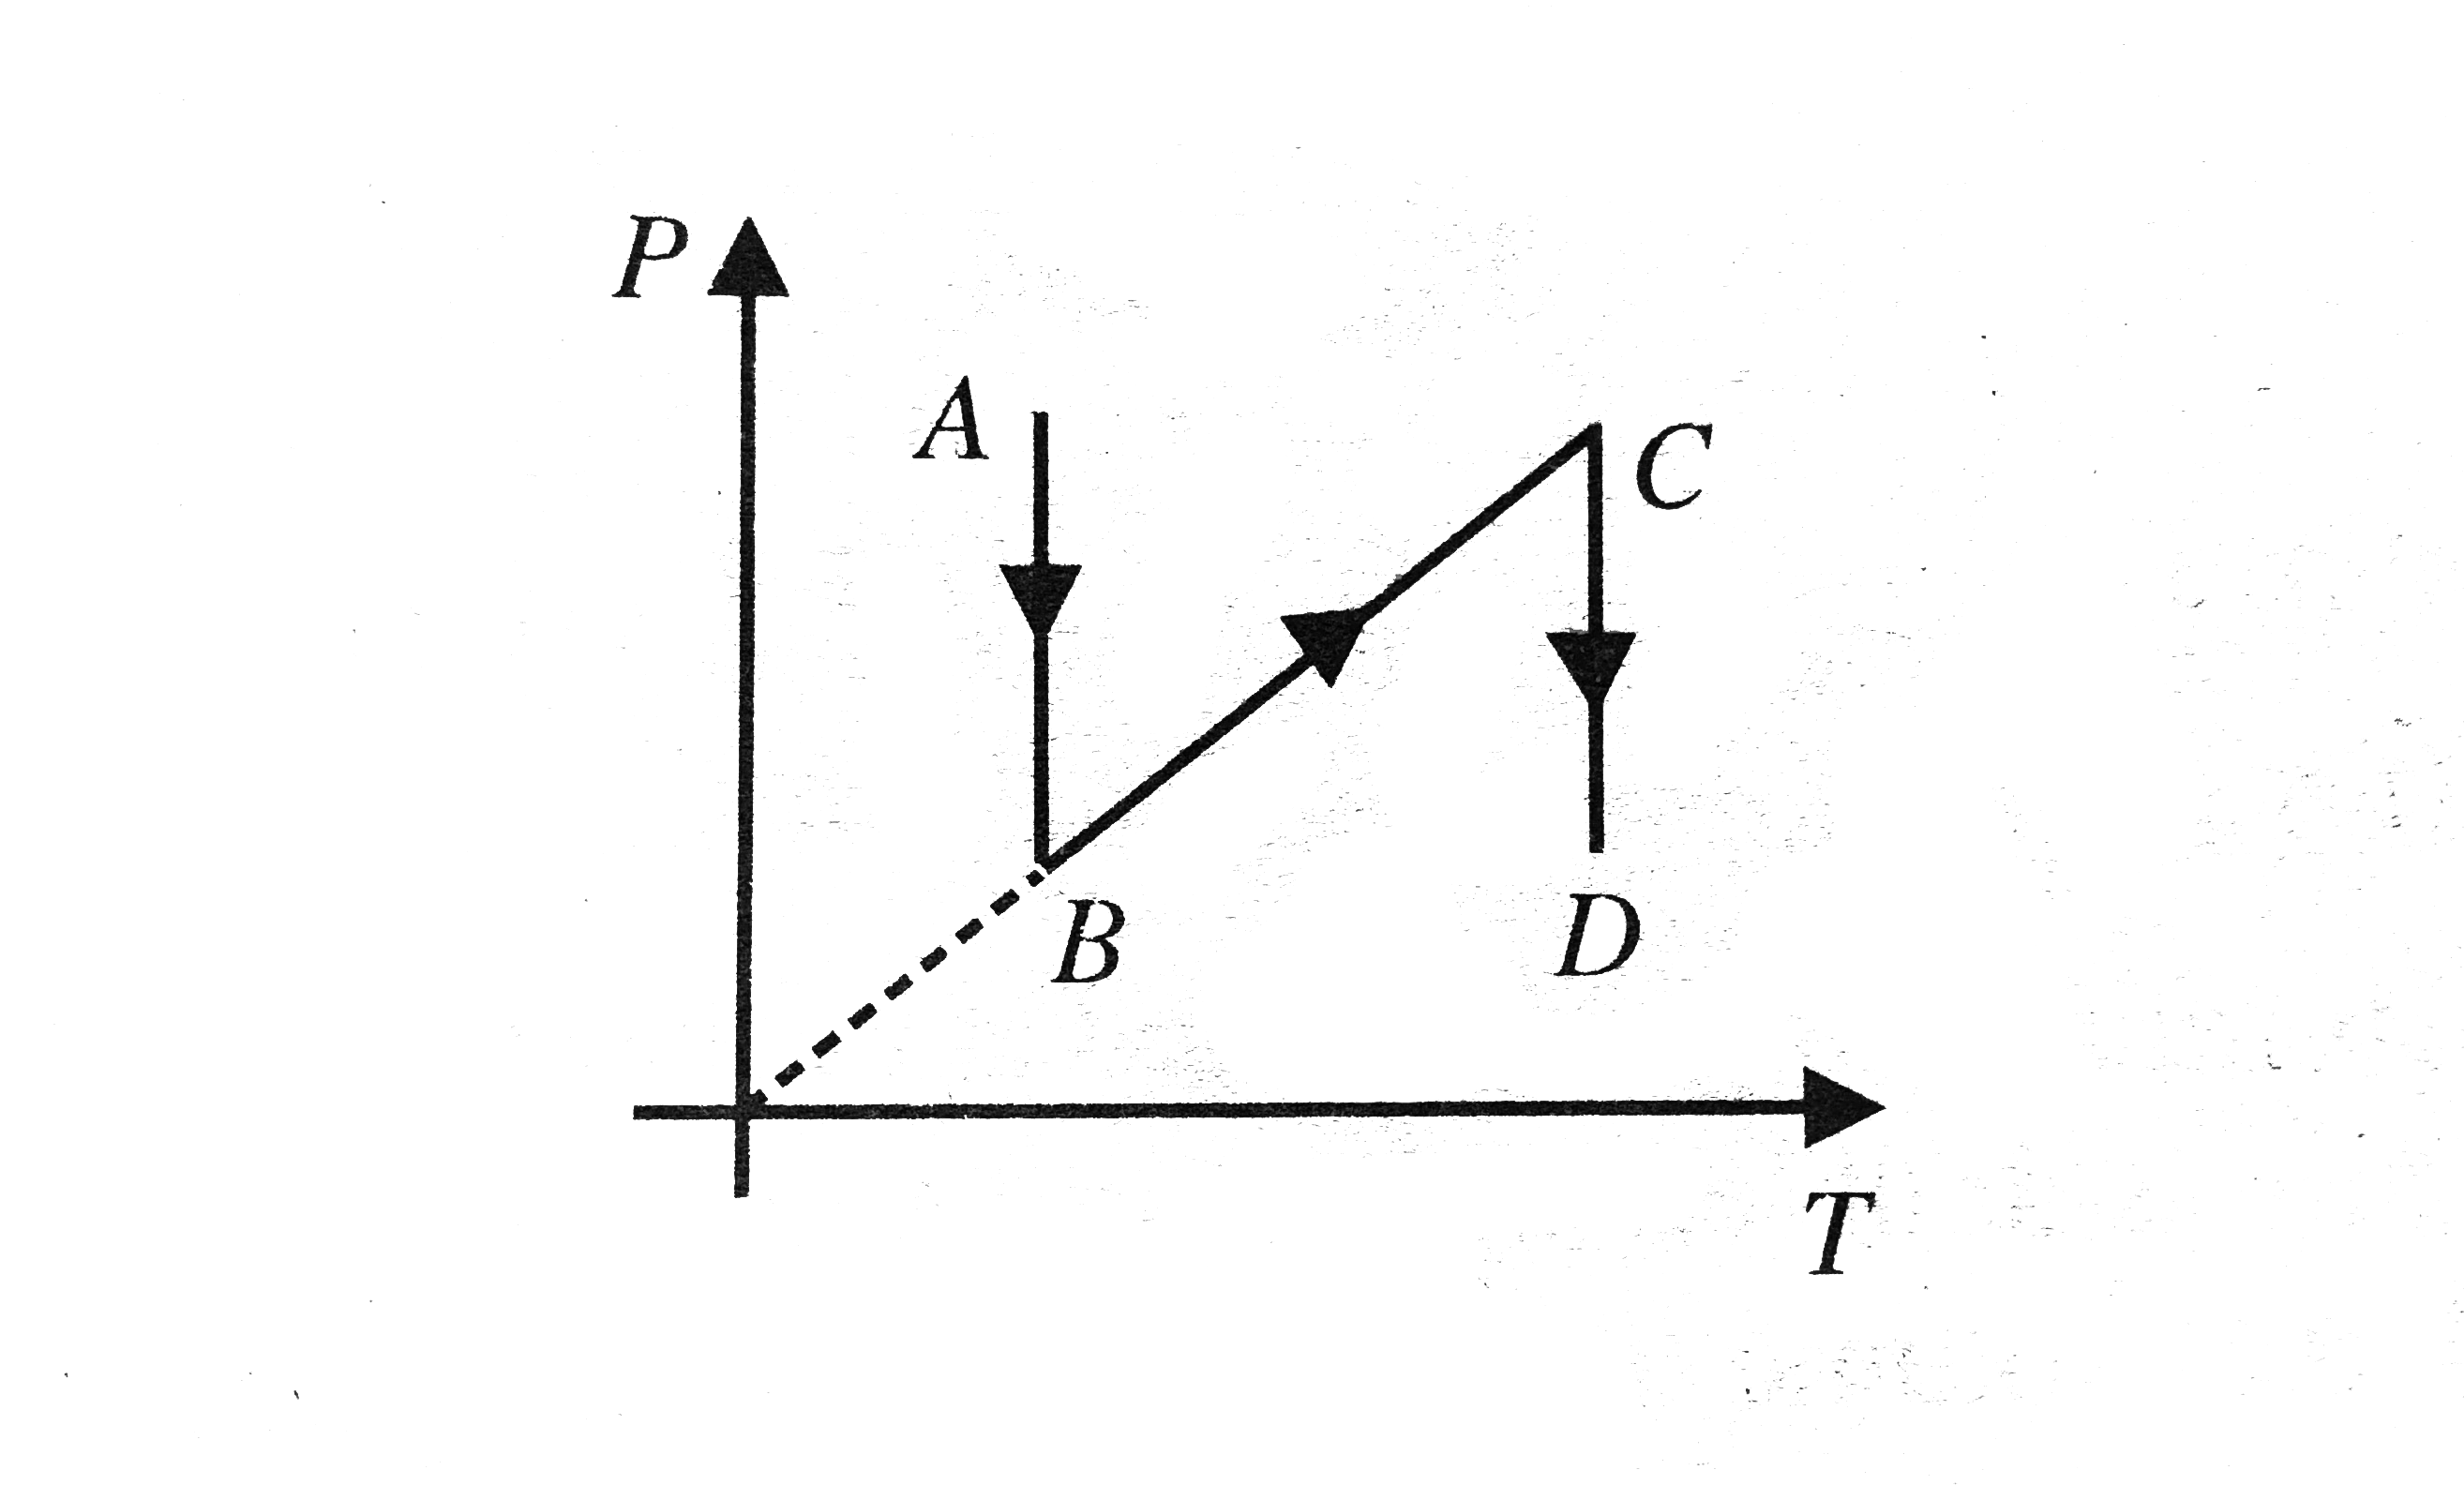
View SolutionWhich of the diagrams shown in figure. Most closely shows the variation in kinetic energy of the earth as it moves once around the sun in its elliptical orbit ?
View SolutionIn the phase diagram showns, the point Q corresponds to the triple point of water. The region I, II and III respectively correspond to phases
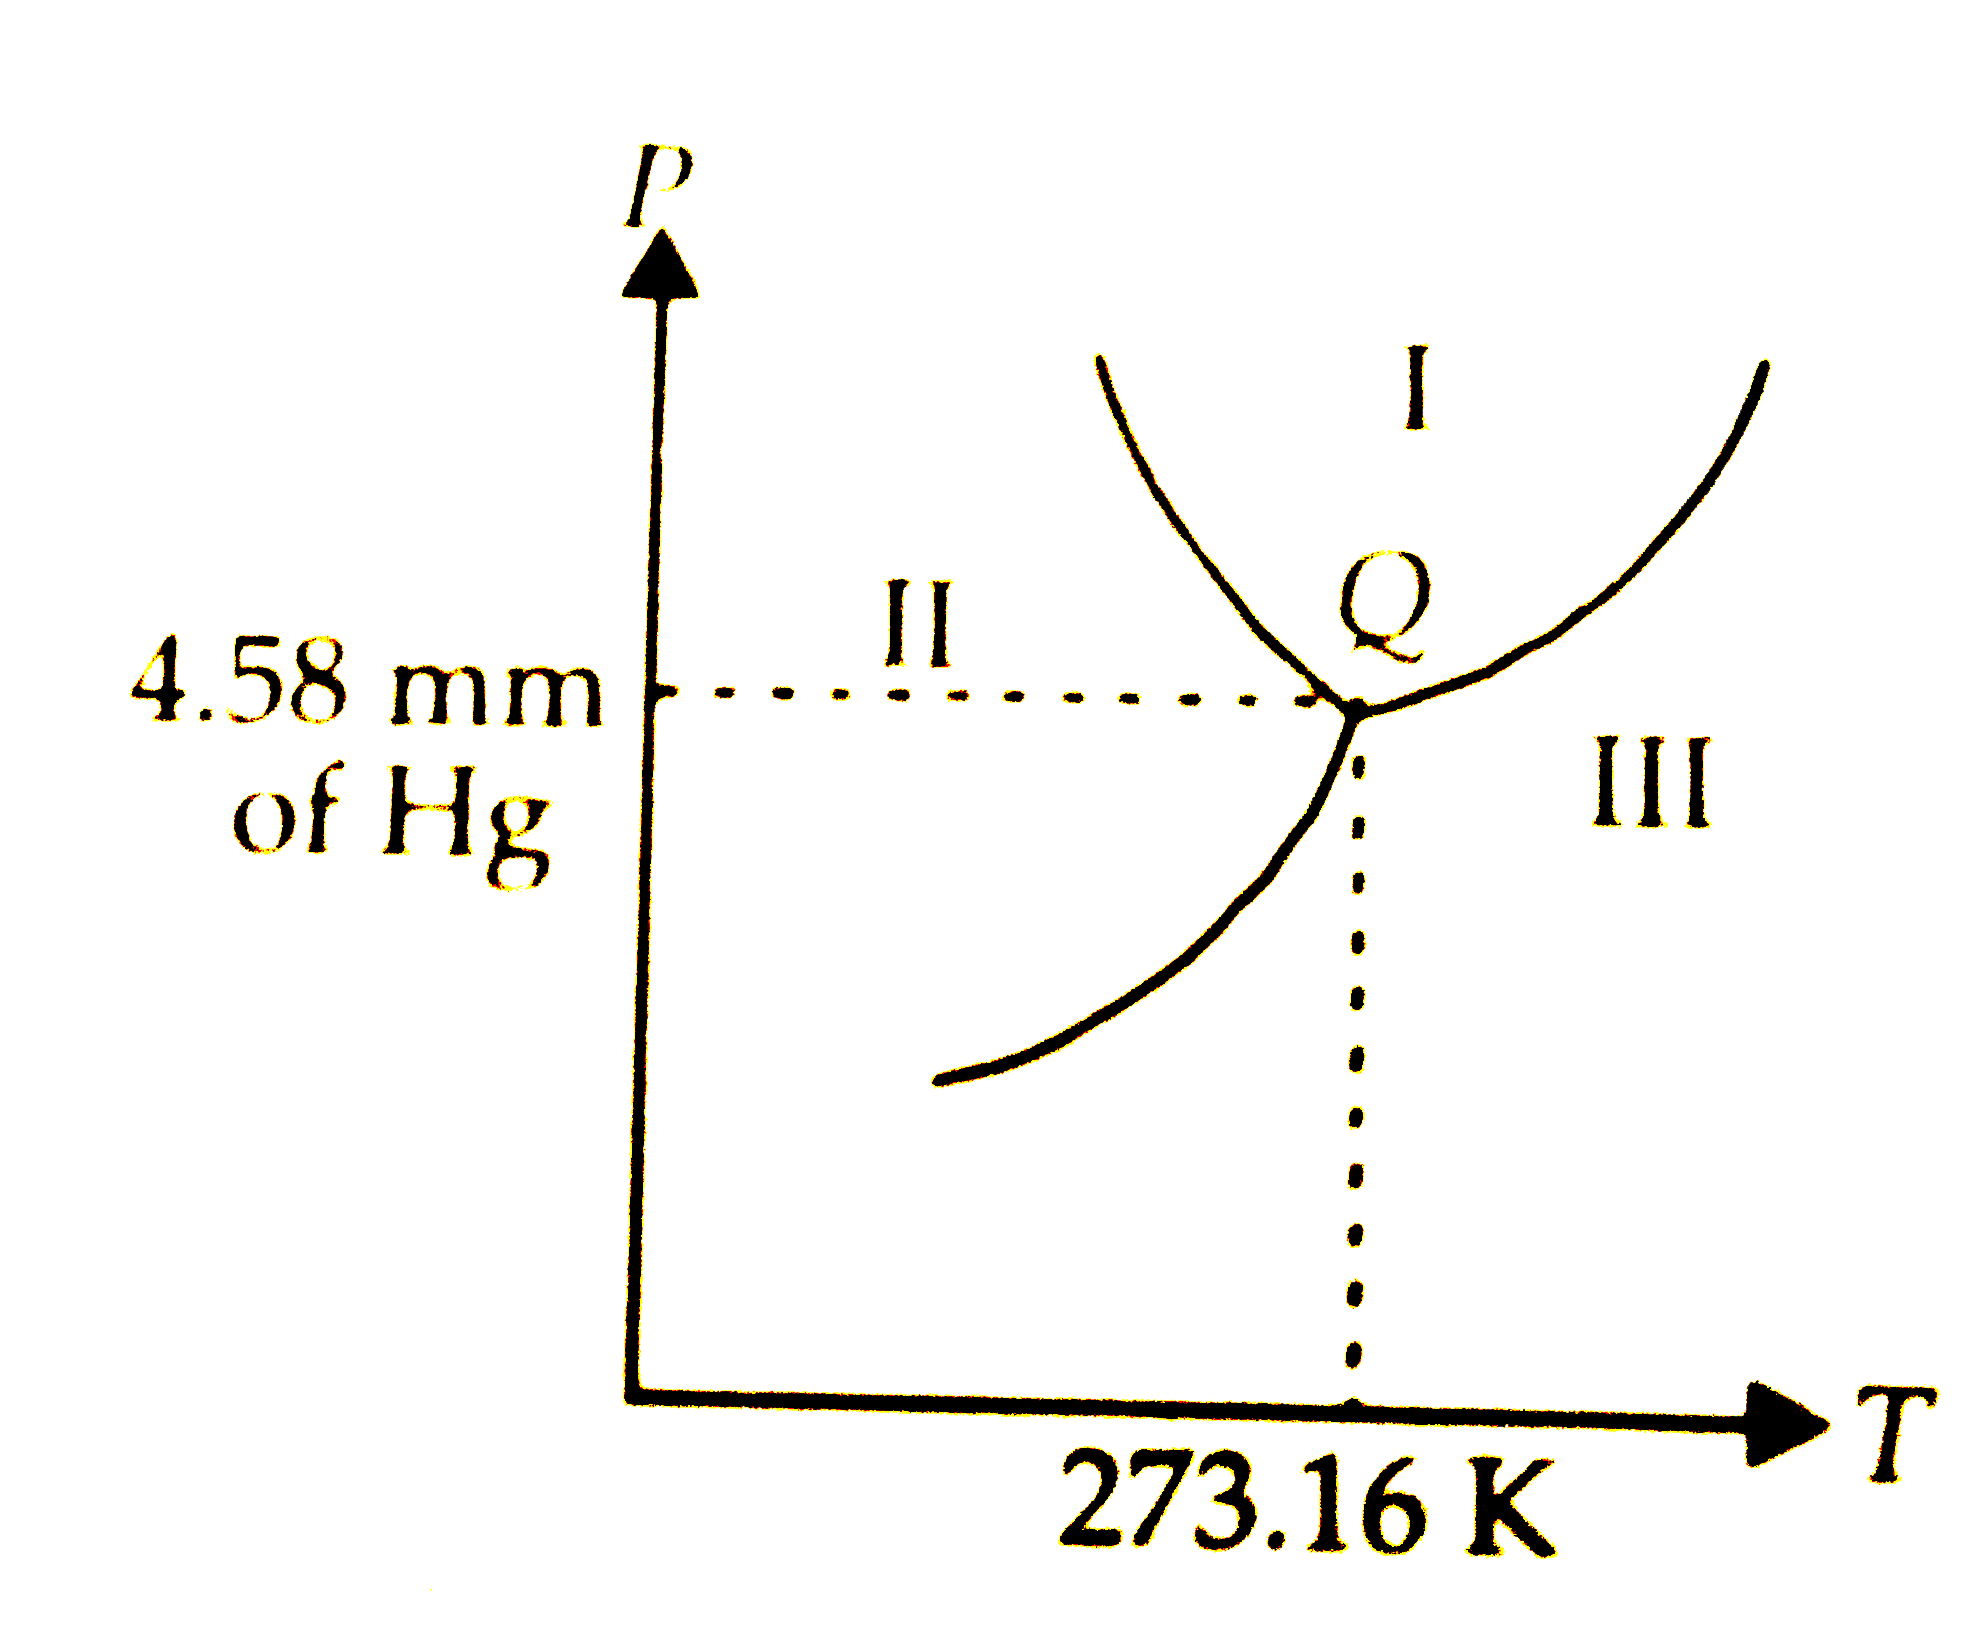
View Solution
