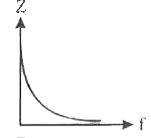
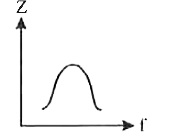
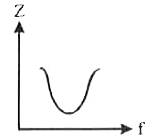
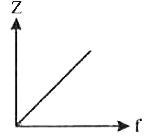
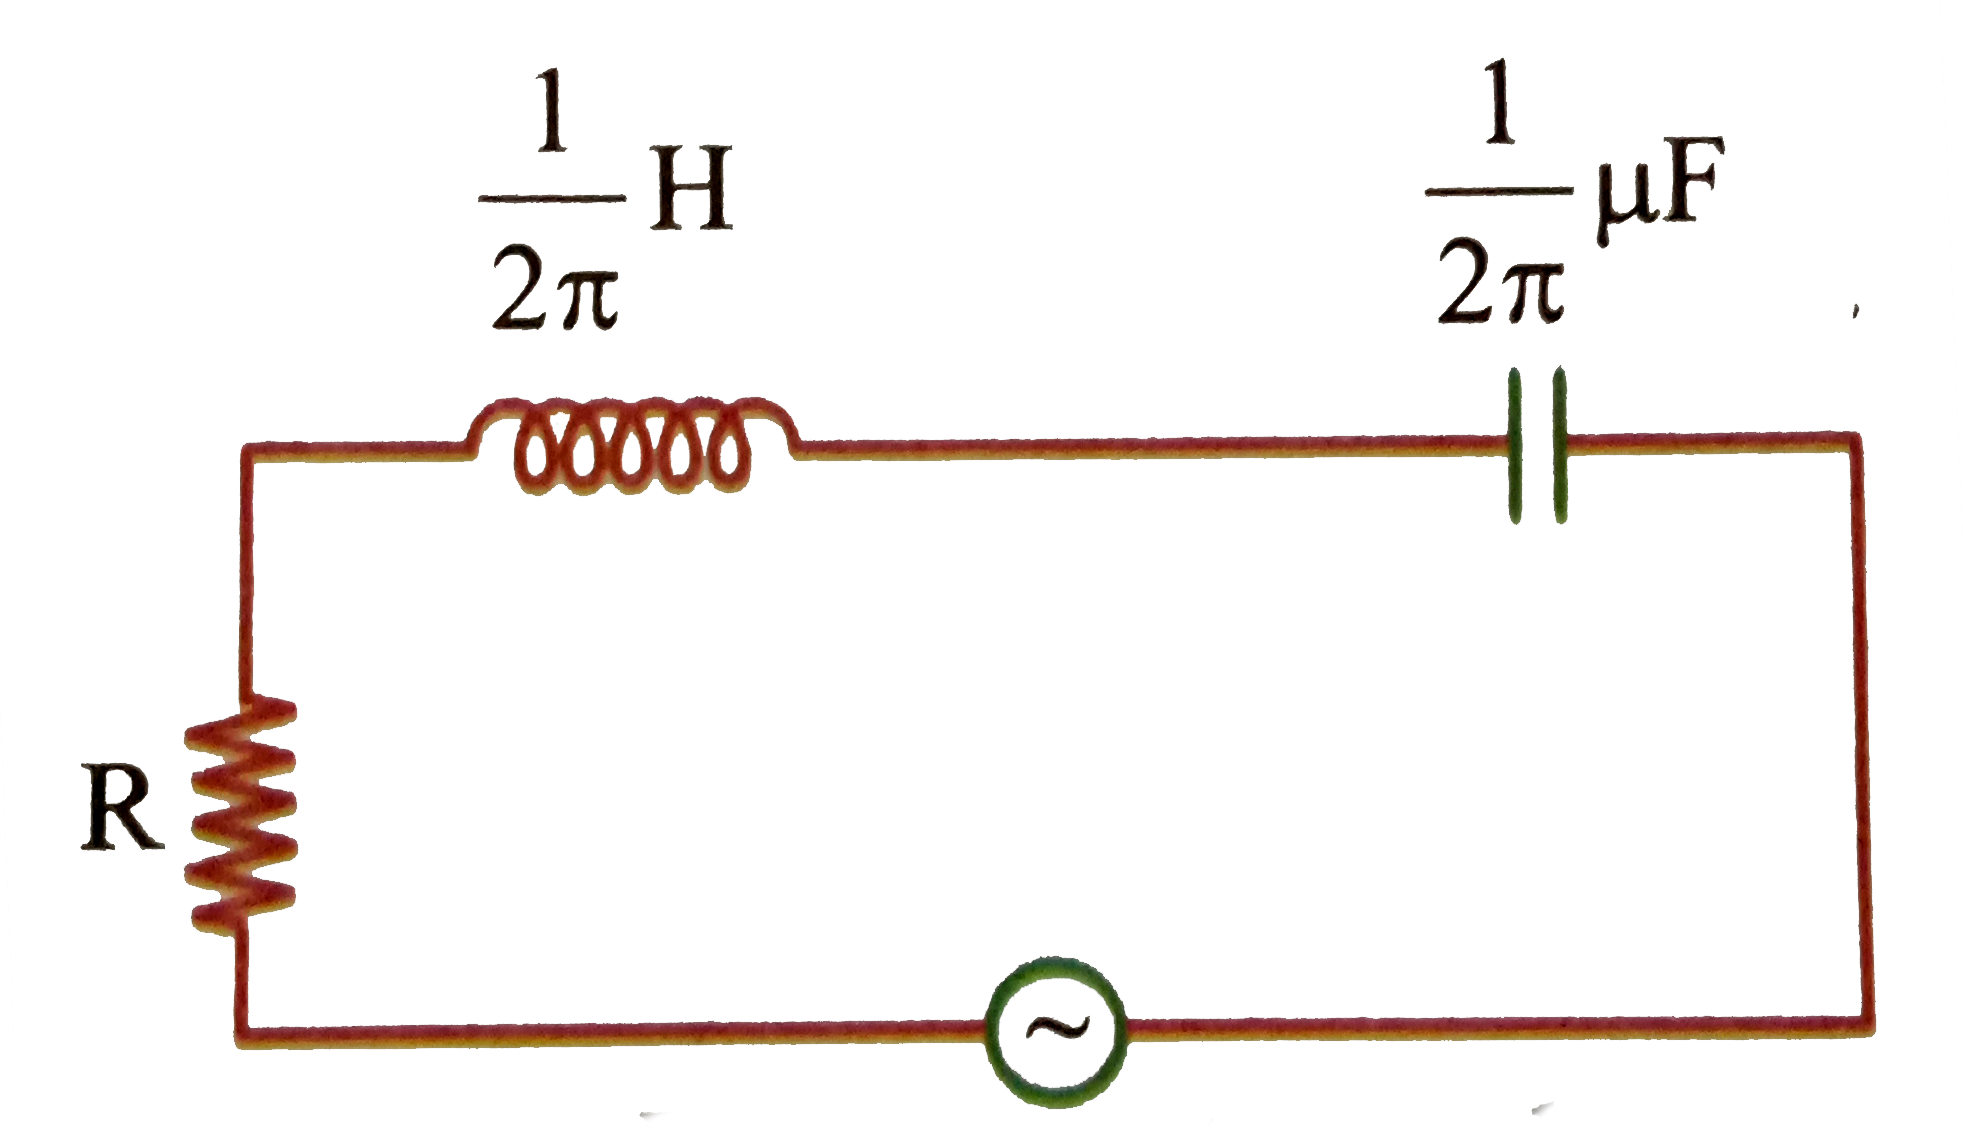
Which of the following curves represents the variation of impedence (Z) with frequency f in series LCR circuit?
A
B
C
D
Video Solution
Text Solution
The correct Answer is:C
Impedance at resonant frequency is minimum in series LCR circuit.
So , Z=√R2+(2πfL−12πfC)2
|
Updated on:21/07/2023
Topper's Solved these Questions
- BOOK - DISHA PUBLICATIONCHAPTER - ALTERNATING CURRENT EXERCISE - Exercise - 1 : CONCEPT BUILDER (Topic 3 : Transformers and LC Oscillations)19videos
ALTERNATING CURRENT
- BOOK - DISHA PUBLICATIONCHAPTER - ALTERNATING CURRENT EXERCISE - Exercise -2 : Concept Applicator30videos
ALTERNATING CURRENT
- BOOK - DISHA PUBLICATIONCHAPTER - ALTERNATING CURRENT EXERCISE - Exercise - 1 : CONCEPT BUILDER (TOPIC 1: Alternating Current, Voltage and Power)20videos
ALTERNATING CURRENT
- BOOK - DISHA PUBLICATIONCHAPTER - ATOMSEXERCISE - EXERCISE-2: CONCEPT APPLICATOR30videos
ATOMS
Similar Questions
Knowledge Check
- Question 1 - Select One
In a series LCR circuit
 Athe voltage VL across the inductance leads the current in the circuit by a phase angle of π/2Bthe voltage VC across the capacitance lags behind the current by a phase angle of π/2Cthe voltage VR across the resistance is in phase with the currentDthe voltage across sereis combination of L, C and R is V=VL+VC+VR
 - Question 2 - Select One
Which of the following graphs represent the variation of current(I) with frequency (f) in an AC circuit containing a pure capacitor?
A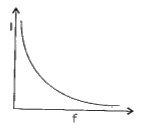 B
B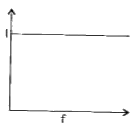 C
C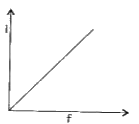 D
D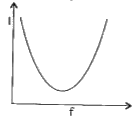
- Question 3 - Select One
An a.c. source of variable angular frequency o is connected to an LCR series circuit. Which one of the following graphs correctly represents variation of impedance Zof a.c. circuit with angular frequency ω?
A B
B C
C D
D
what is resonance in series LCR circuit ?
View SolutionSketch a graph that shows change in reactance with frequency of a series LCR circuit.
View SolutionAt resonance frequency the impedance in series LCR circuit is
View SolutionThe given curve represents the variation of temperatue as a function of volume for one mole of an ideal gas. Which of the following curves best represents the variation of pressure as a function of volume ?
(##DCP_V03_C20_E01_099_Q01##).View SolutionWhich of the following plots may represent is impedence of a series LCR combination?
View Solution

