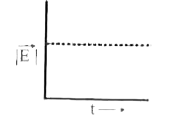
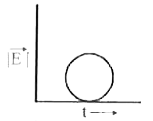
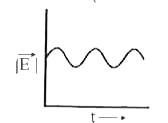
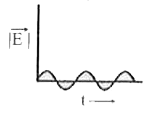
Which of the following diagrams represent the veriation of electric field vector with time for a circularly polarised light
A
B
C
D
Video Solution
Text Solution
The correct Answer is:A
|
Answer
Step by step video, text & image solution for Which of the following diagrams represent the veriation of electric field vector with time for a circularly polarised light by Physics experts to help you in doubts & scoring excellent marks in Class 12 exams.
Updated on:21/07/2023
Topper's Solved these Questions
- BOOK - DISHA PUBLICATIONCHAPTER - WAVE OPTICSEXERCISE - EXERCISE-2 : CONCEPT APPLICATOR30videos
WAVE OPTICS
- BOOK - DISHA PUBLICATIONCHAPTER - WAVE OPTICSEXERCISE - EXERCISE-2 : CONCEPT APPLICATOR30videos
WAVE OPTICS
- BOOK - DISHA PUBLICATIONCHAPTER - THERMODYNAMICS EXERCISE - EXERCISE -2 : CONCEPT APPLICATOR29videos
THERMODYNAMICS
- BOOK - DISHA PUBLICATIONCHAPTER - WAVESEXERCISE - EXERCISE -2 CONCEPT APPLICATOR30videos
WAVES
Similar Questions
Knowledge Check
- Question 1 - Select One
Which of the following diagrams represent the variation of electric field vector with time for a circularly polarised light ?
A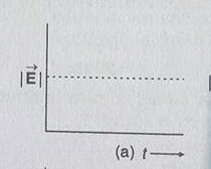 B
B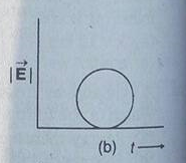 C
C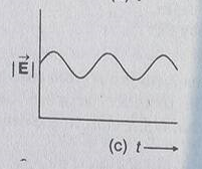 D
D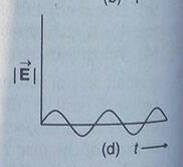
- Question 2 - Select One
Which of the following diagrams represent the variation of electric field vector with time for a circularly polarised light ?
A B
B C
C D
D
- Question 3 - Select One
Which of the following diagram represents the variation of electric field vector with time for a circularly polarised light?
A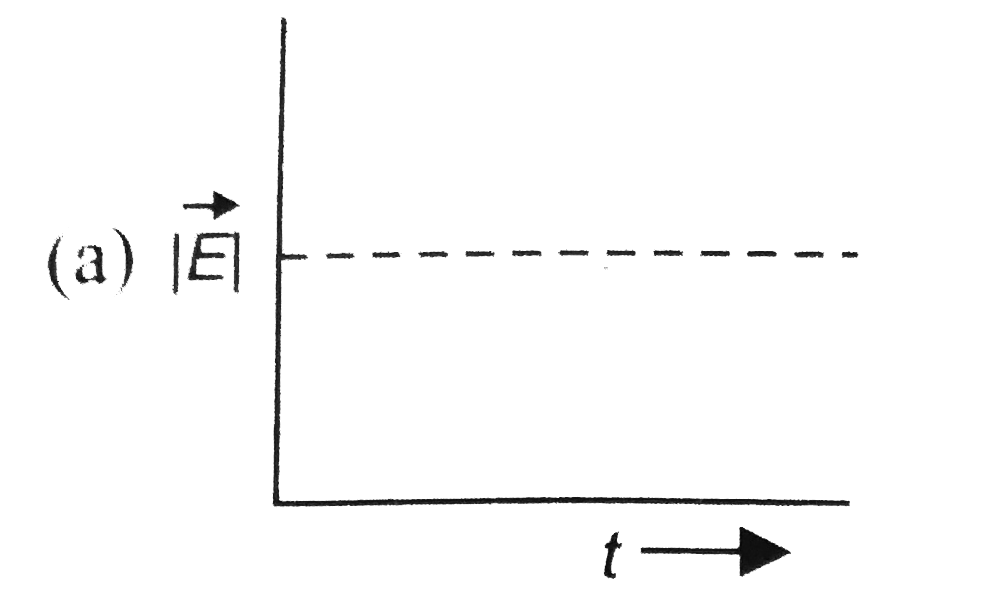 B
B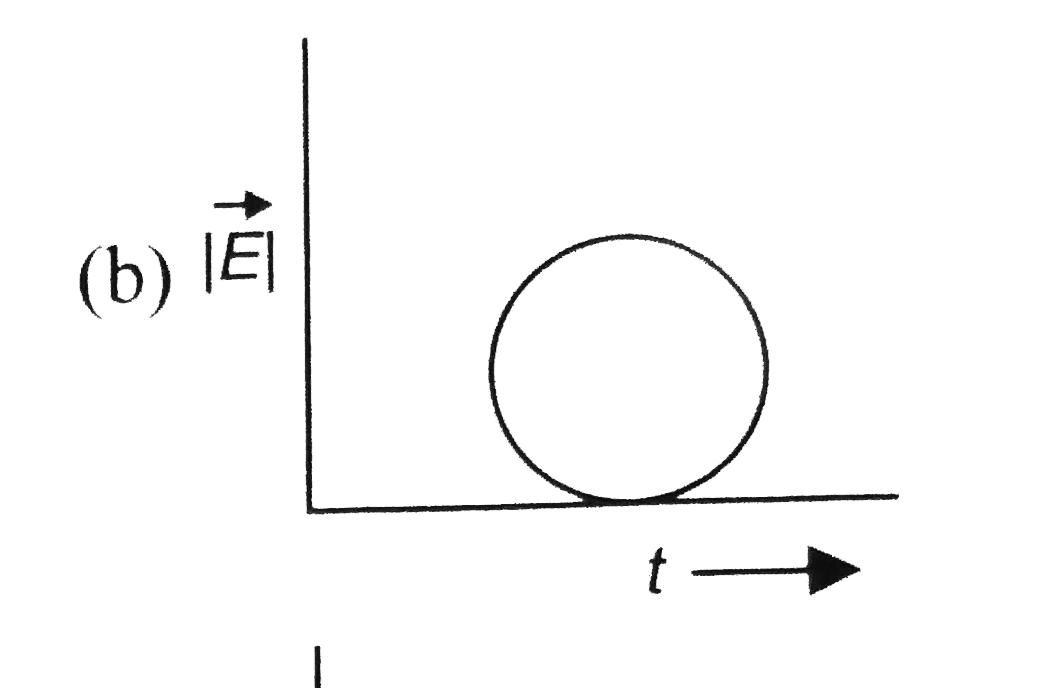 C
C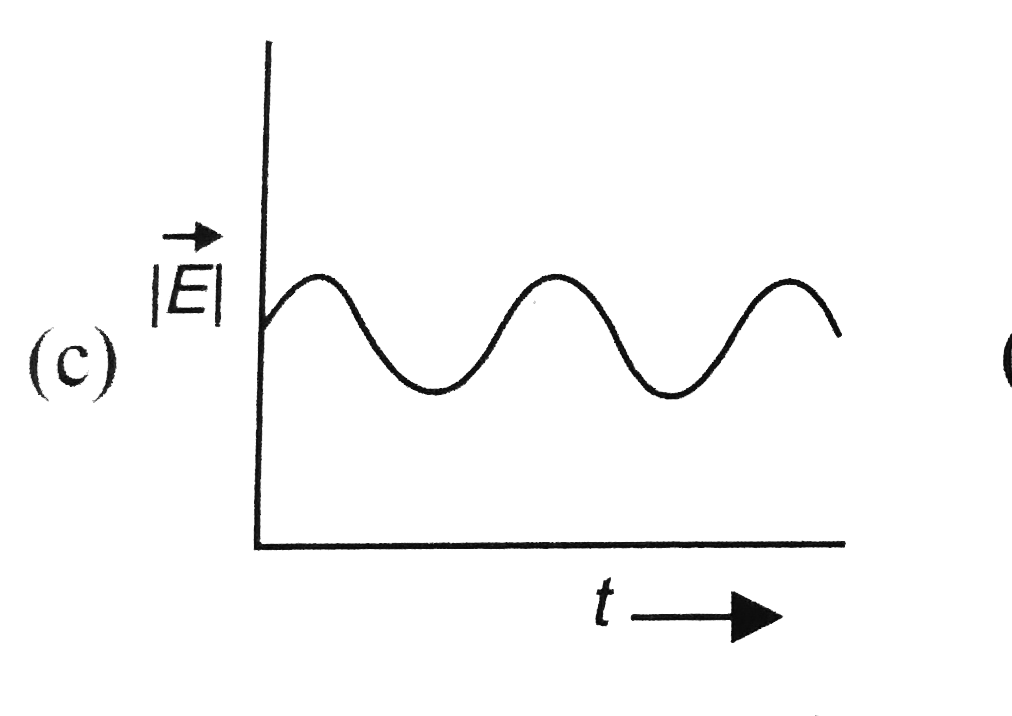 D
D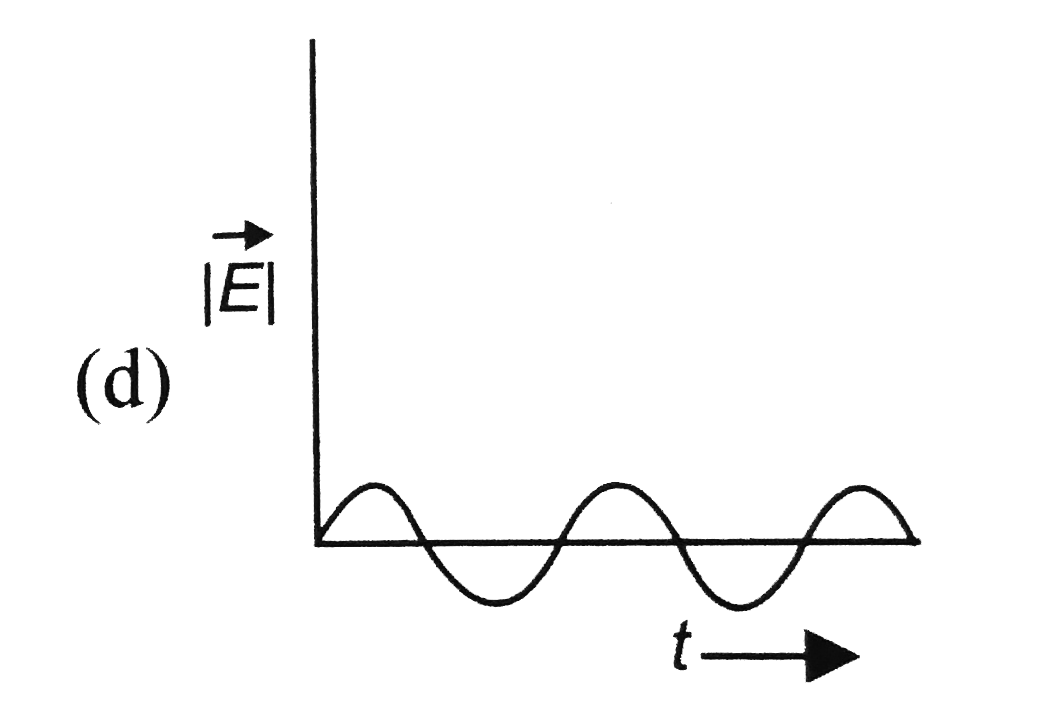
Which of the following represents a unit vector ?
View SolutionWhich of the following represents a vector ?
View SolutionWhich of the following represents electric polarisation ?
View SolutionWhich of the following diagram represent the situation of 'Expansion in Demand' ?
View SolutionWhich one of the following diagrams represents the placentation in Dianthus
View Solution

