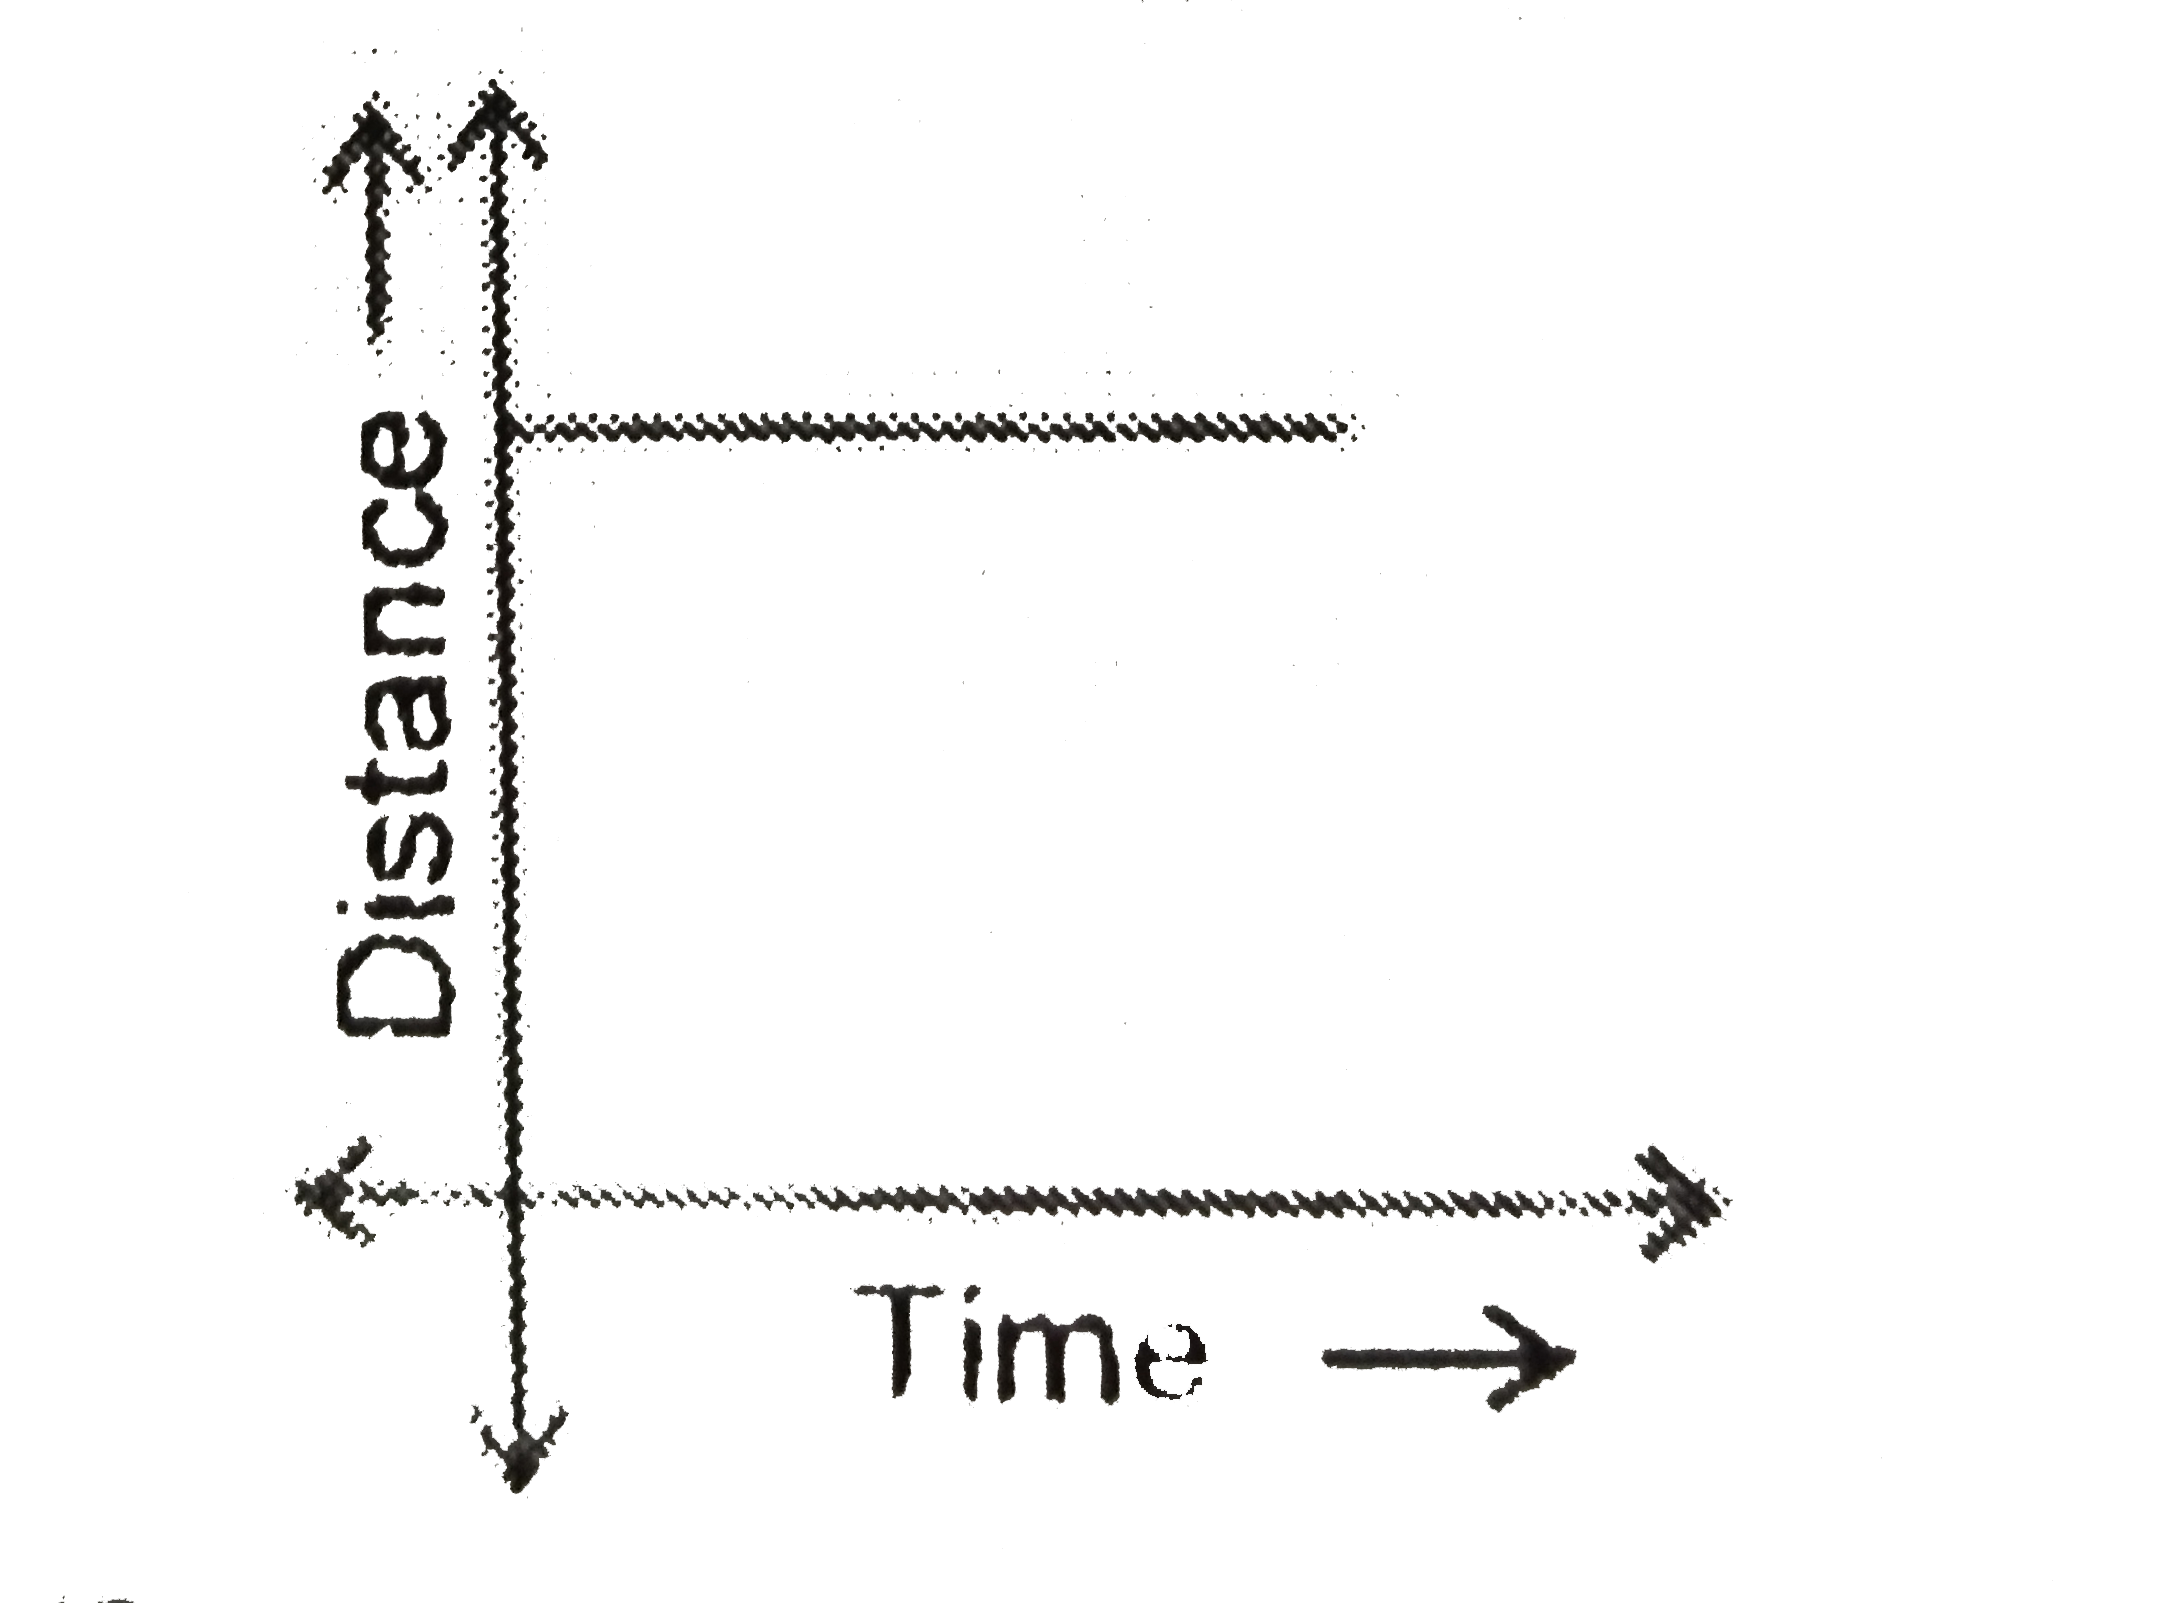
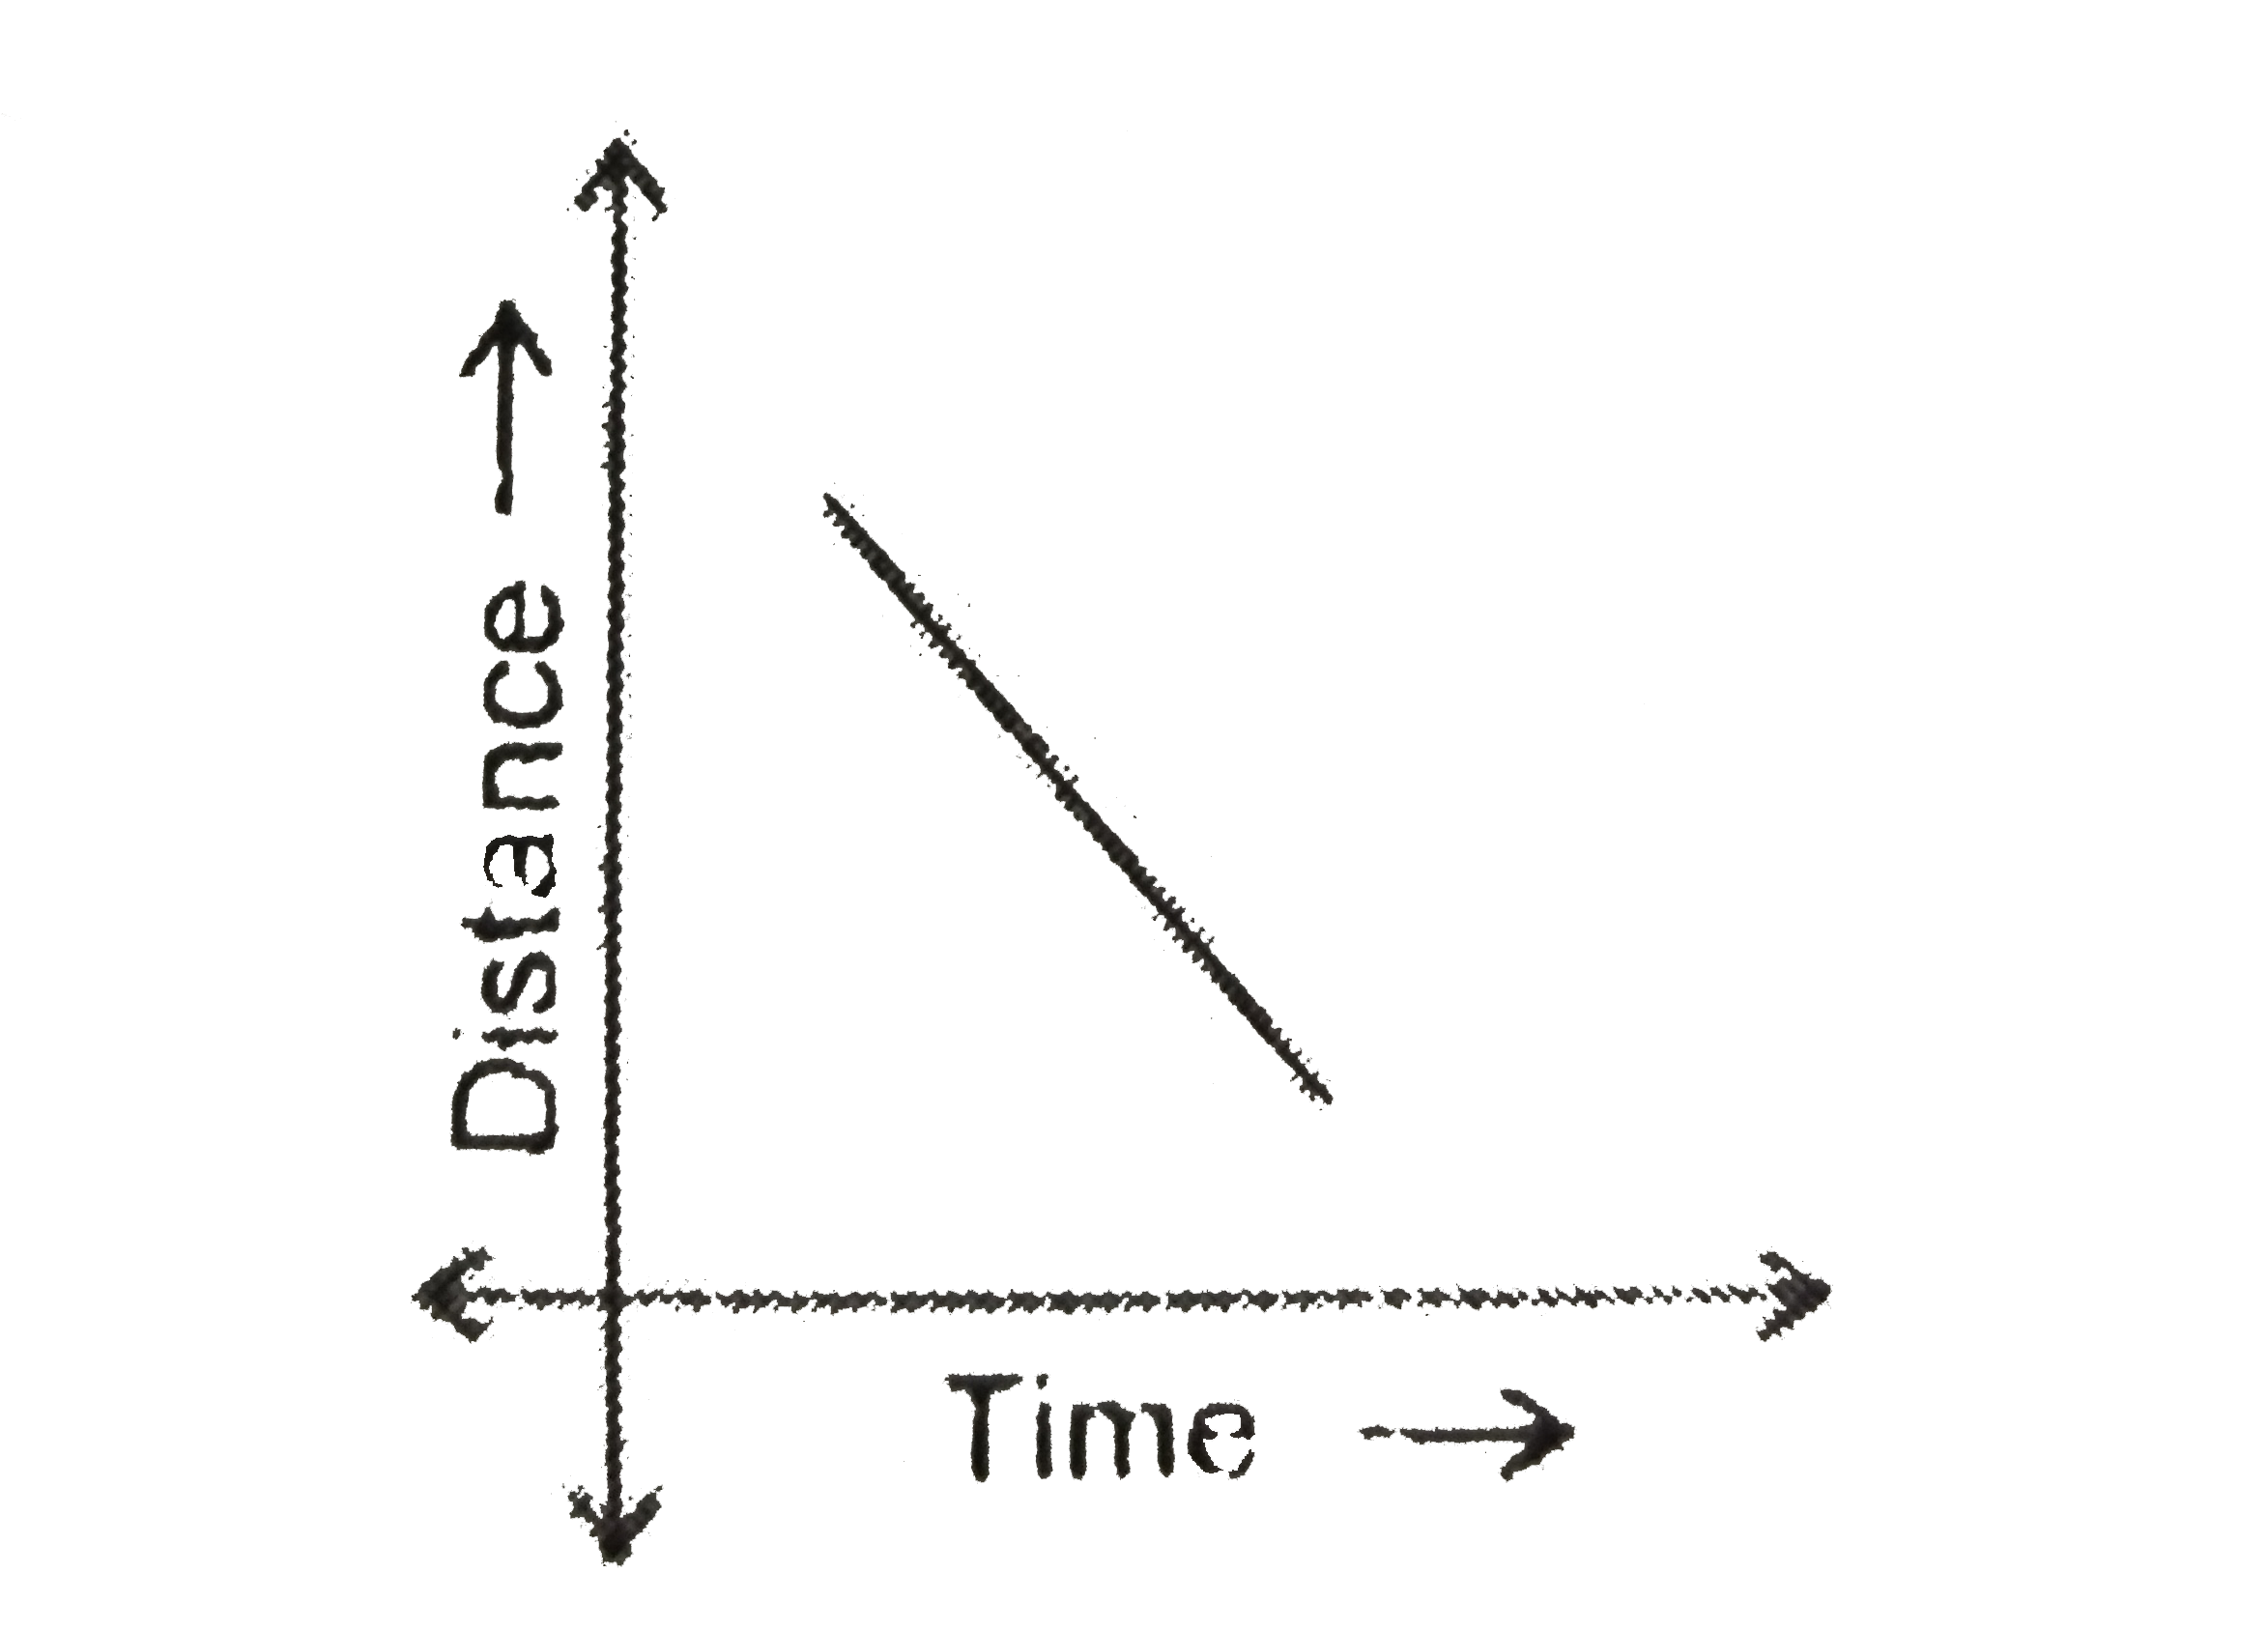
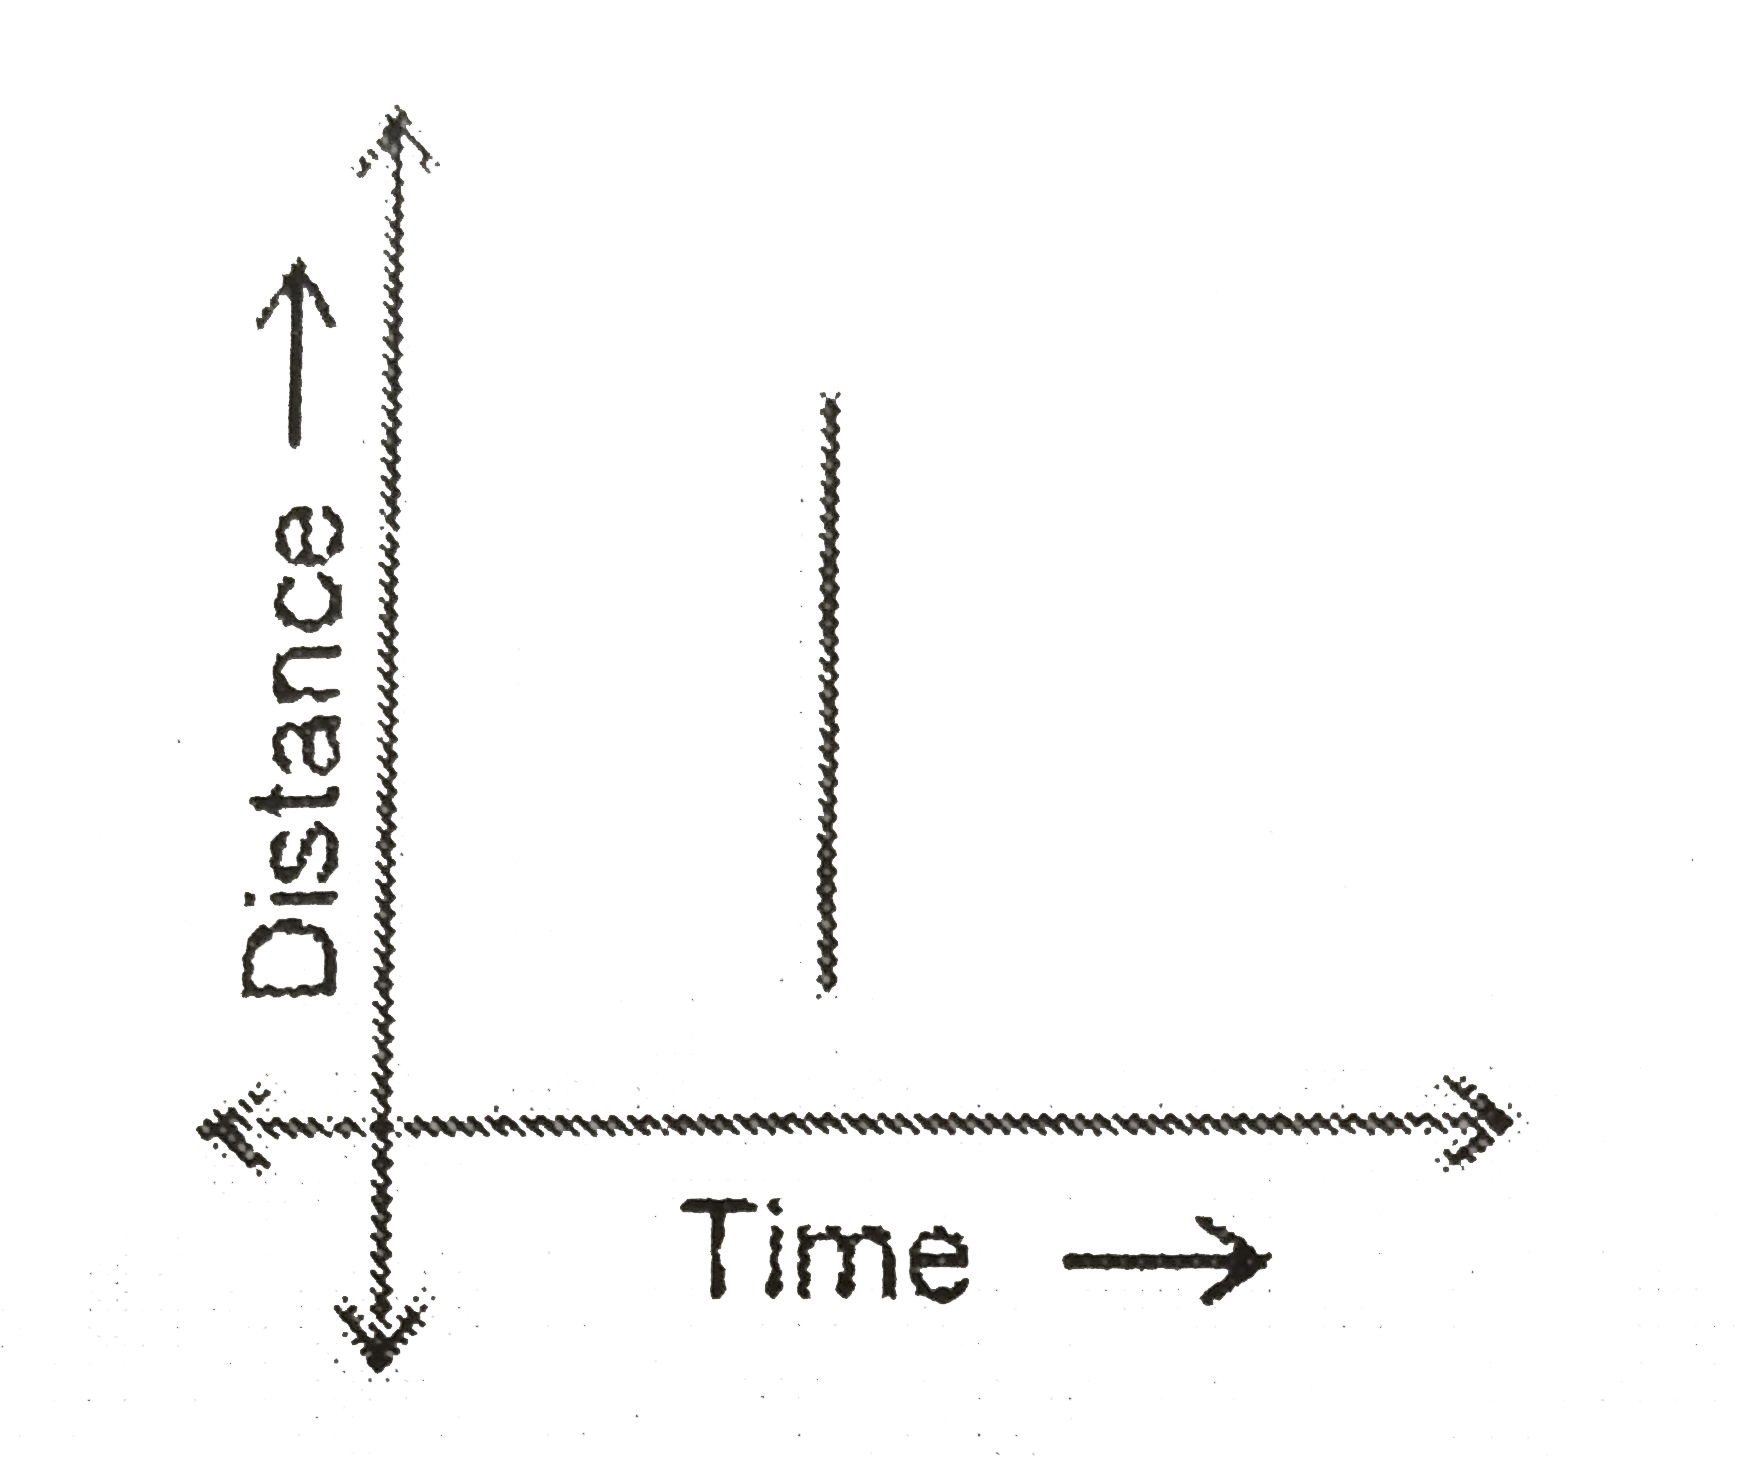
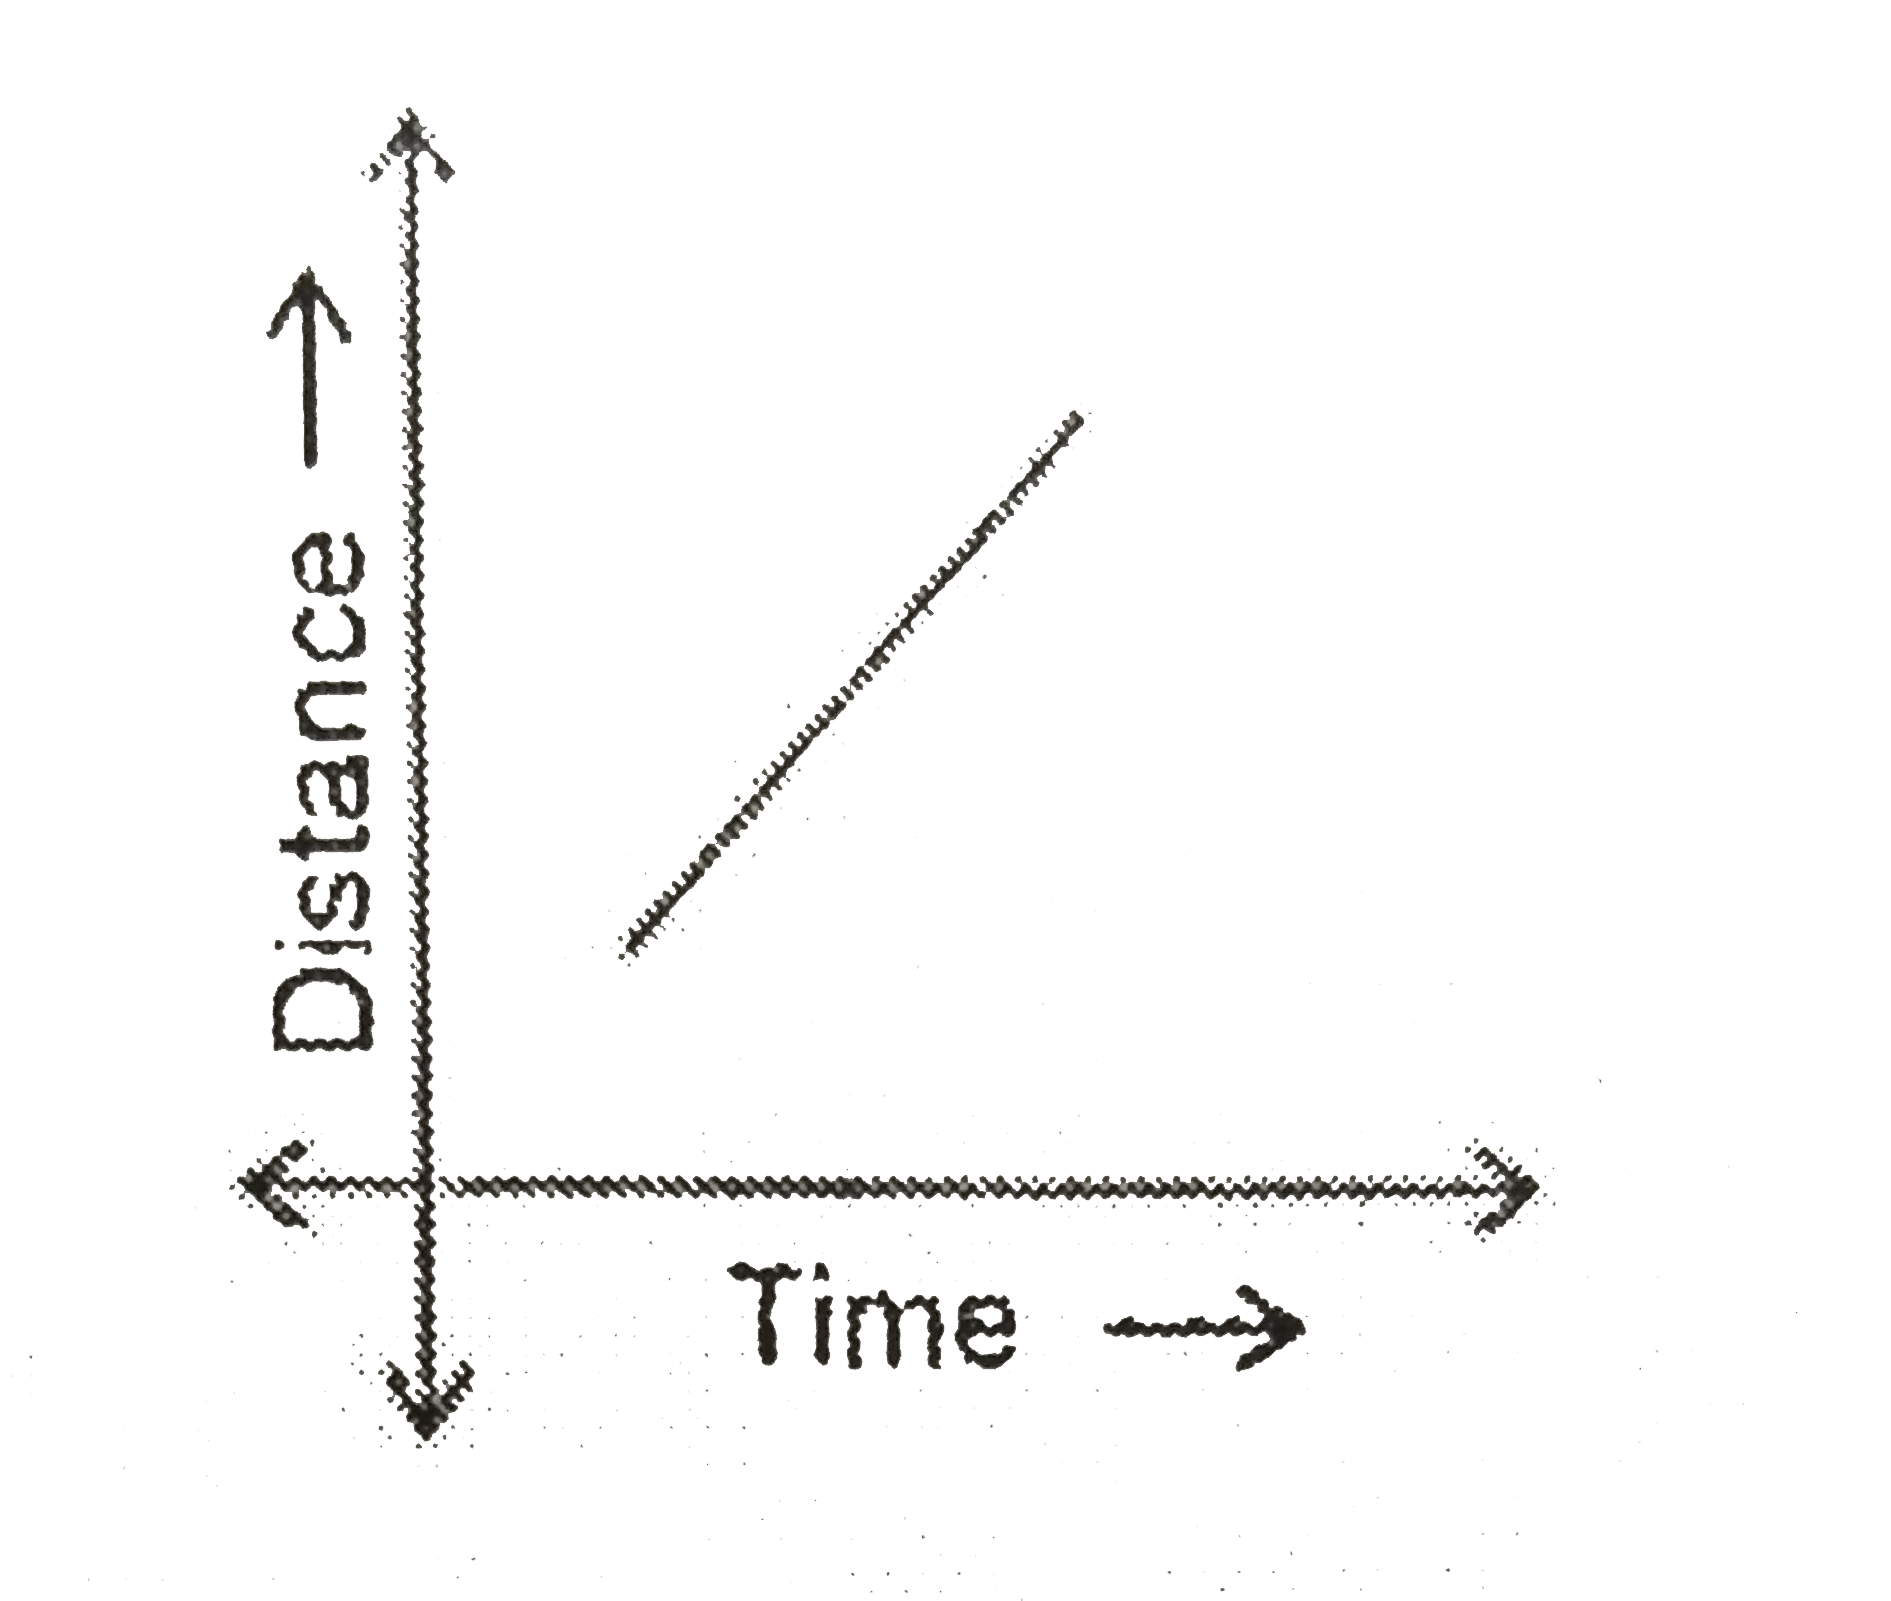
Which of the following distance-time graphs is not possible?
The correct Answer is:C
To determine which of the given distance-time graphs is not possible, we need to understand the properties of distance and how it is represented on a graph.
1. Understanding Distance:
- Distance is a scalar quantity, which means it has magnitude but no direction.
- Distance can never be negative; it is always zero or positive.
2. Analyzing Graphs:
- We have four distance-time graphs to analyze. Each graph has time on the x-axis and distance on the y-axis.
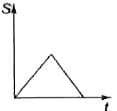
3. Graph A:
- In this graph, the distance is initially increasing, then it decreases.
- This is possible if an object moves away from a starting point and then returns back.
- Conclusion: Graph A is possible.
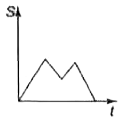
4. Graph B:
- This graph shows distance increasing, then decreasing, then increasing again, and finally decreasing again.
- This can represent an object moving away and coming back multiple times.
- Conclusion: Graph B is also possible.
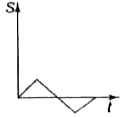
5. Graph C:
- Here, the distance increases, then decreases to zero, and then goes into the negative region.
- Since distance cannot be negative, this graph is not possible.
- Conclusion: Graph C is not possible.
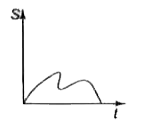
6. Graph D:
- This graph shows a non-linear increase in distance over time but never goes negative.
- Distance can increase or decrease in a non-linear fashion as long as it remains positive.
- Conclusion: Graph D is possible.
Final Answer:
The distance-time graph that is not possible is Graph C because it shows negative distance, which contradicts the definition of distance.
- Distance is a scalar quantity, which means it has magnitude but no direction.
- Distance can never be negative; it is always zero or positive.
- We have four distance-time graphs to analyze. Each graph has time on the x-axis and distance on the y-axis.
- In this graph, the distance is initially increasing, then it decreases.
- This is possible if an object moves away from a starting point and then returns back.
- Conclusion: Graph A is possible.
- This graph shows distance increasing, then decreasing, then increasing again, and finally decreasing again.
- This can represent an object moving away and coming back multiple times.
- Conclusion: Graph B is also possible.
- Here, the distance increases, then decreases to zero, and then goes into the negative region.
- Since distance cannot be negative, this graph is not possible.
- Conclusion: Graph C is not possible.
- This graph shows a non-linear increase in distance over time but never goes negative.
- Distance can increase or decrease in a non-linear fashion as long as it remains positive.
- Conclusion: Graph D is possible.
The distance-time graph that is not possible is Graph C because it shows negative distance, which contradicts the definition of distance.
Topper's Solved these Questions
- MISCELLANEOUS QUESTIONSBOOK - MCGROW HILL PUBLICATIONCHAPTER - MISCELLANEOUS QUESTIONSEXERCISE - PART-B
99 Videos
- MEASUREMENTBOOK - MCGROW HILL PUBLICATIONCHAPTER - MEASUREMENTEXERCISE - ELEMENTARY QUESTIONS (HIGHER ORDER THINKING QUESTIONS)
13 Videos
- MOTIONBOOK - MCGROW HILL PUBLICATIONCHAPTER - MOTIONEXERCISE - HIGHER ORDER THINKING QUESTIONS
48 Videos
Similar Questions
Knowledge Check
Which of the following distance time graphs is possible ?
A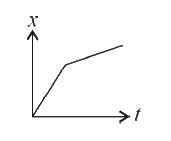 B
B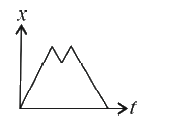 C
C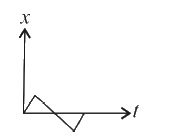 D
D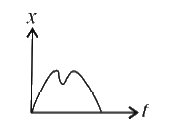
Which of the following speed-time graphs is not possible:
A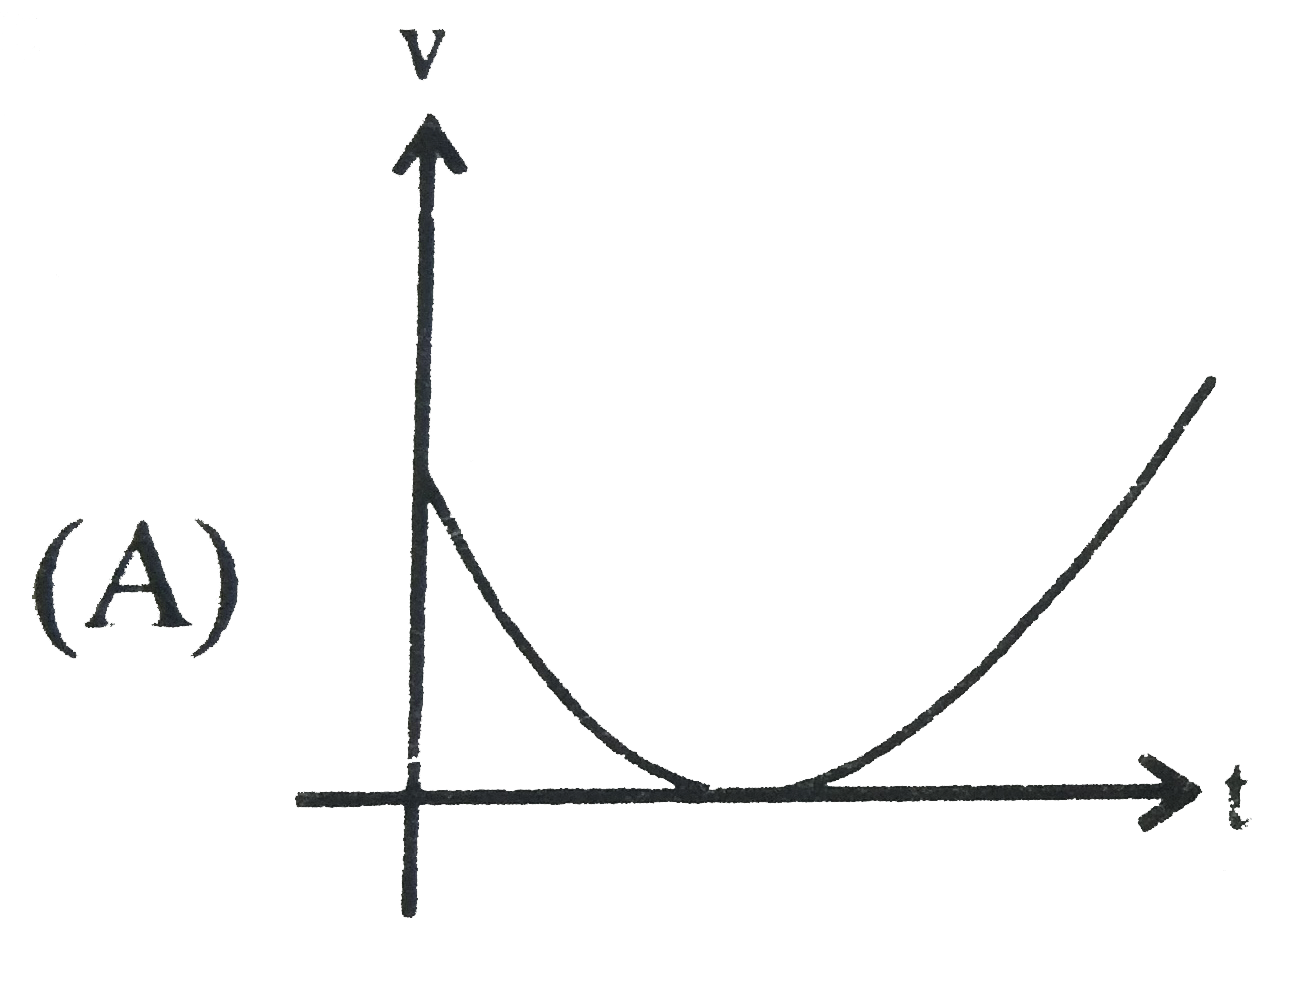 B
B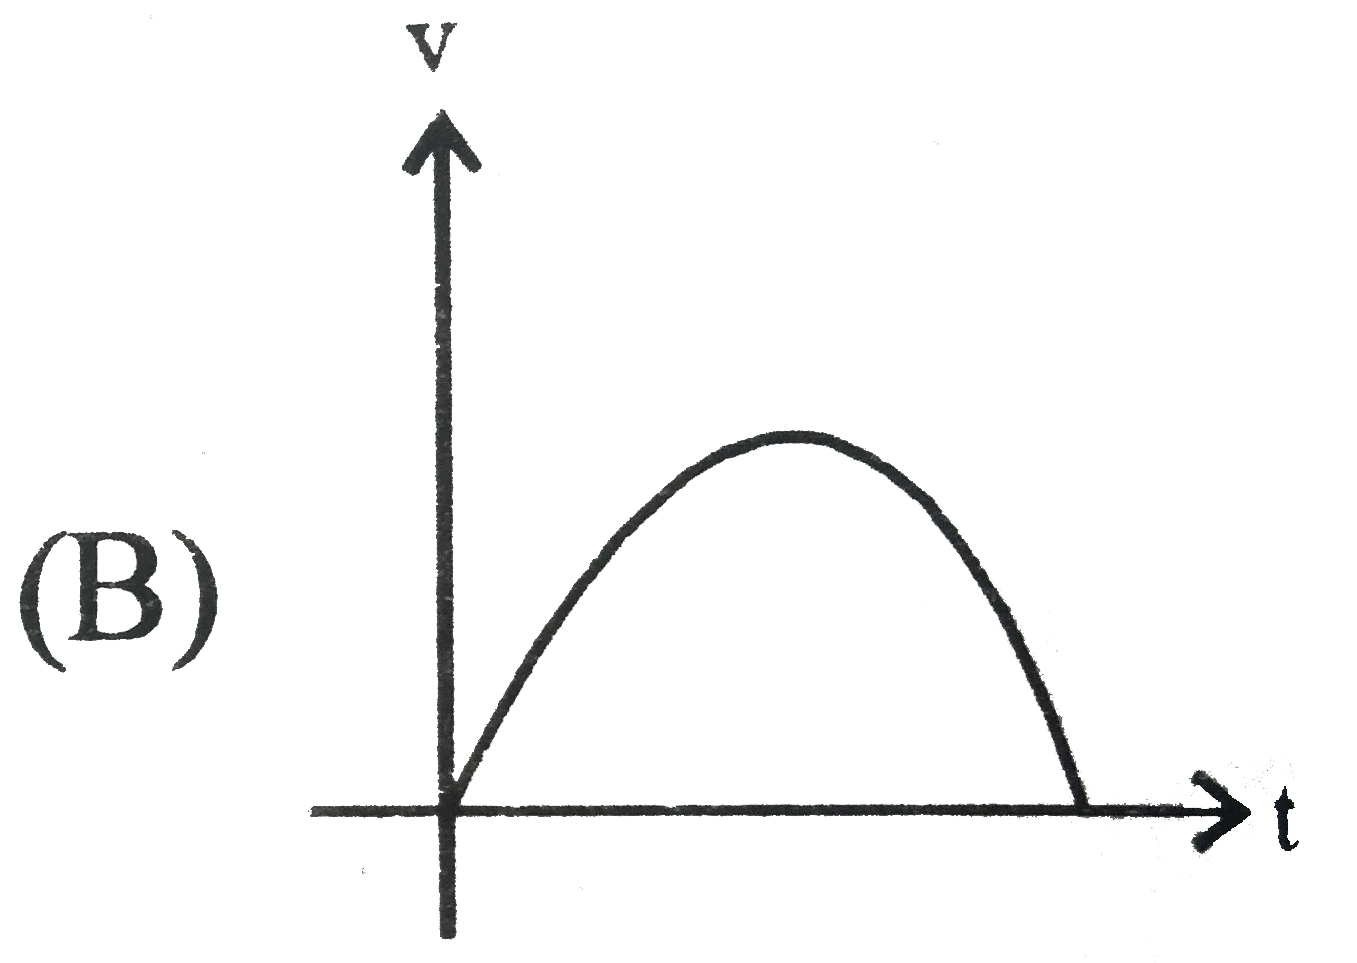 C
C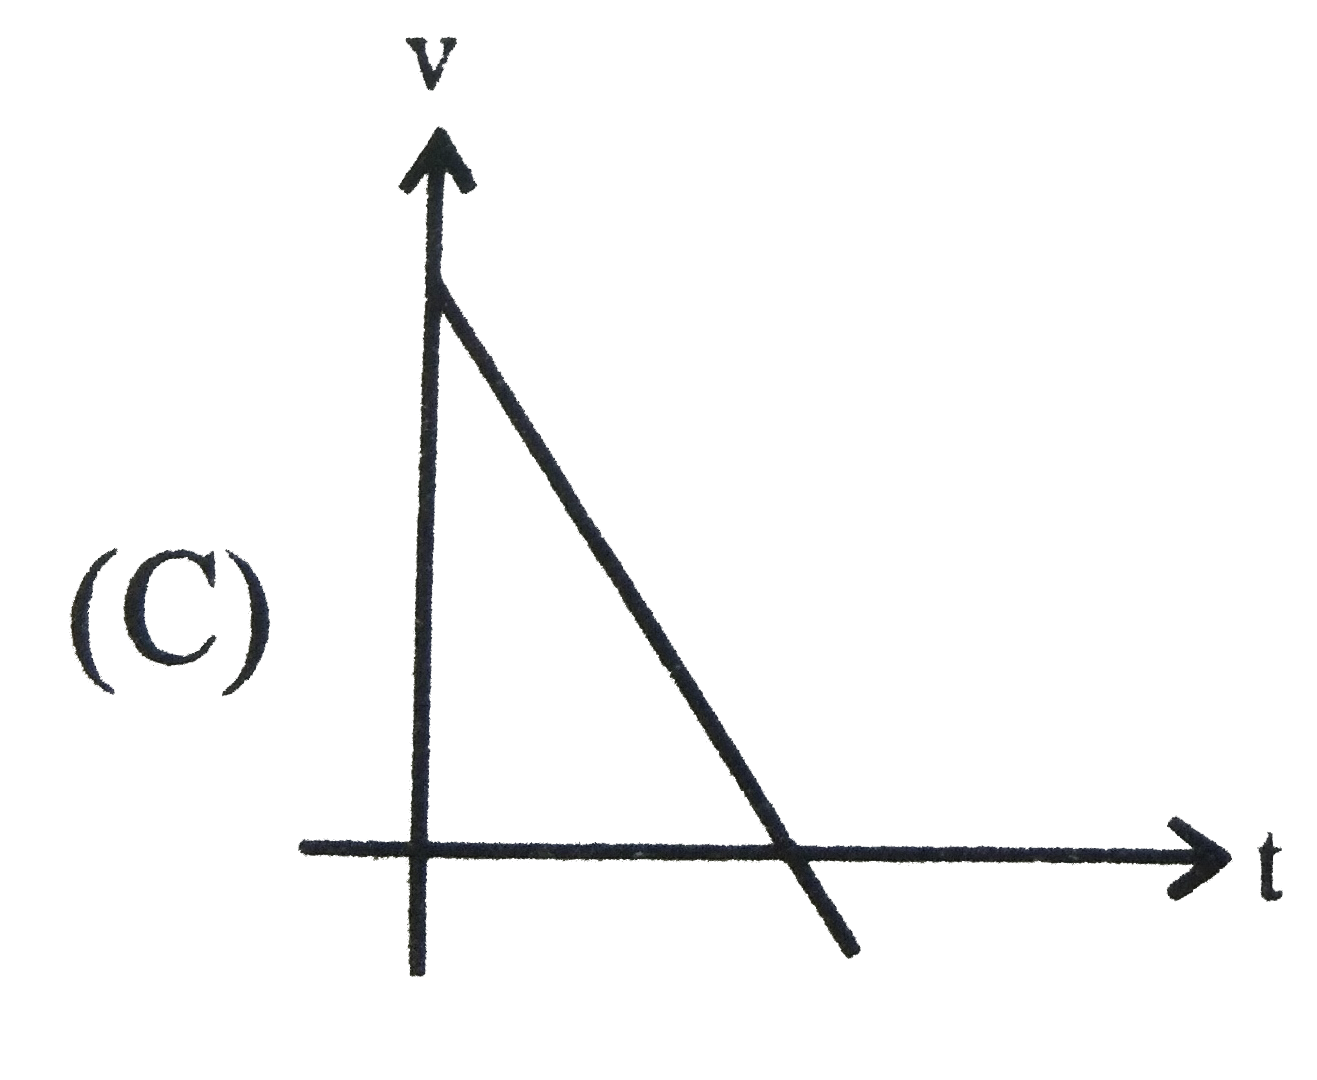 D
D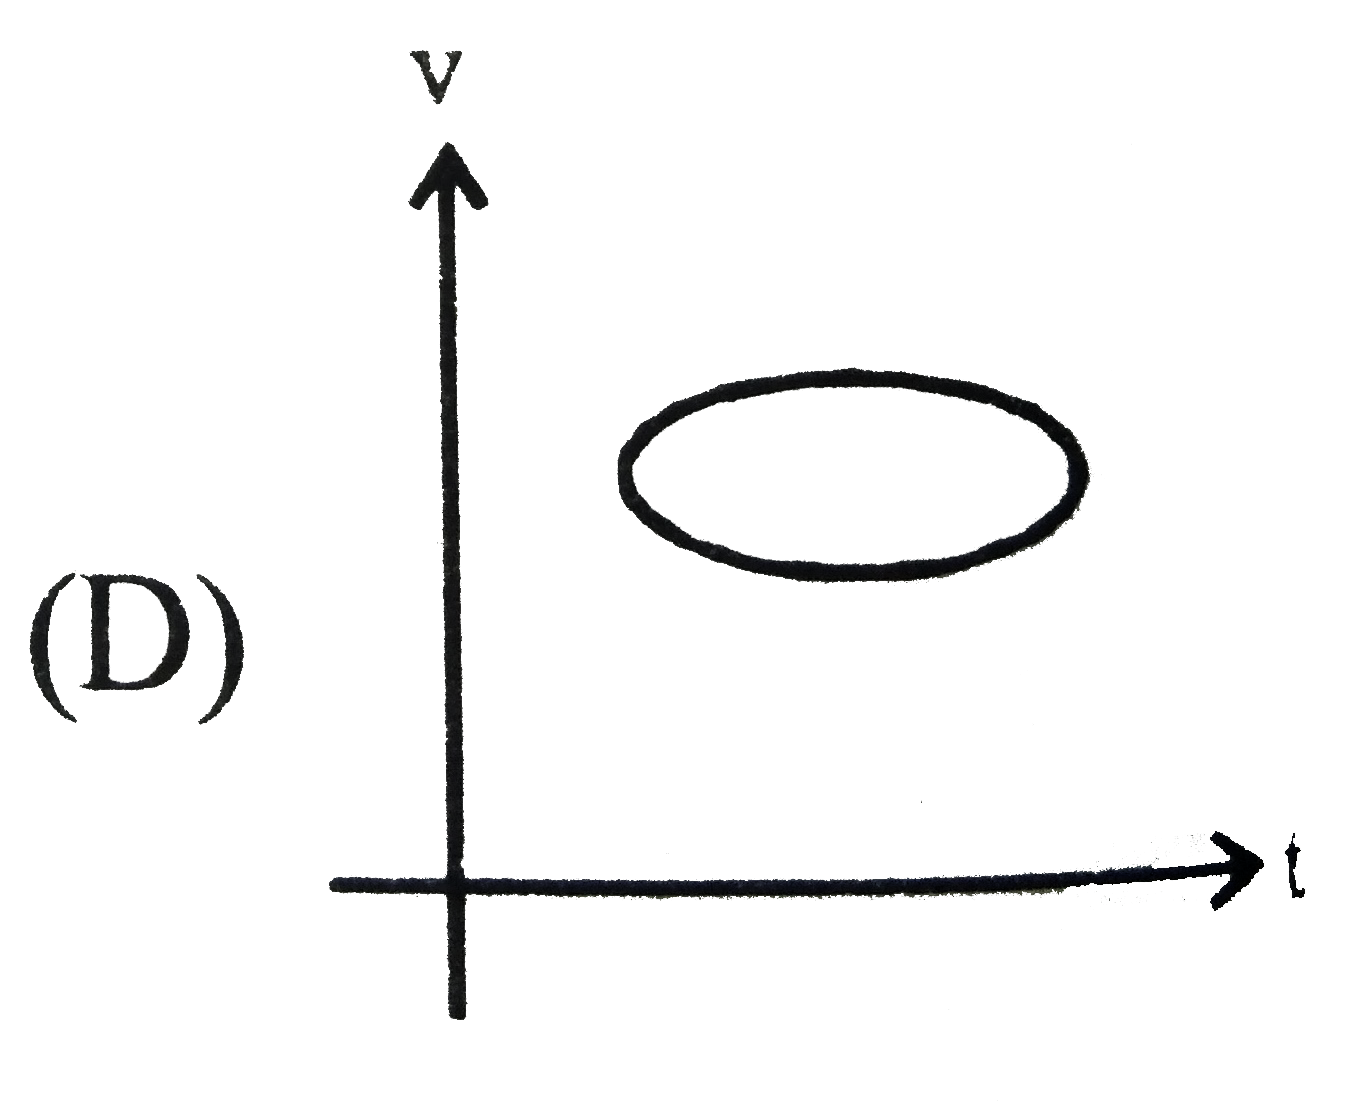
Which of the following velocity-time graph is not possible?
A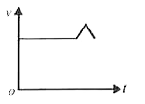 B
B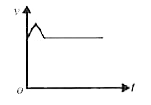 C
C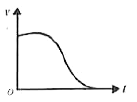 D
D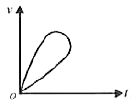
Which of the following distance-time graphs is not possible?
View SolutionWhich of the following displacement (X) time graphs is not possible?
View SolutionWhich of the following distance-time graphs shows a truck moving with speed which is not constant?
View SolutionWhich of the following distance-time graphs shows a truck moving with speed which is not constant?
View SolutionA car parked on a road side from sometime, starts moving with a constant speed. Which of the following distance-time graph shows the motion of that car ?
View Solution

