Which of the following graphs represent the behavior of an ideal gas? Symbols have their usual meaning.
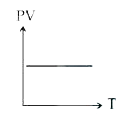
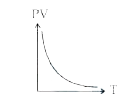
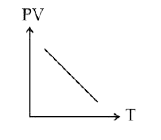
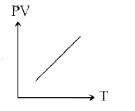
To determine which graph represents the behavior of an ideal gas, we can use the Ideal Gas Law, which is given by the equation:
PV=nRT
Where:
- P = Pressure
- V = Volume
- n = Number of moles (constant for a given amount of gas)
- R = Ideal gas constant (constant)
- T = Temperature
1. Understanding the Ideal Gas Law:
- The Ideal Gas Law states that for a fixed amount of gas at constant n and R, the product of pressure P and volume V is directly proportional to the temperature T.
- This can be rearranged to show that PV is proportional to T:
PV∝T
2. Rearranging the Equation:
- We can express this relationship in a linear form:
PV=nRT
- If we let Y=PV and X=T, we can rewrite the equation as:
Y=nR1X
- This is the equation of a straight line that passes through the origin, where nR1 is the slope.
3. Identifying the Graph:
- We need to find a graph that represents a linear relationship between PV and T that passes through the origin.
- A straight line passing through the origin indicates that when T=0, PV must also be 0.
4. Analyzing the Given Options:
- Look at each graph option provided:
- If a graph is a straight line and passes through the origin, it represents the behavior of an ideal gas.
- If a graph is not a straight line or does not pass through the origin, it does not represent the behavior of an ideal gas.
5. Conclusion:
- After analyzing the options, the graph that is a straight line and passes through the origin is the correct representation of the behavior of an ideal gas.
- Therefore, the correct answer is Option 4.
- P = Pressure
- V = Volume
- n = Number of moles (constant for a given amount of gas)
- R = Ideal gas constant (constant)
- T = Temperature
- The Ideal Gas Law states that for a fixed amount of gas at constant n and R, the product of pressure P and volume V is directly proportional to the temperature T.
- This can be rearranged to show that PV is proportional to T:
PV∝T
- We can express this relationship in a linear form:
PV=nRT
- If we let Y=PV and X=T, we can rewrite the equation as:
Y=nR1X
- This is the equation of a straight line that passes through the origin, where nR1 is the slope.
- We need to find a graph that represents a linear relationship between PV and T that passes through the origin.
- A straight line passing through the origin indicates that when T=0, PV must also be 0.
- Look at each graph option provided:
- If a graph is a straight line and passes through the origin, it represents the behavior of an ideal gas.
- If a graph is not a straight line or does not pass through the origin, it does not represent the behavior of an ideal gas.
- After analyzing the options, the graph that is a straight line and passes through the origin is the correct representation of the behavior of an ideal gas.
- Therefore, the correct answer is Option 4.
Topper's Solved these Questions
- BOOK - JEE MAINS PREVIOUS YEARCHAPTER - JEE MAINS 2021EXERCISE - Physics Section A39videos
JEE MAINS 2021
- BOOK - JEE MAINS PREVIOUS YEARCHAPTER - JEE MAINS 2021EXERCISE - Physics Section B20videos
JEE MAINS 2021
- BOOK - JEE MAINS PREVIOUS YEARCHAPTER - JEE MAINS 2021EXERCISE - PHYSICS (SECTION - B)20videos
JEE MAINS 2021
- BOOK - JEE MAINS PREVIOUS YEARCHAPTER - JEE MAINS 2020EXERCISE - PHYSICS246videos
JEE MAINS 2020
- BOOK - JEE MAINS PREVIOUS YEARCHAPTER - JEE MAINS 2022EXERCISE - PHYSICS (SECTION -B)10videos
JEE MAINS 2022
Similar Questions
Knowledge Check
- Question 1 - Select One
Which of the following graphs represent the behaviour of an ideal gas ?
A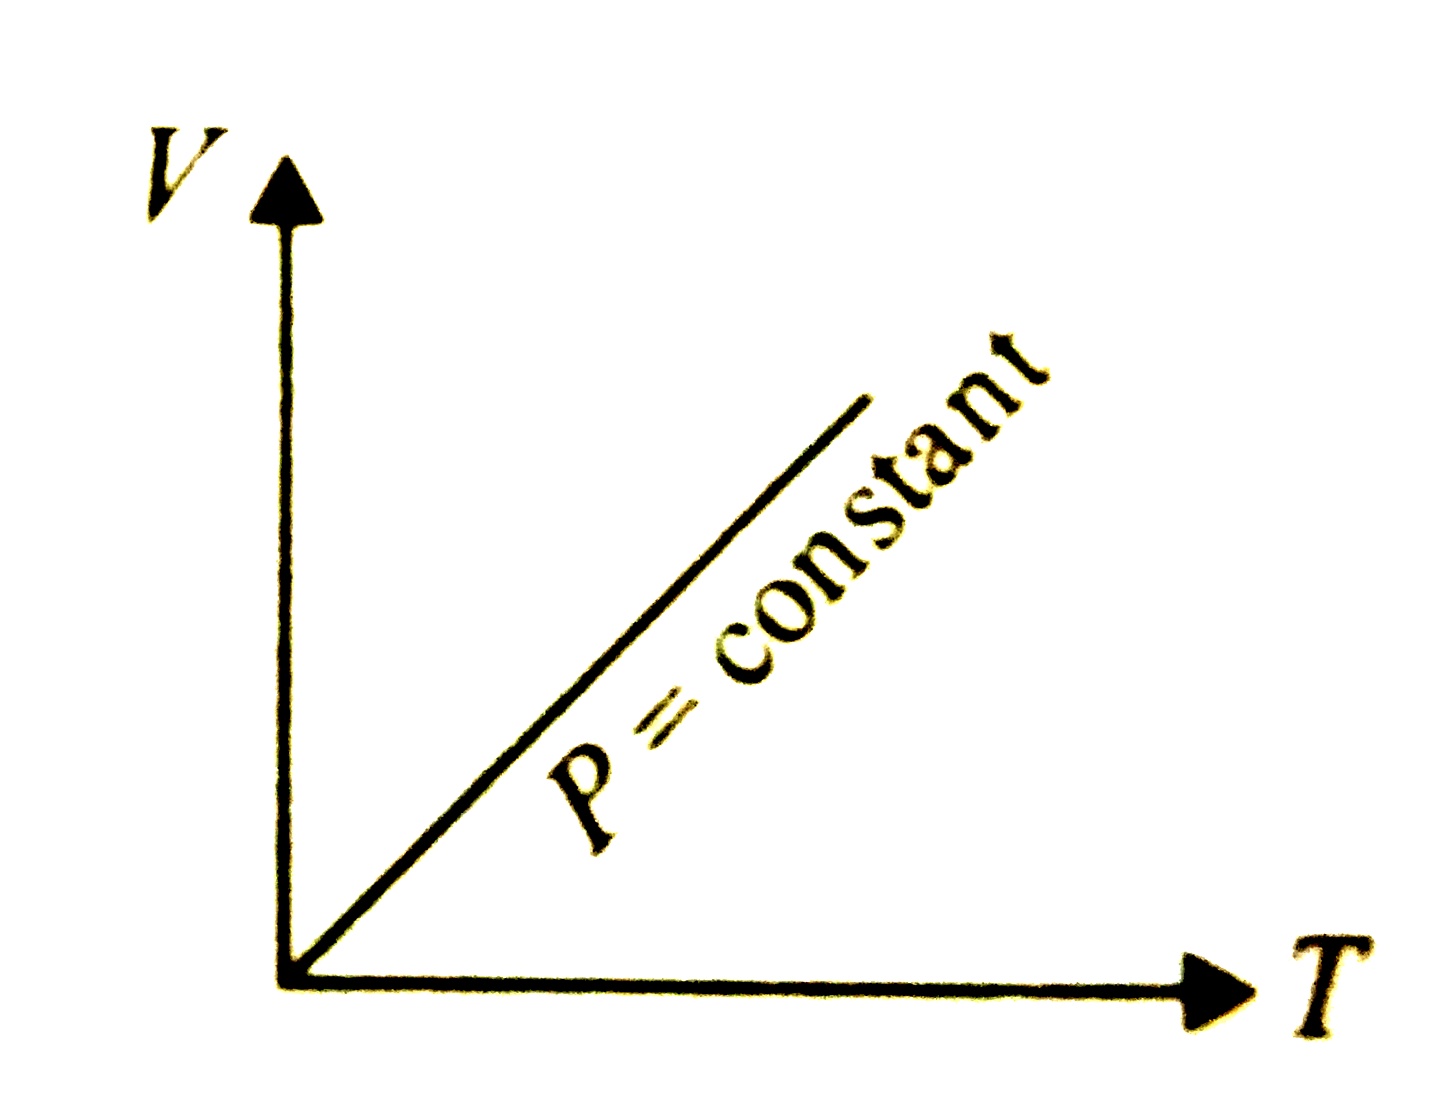 B
B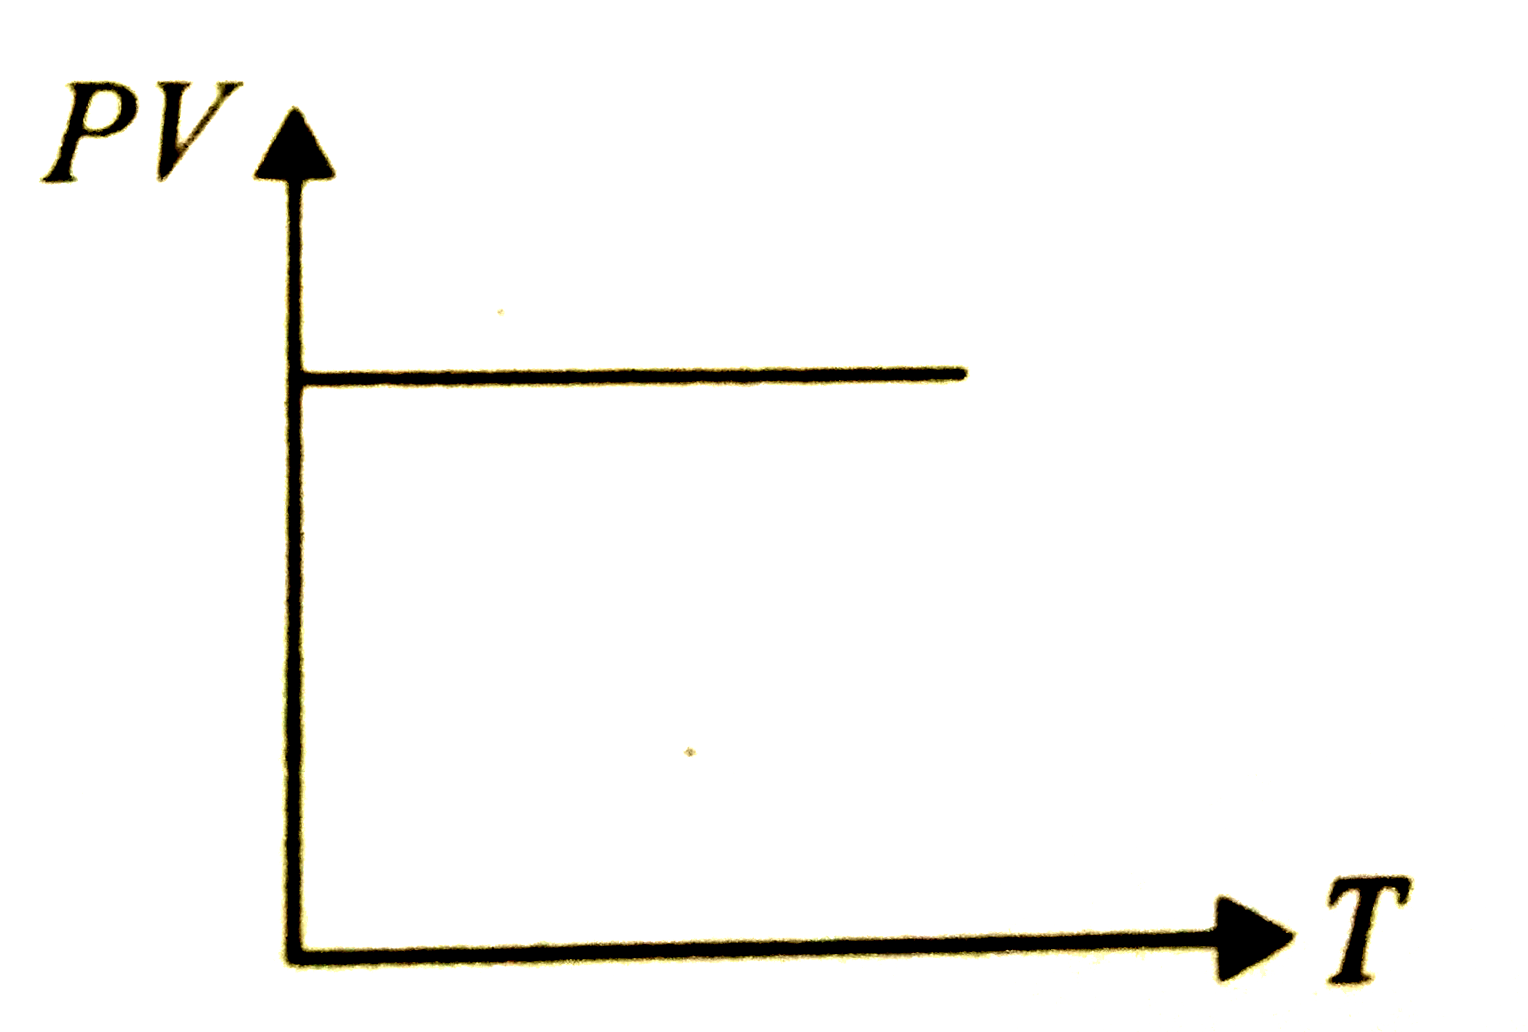 C
C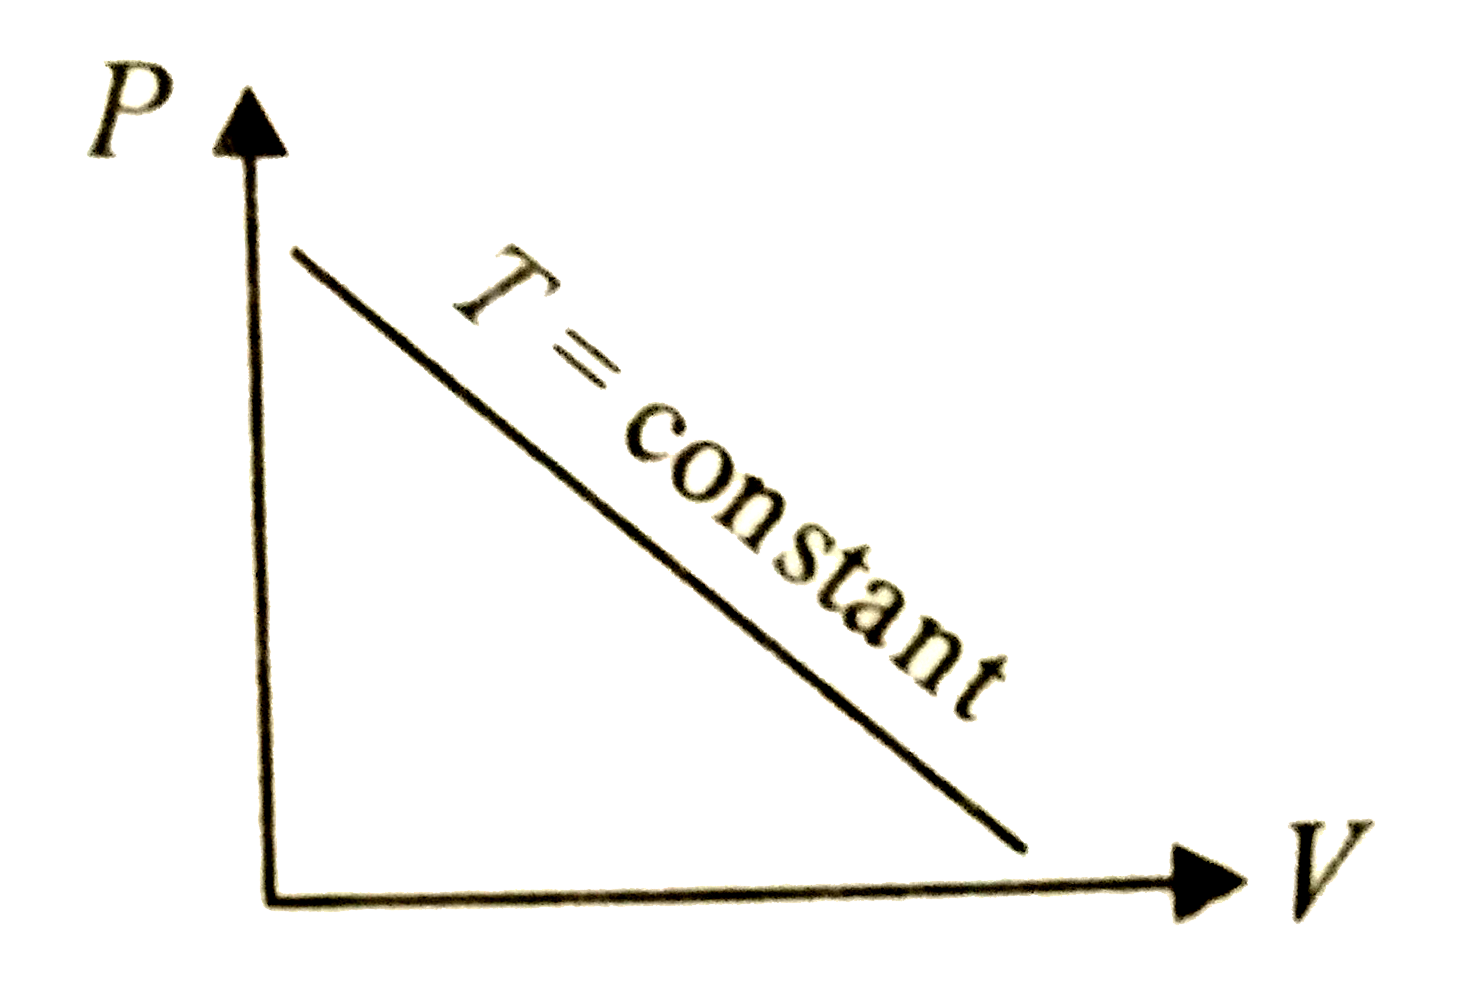 D
D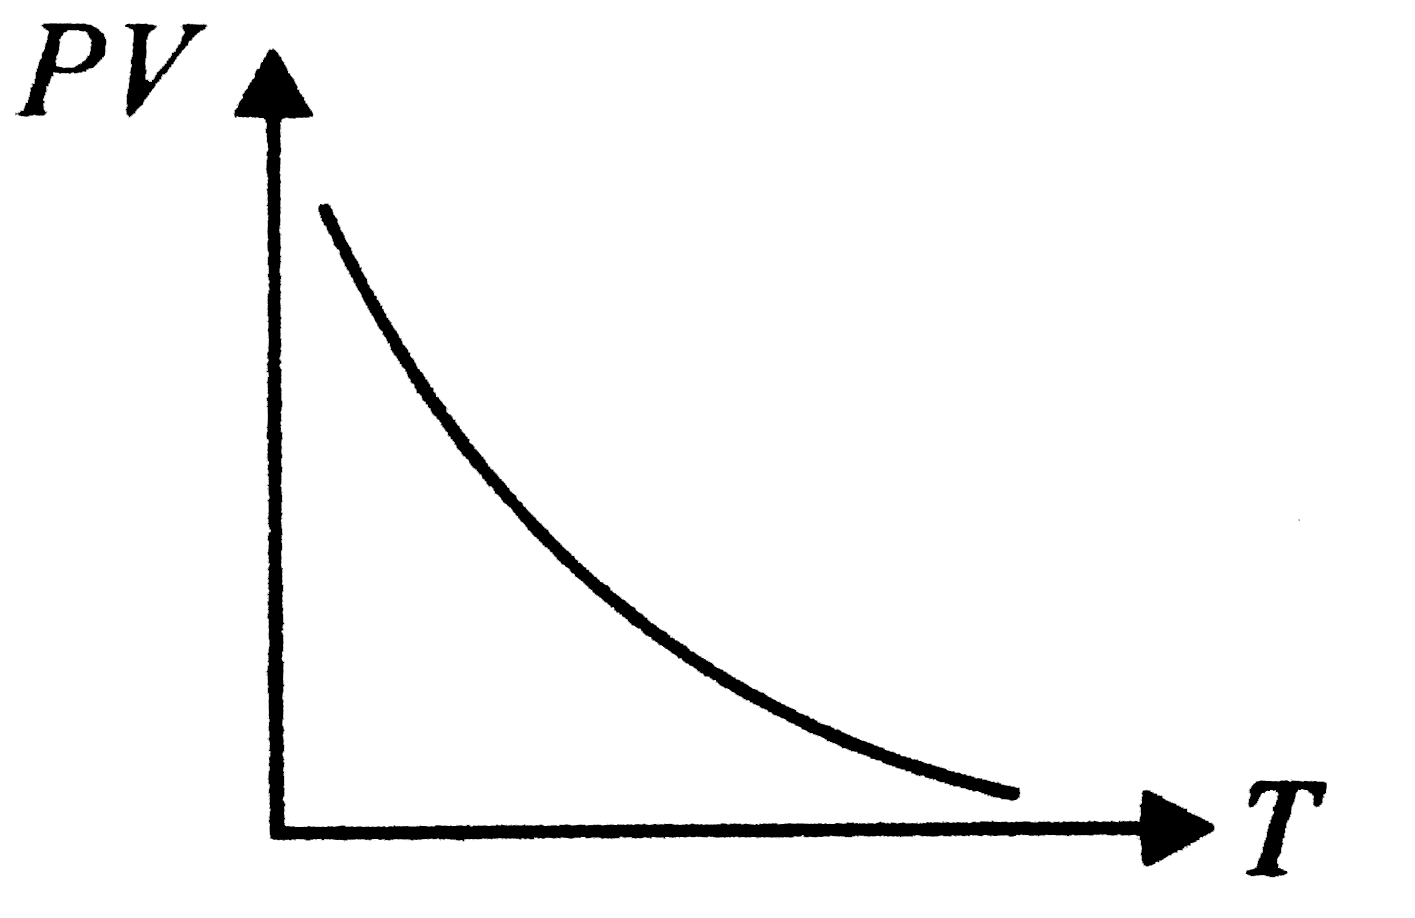
- Question 2 - Select One
Which curve in the following graph represents the curve of ideal gas ?
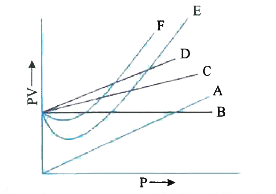 AB onlyBC and D onlyCE and F onlyDA and B only
 - Question 3 - Select One
Using velocity time graph, establish the relation s=ut+12at2, where the symbols have their usual meanings.
A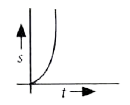 B
B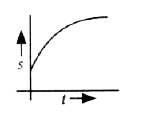 C
C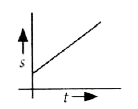 D
D
Which of the following plots represents the behavior of an ideal binary liquid solution ?
View SolutionWhich of the following graphs is not a straight line for an ideal gas ?
View Solution
Which of the following graphs are correct for a second order reaction: (where symbols have their usual meanings)View SolutionWhich of the following graphs is consistent with ideal gas behaviour?
View SolutionThe correct combination is (symbols have their usual meanings)
 View Solution

