Which of the following graphs represent the behaviour of an ideal gas ?
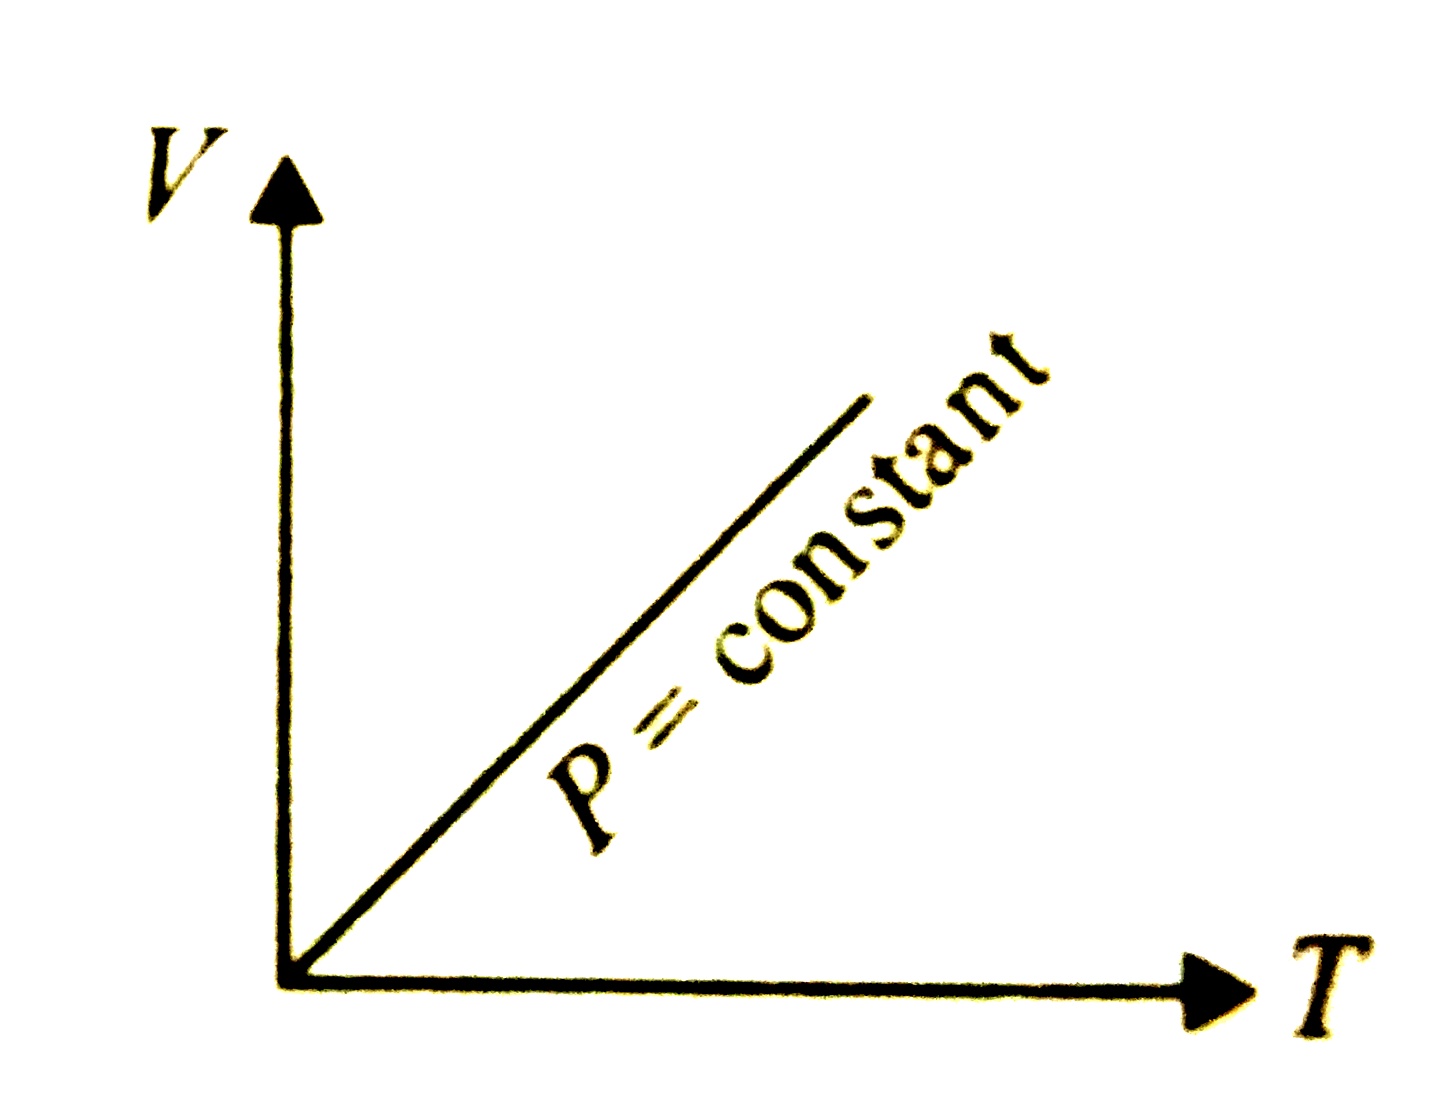
1.
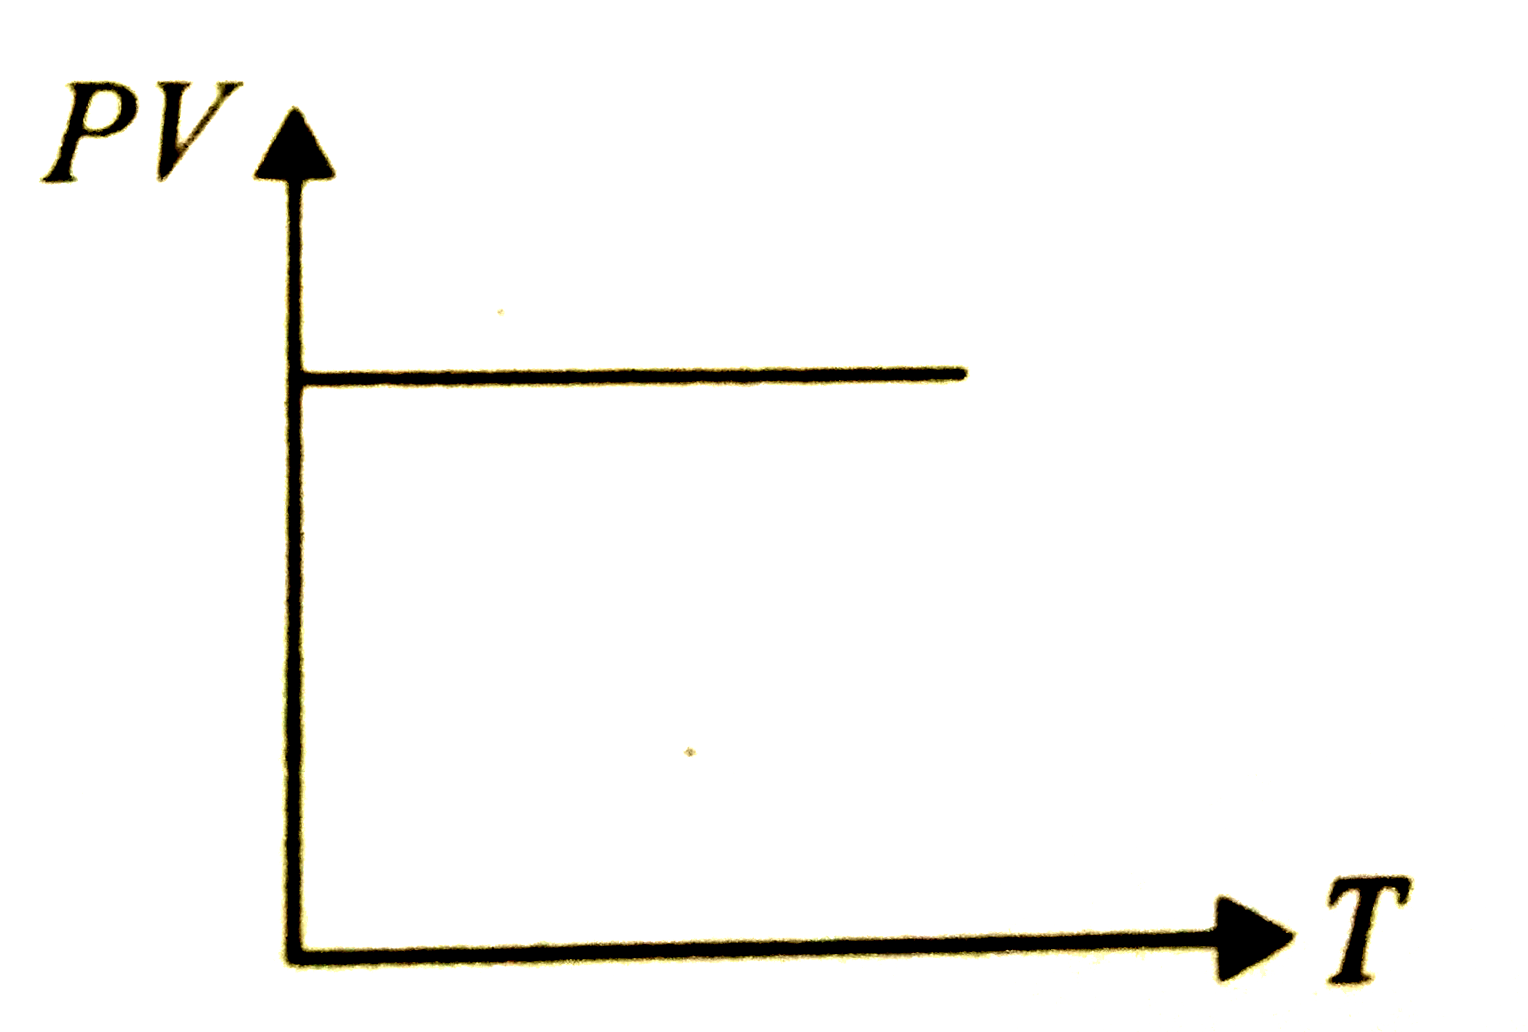
2. 
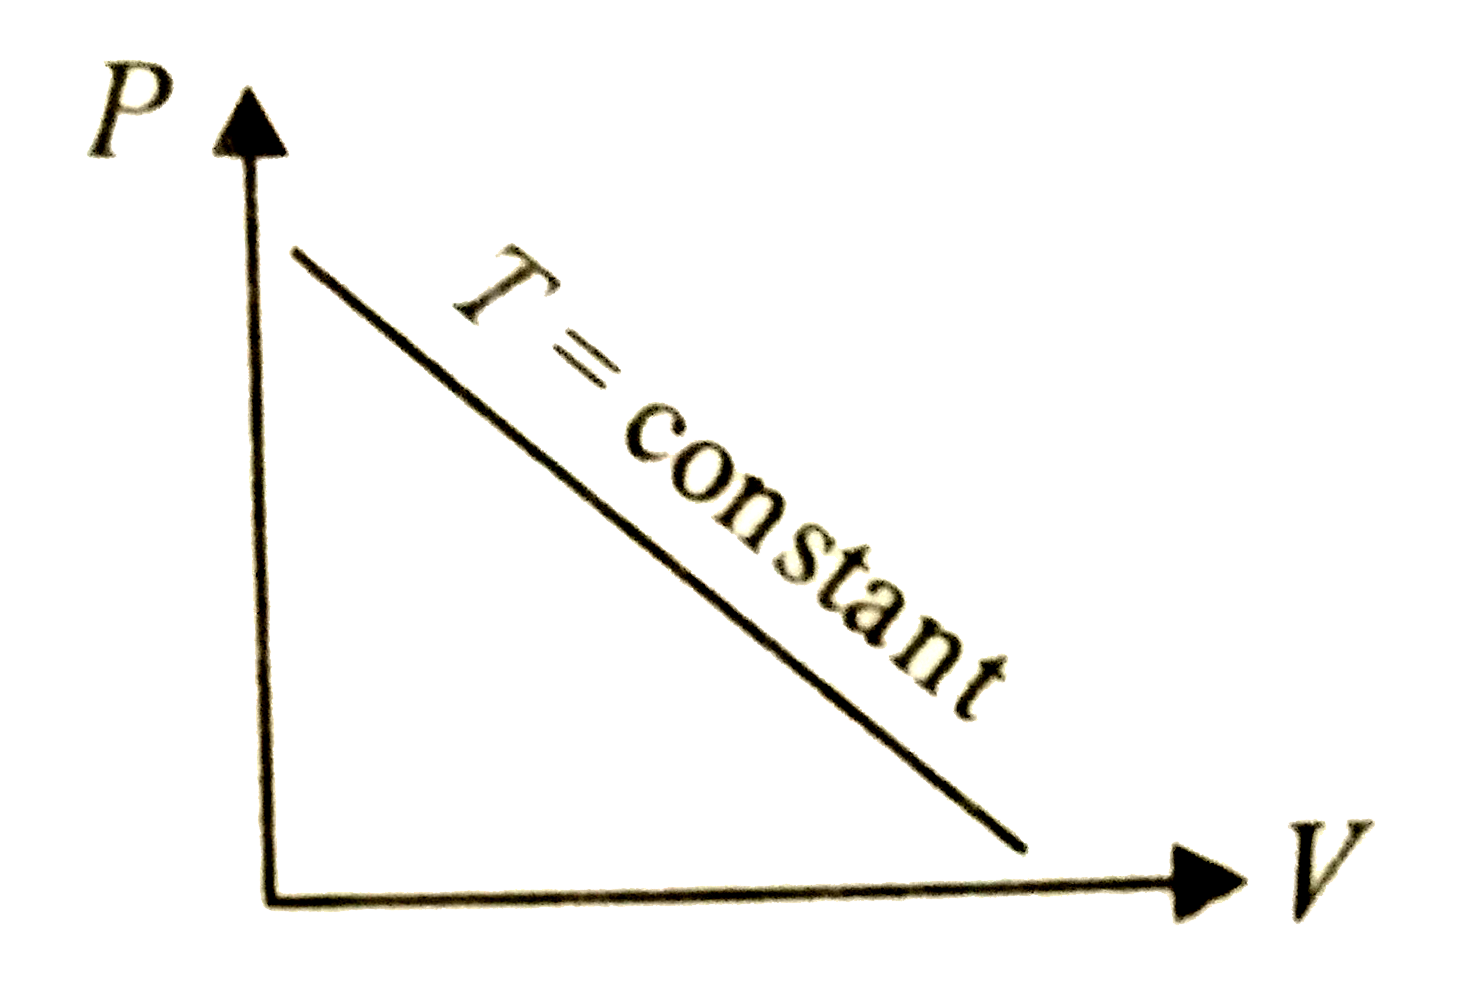
3. 
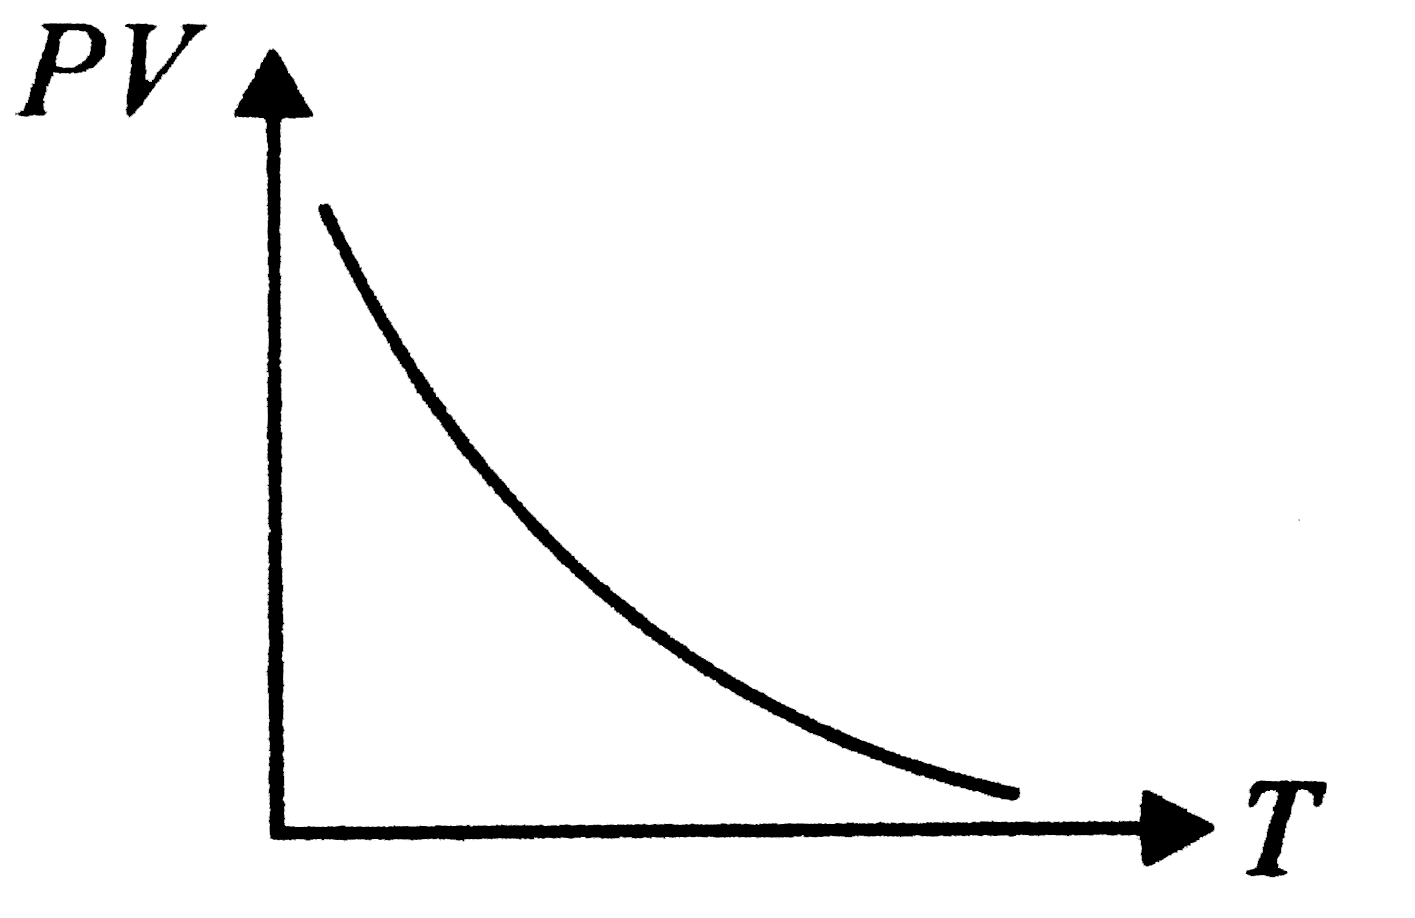
4. 
The correct Answer is:A
To determine which graph represents the behavior of an ideal gas, we can analyze the options based on the Ideal Gas Law, which is expressed as:
PV=nRT
Where:
- P = Pressure
- V = Volume
- n = Number of moles of gas
- R = Ideal gas constant
- T = Temperature
1. Understand the Ideal Gas Law:
- The equation PV=nRT shows the relationship between pressure, volume, and temperature for an ideal gas.
2. Analyze Option 1:
- The graph shows P vs T with V held constant.
- Rearranging the Ideal Gas Law for constant V gives P∝T.
- This indicates a linear relationship, which can be represented as P=kT (where k is a constant).
- This graph will be a straight line passing through the origin.
- Conclusion: This graph represents the behavior of an ideal gas.
3. Analyze Option 2:
- The graph shows PV vs T.
- From the Ideal Gas Law, if n and R are constants, then PV=nRT implies PV is directly proportional to T.
- However, if the graph does not pass through the origin, it does not represent a direct proportionality.
- Conclusion: This graph does not represent the behavior of an ideal gas.
4. Analyze Option 3:
- The graph shows P vs V with T held constant.
- From the Ideal Gas Law, if T is constant, then PV=constant.
- This relationship describes a hyperbola, not a straight line.
- Conclusion: This graph does not represent the behavior of an ideal gas.
5. Analyze Option 4:
- The graph shows PV vs T.
- As established, PV should be a straight line when plotted against T if n and R are constant.
- If the graph is curved, it does not represent a direct proportionality.
- Conclusion: This graph does not represent the behavior of an ideal gas.
Final Answer:
- Option 1 is the only correct option that represents the behavior of an ideal gas.
- P = Pressure
- V = Volume
- n = Number of moles of gas
- R = Ideal gas constant
- T = Temperature
- The equation PV=nRT shows the relationship between pressure, volume, and temperature for an ideal gas.
- The graph shows P vs T with V held constant.
- Rearranging the Ideal Gas Law for constant V gives P∝T.
- This indicates a linear relationship, which can be represented as P=kT (where k is a constant).
- This graph will be a straight line passing through the origin.
- Conclusion: This graph represents the behavior of an ideal gas.
- The graph shows PV vs T.
- From the Ideal Gas Law, if n and R are constants, then PV=nRT implies PV is directly proportional to T.
- However, if the graph does not pass through the origin, it does not represent a direct proportionality.
- Conclusion: This graph does not represent the behavior of an ideal gas.
- The graph shows P vs V with T held constant.
- From the Ideal Gas Law, if T is constant, then PV=constant.
- This relationship describes a hyperbola, not a straight line.
- Conclusion: This graph does not represent the behavior of an ideal gas.
- The graph shows PV vs T.
- As established, PV should be a straight line when plotted against T if n and R are constant.
- If the graph is curved, it does not represent a direct proportionality.
- Conclusion: This graph does not represent the behavior of an ideal gas.
- Option 1 is the only correct option that represents the behavior of an ideal gas.
Topper's Solved these Questions
- BOOK - NCERT FINGERTPS ENGLISHCHAPTER - KINETIC THEORYEXERCISE - Kinetic Theory of An Ideal Gas18videos
KINETIC THEORY
- BOOK - NCERT FINGERTPS ENGLISHCHAPTER - KINETIC THEORYEXERCISE - LAW OF EQUIPARTITION OF ENERGY5videos
KINETIC THEORY
- BOOK - NCERT FINGERTPS ENGLISHCHAPTER - KINETIC THEORYEXERCISE - Assertion And Reason10videos
KINETIC THEORY
- BOOK - NCERT FINGERTPS ENGLISHCHAPTER - GRAVITATIONEXERCISE - Assertion And Reason15videos
GRAVITATION
- BOOK - NCERT FINGERTPS ENGLISHCHAPTER - LAWS OF MOTIONEXERCISE - Assertion And Reason15videos
LAWS OF MOTION
Similar Questions
Knowledge Check
- Question 1 - Select One
Which of the following graphs represents exothermic reaction ?
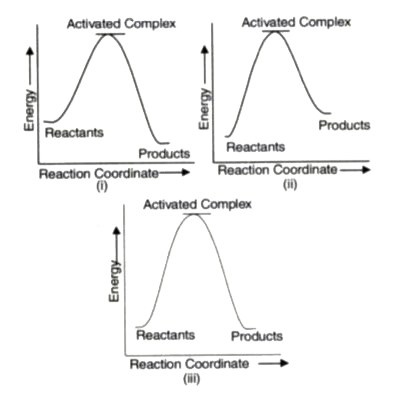 A(i) onlyB(ii) onlyC(iii) onlyD(i) and (ii)
 - Question 2 - Select One
Which of the following graphs represents exothermic reaction ?
 A(i) onlyB(ii) onlyC(iii) onlyD(i) and (ii)
 - Question 3 - Select One
Which of the following graphs represents exothermic reaction ?
 A(i) onlyB(ii) onlyC(iii) onlyD(i) and (ii)
Which of the following graph represents uniform motion
View SolutionWhich of the following graph represents Boyle's law ?
View SolutionWhich of the following graphs represents exothoermic reaction?
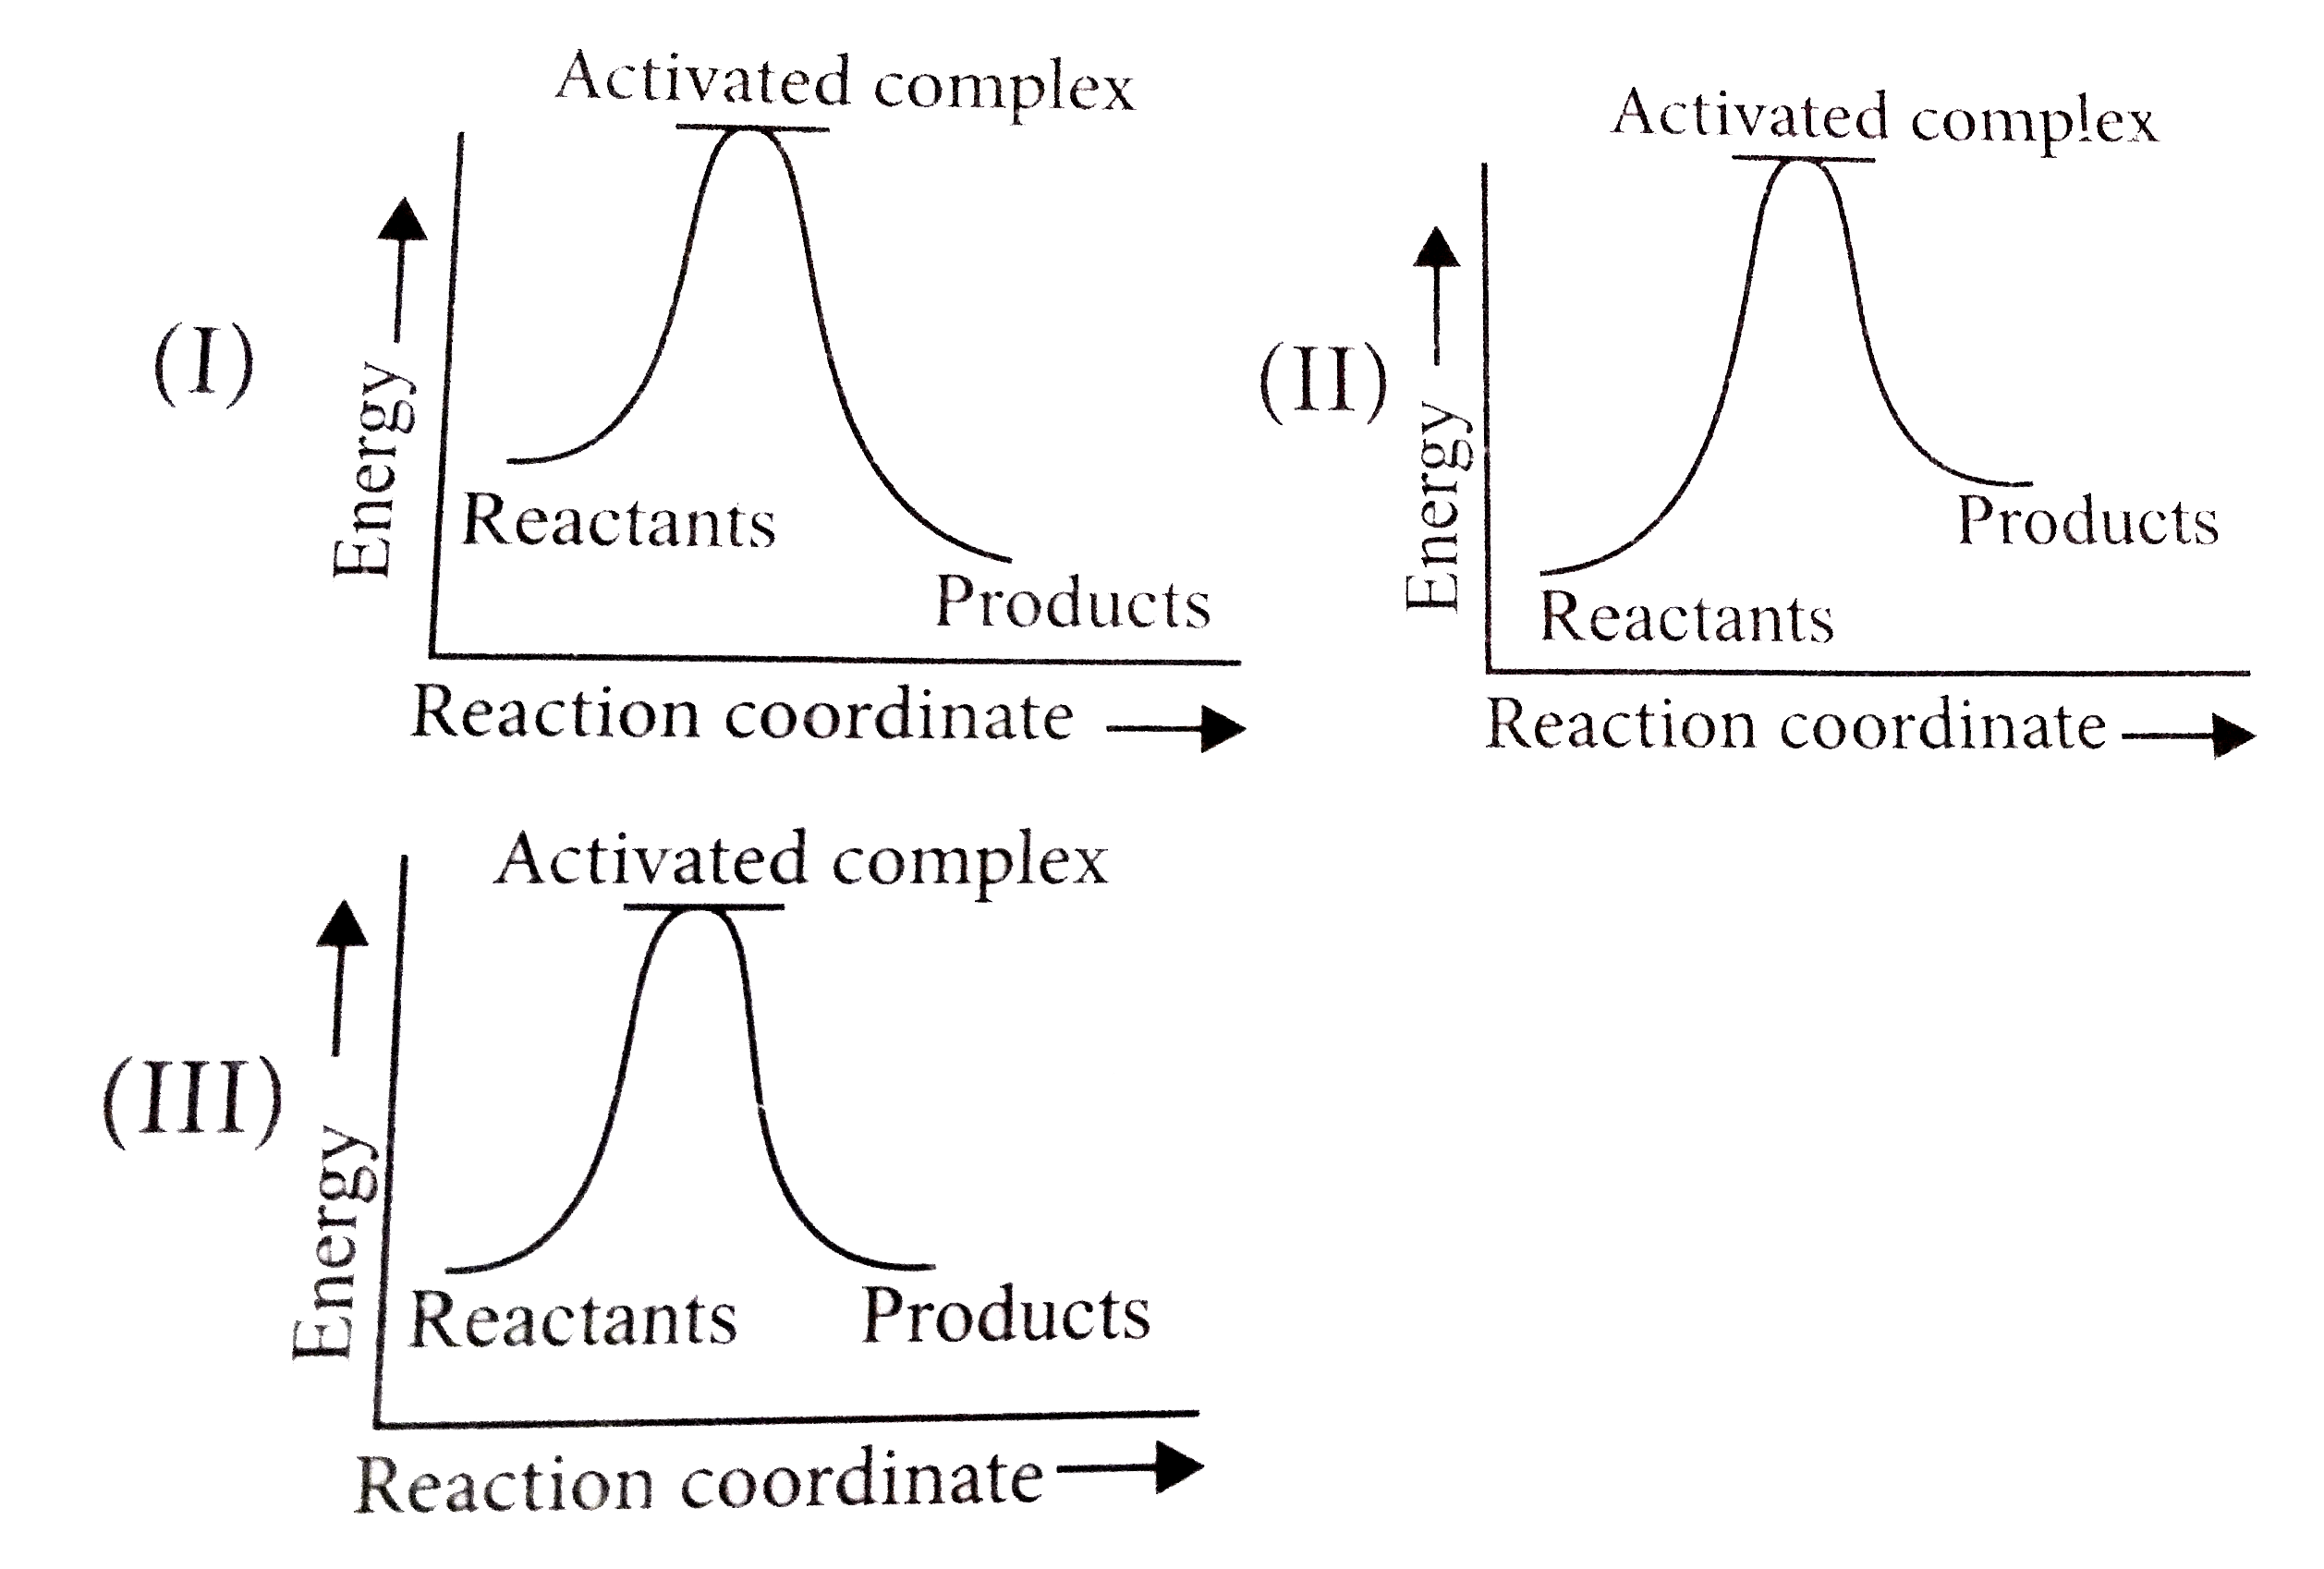 View Solution
Which of the following graphs represents the correct Boyle's law ?
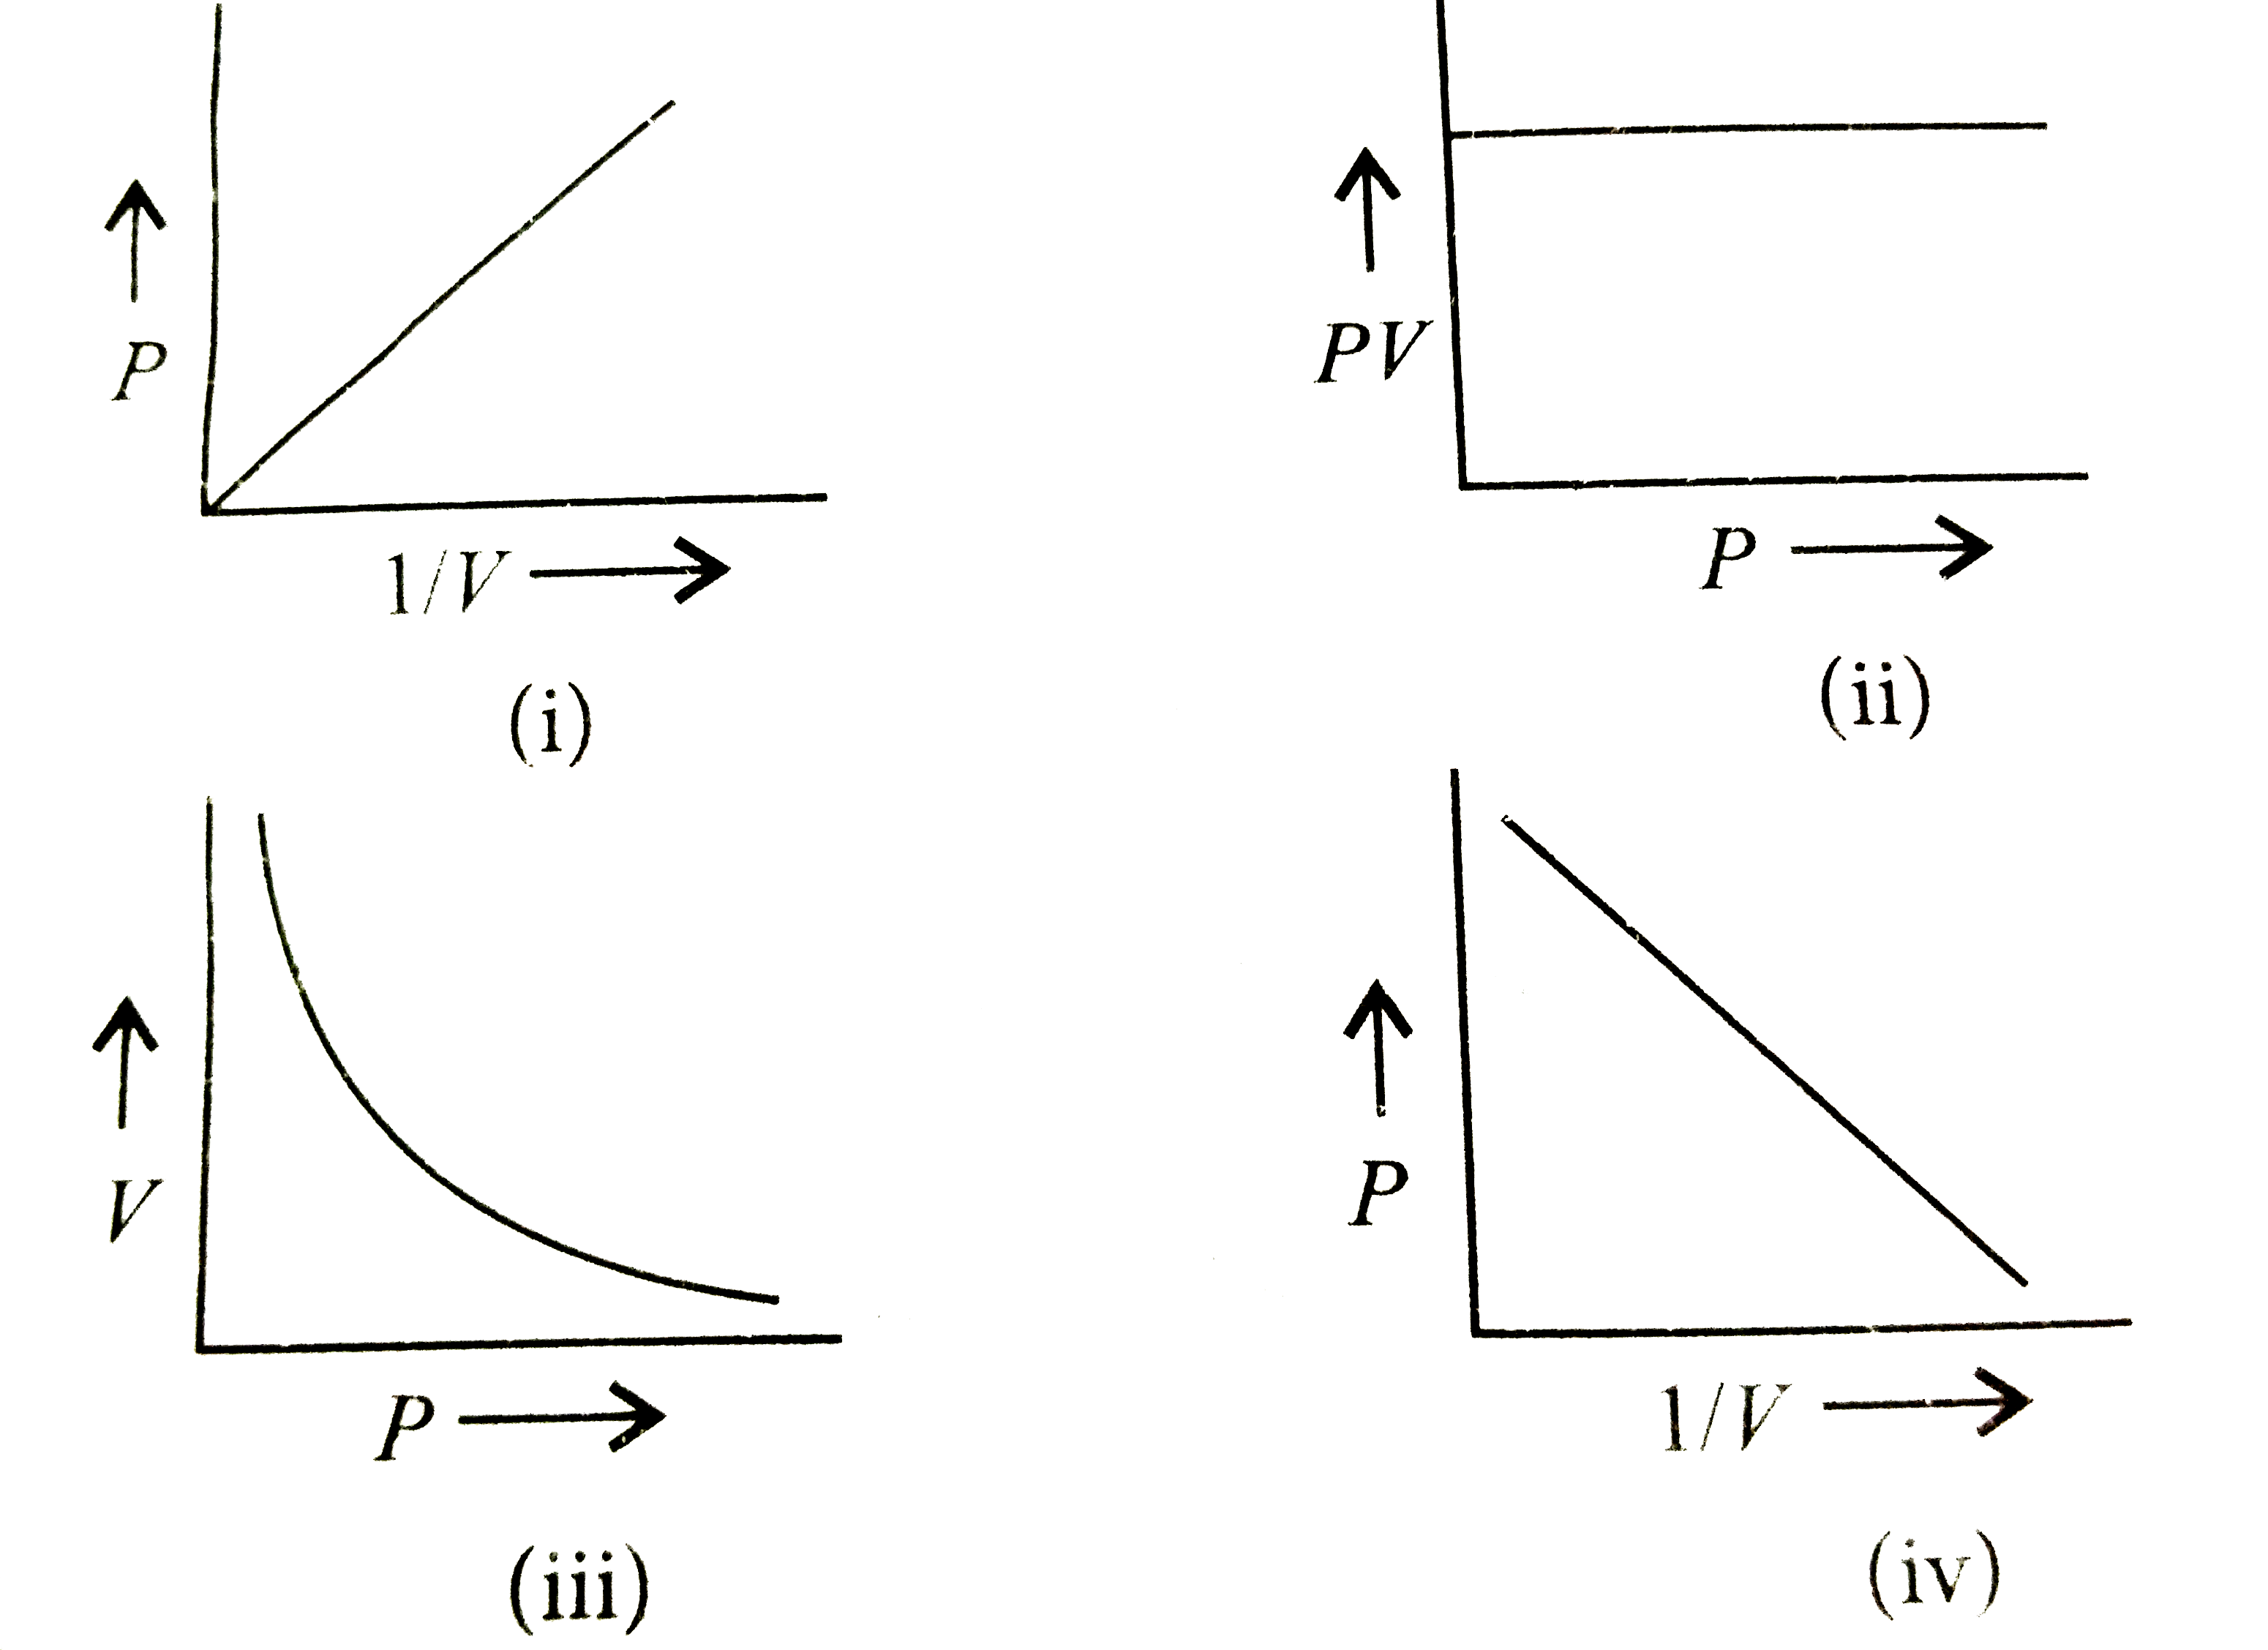 View Solution
Which of the following graph represents the variation of amount of chemisorption of a gas by a solid with temperature under constant pressure?
View Solution


