Which of the following graphs represents the graphical relation between momentum (p) and kinetic energy (K) for a body in motion?
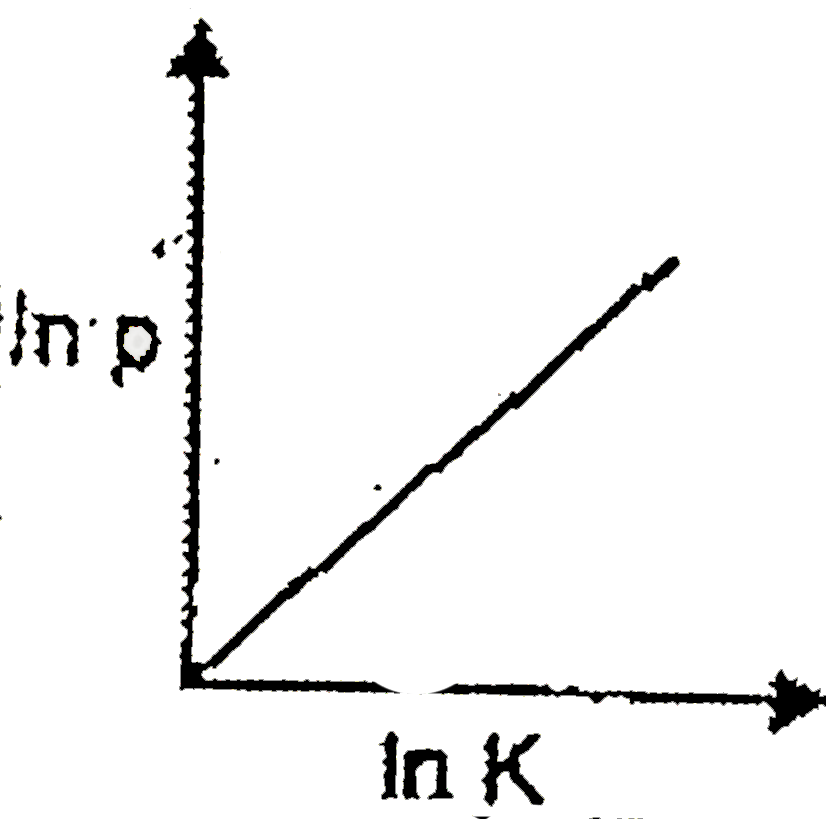
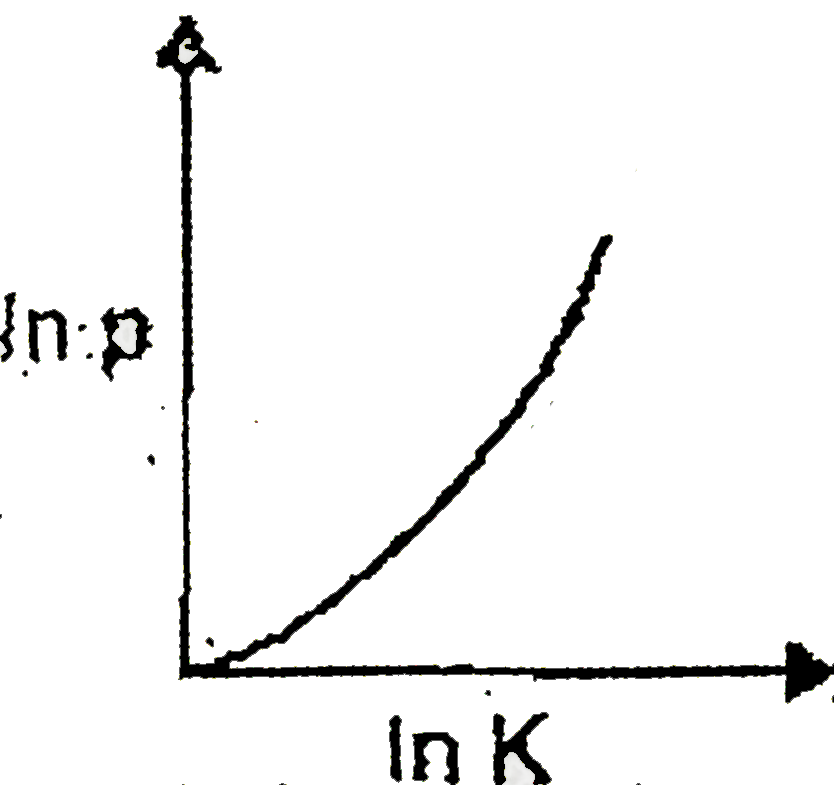
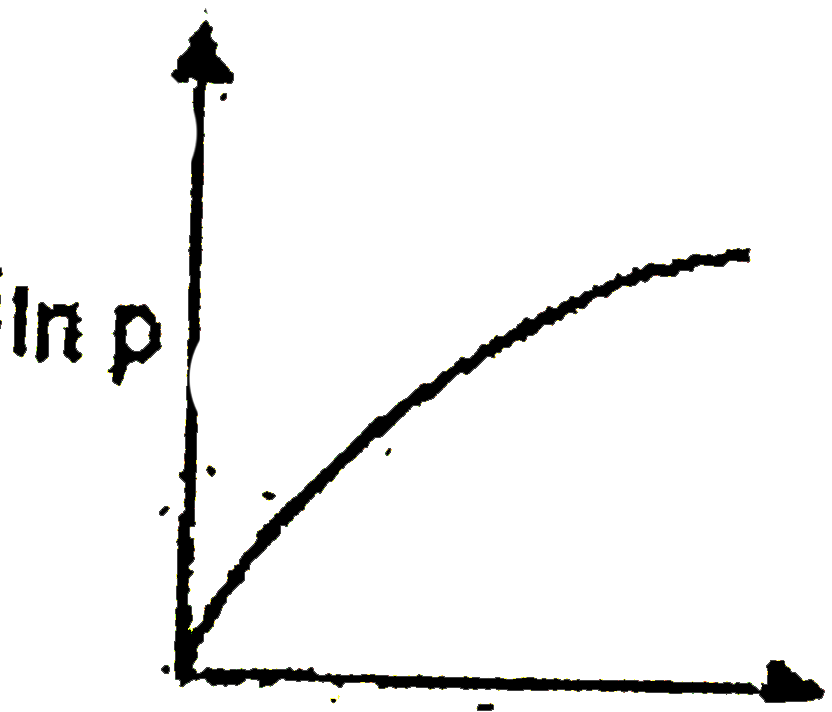
None
The correct Answer is:D
To determine the graphical relation between momentum (p) and kinetic energy (K) for a body in motion, we can follow these steps:
1. Define Momentum and Kinetic Energy:
- Momentum (p) is defined as the product of mass (m) and velocity (v):
p=mv
- Kinetic Energy (K) is defined as:
K=12mv2
2. Express Kinetic Energy in terms of Momentum:
- We can express K in terms of p by substituting v from the momentum equation:
v=pm
- Substituting this into the kinetic energy equation:
K=12m(pm)2=12mp2m2=p22m
3. Analyze the Relationship:
- The equation K=p22m shows that kinetic energy K is proportional to the square of momentum p. This means that if we plot K against p2, we will get a linear relationship.
4. Graphical Representation:
- If we plot K on the y-axis and p2 on the x-axis, the graph will be a straight line with a slope of 12m.
- However, if we plot K against p, the relationship is quadratic, and the graph will be a parabola opening upwards.
5. Conclusion:
- The correct representation of the relationship between momentum and kinetic energy is not a straight line through the origin, but rather a parabolic curve when plotted as K versus p. Therefore, the answer to the question is that none of the provided options accurately represent this relationship.
- Momentum (p) is defined as the product of mass (m) and velocity (v):
p=mv
- Kinetic Energy (K) is defined as:
K=12mv2
- We can express K in terms of p by substituting v from the momentum equation:
v=pm
- Substituting this into the kinetic energy equation:
K=12m(pm)2=12mp2m2=p22m
- The equation K=p22m shows that kinetic energy K is proportional to the square of momentum p. This means that if we plot K against p2, we will get a linear relationship.
- If we plot K on the y-axis and p2 on the x-axis, the graph will be a straight line with a slope of 12m.
- However, if we plot K against p, the relationship is quadratic, and the graph will be a parabola opening upwards.
- The correct representation of the relationship between momentum and kinetic energy is not a straight line through the origin, but rather a parabolic curve when plotted as K versus p. Therefore, the answer to the question is that none of the provided options accurately represent this relationship.
Topper's Solved these Questions
- BOOK - ANURAG MISHRACHAPTER - IMPULSE AND MOMENTUMEXERCISE - L-221videos
IMPULSE AND MOMENTUM
- BOOK - ANURAG MISHRACHAPTER - IMPULSE AND MOMENTUMEXERCISE - L-3,(P-1)5videos
IMPULSE AND MOMENTUM
- BOOK - ANURAG MISHRACHAPTER - IMPULSE AND MOMENTUMEXERCISE - Example50videos
IMPULSE AND MOMENTUM
- BOOK - ANURAG MISHRACHAPTER - FORCE ANALYSISEXERCISE - Matching type13videos
FORCE ANALYSIS
- BOOK - ANURAG MISHRACHAPTER - RIGID BODY MOTIONEXERCISE - MATCH THE COLUMN12videos
RIGID BODY MOTION
Similar Questions
Knowledge Check
- Question 1 - Select One
Which one of the following graphs represents motion?
A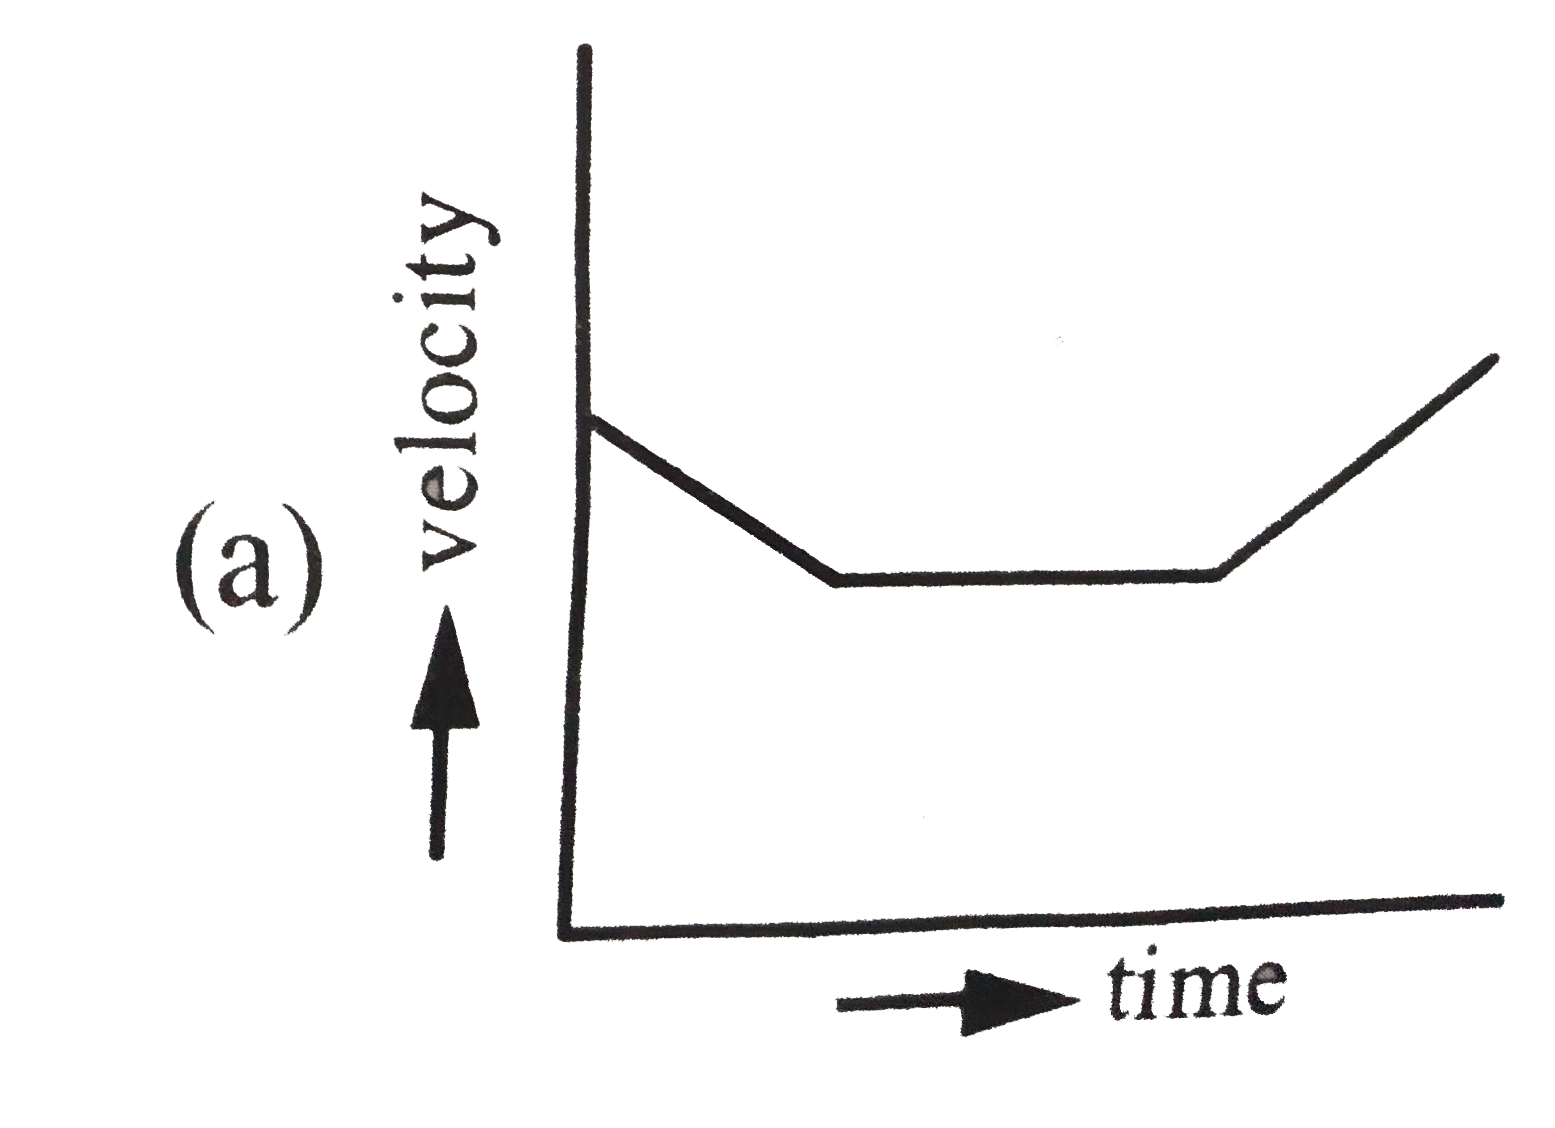 B
B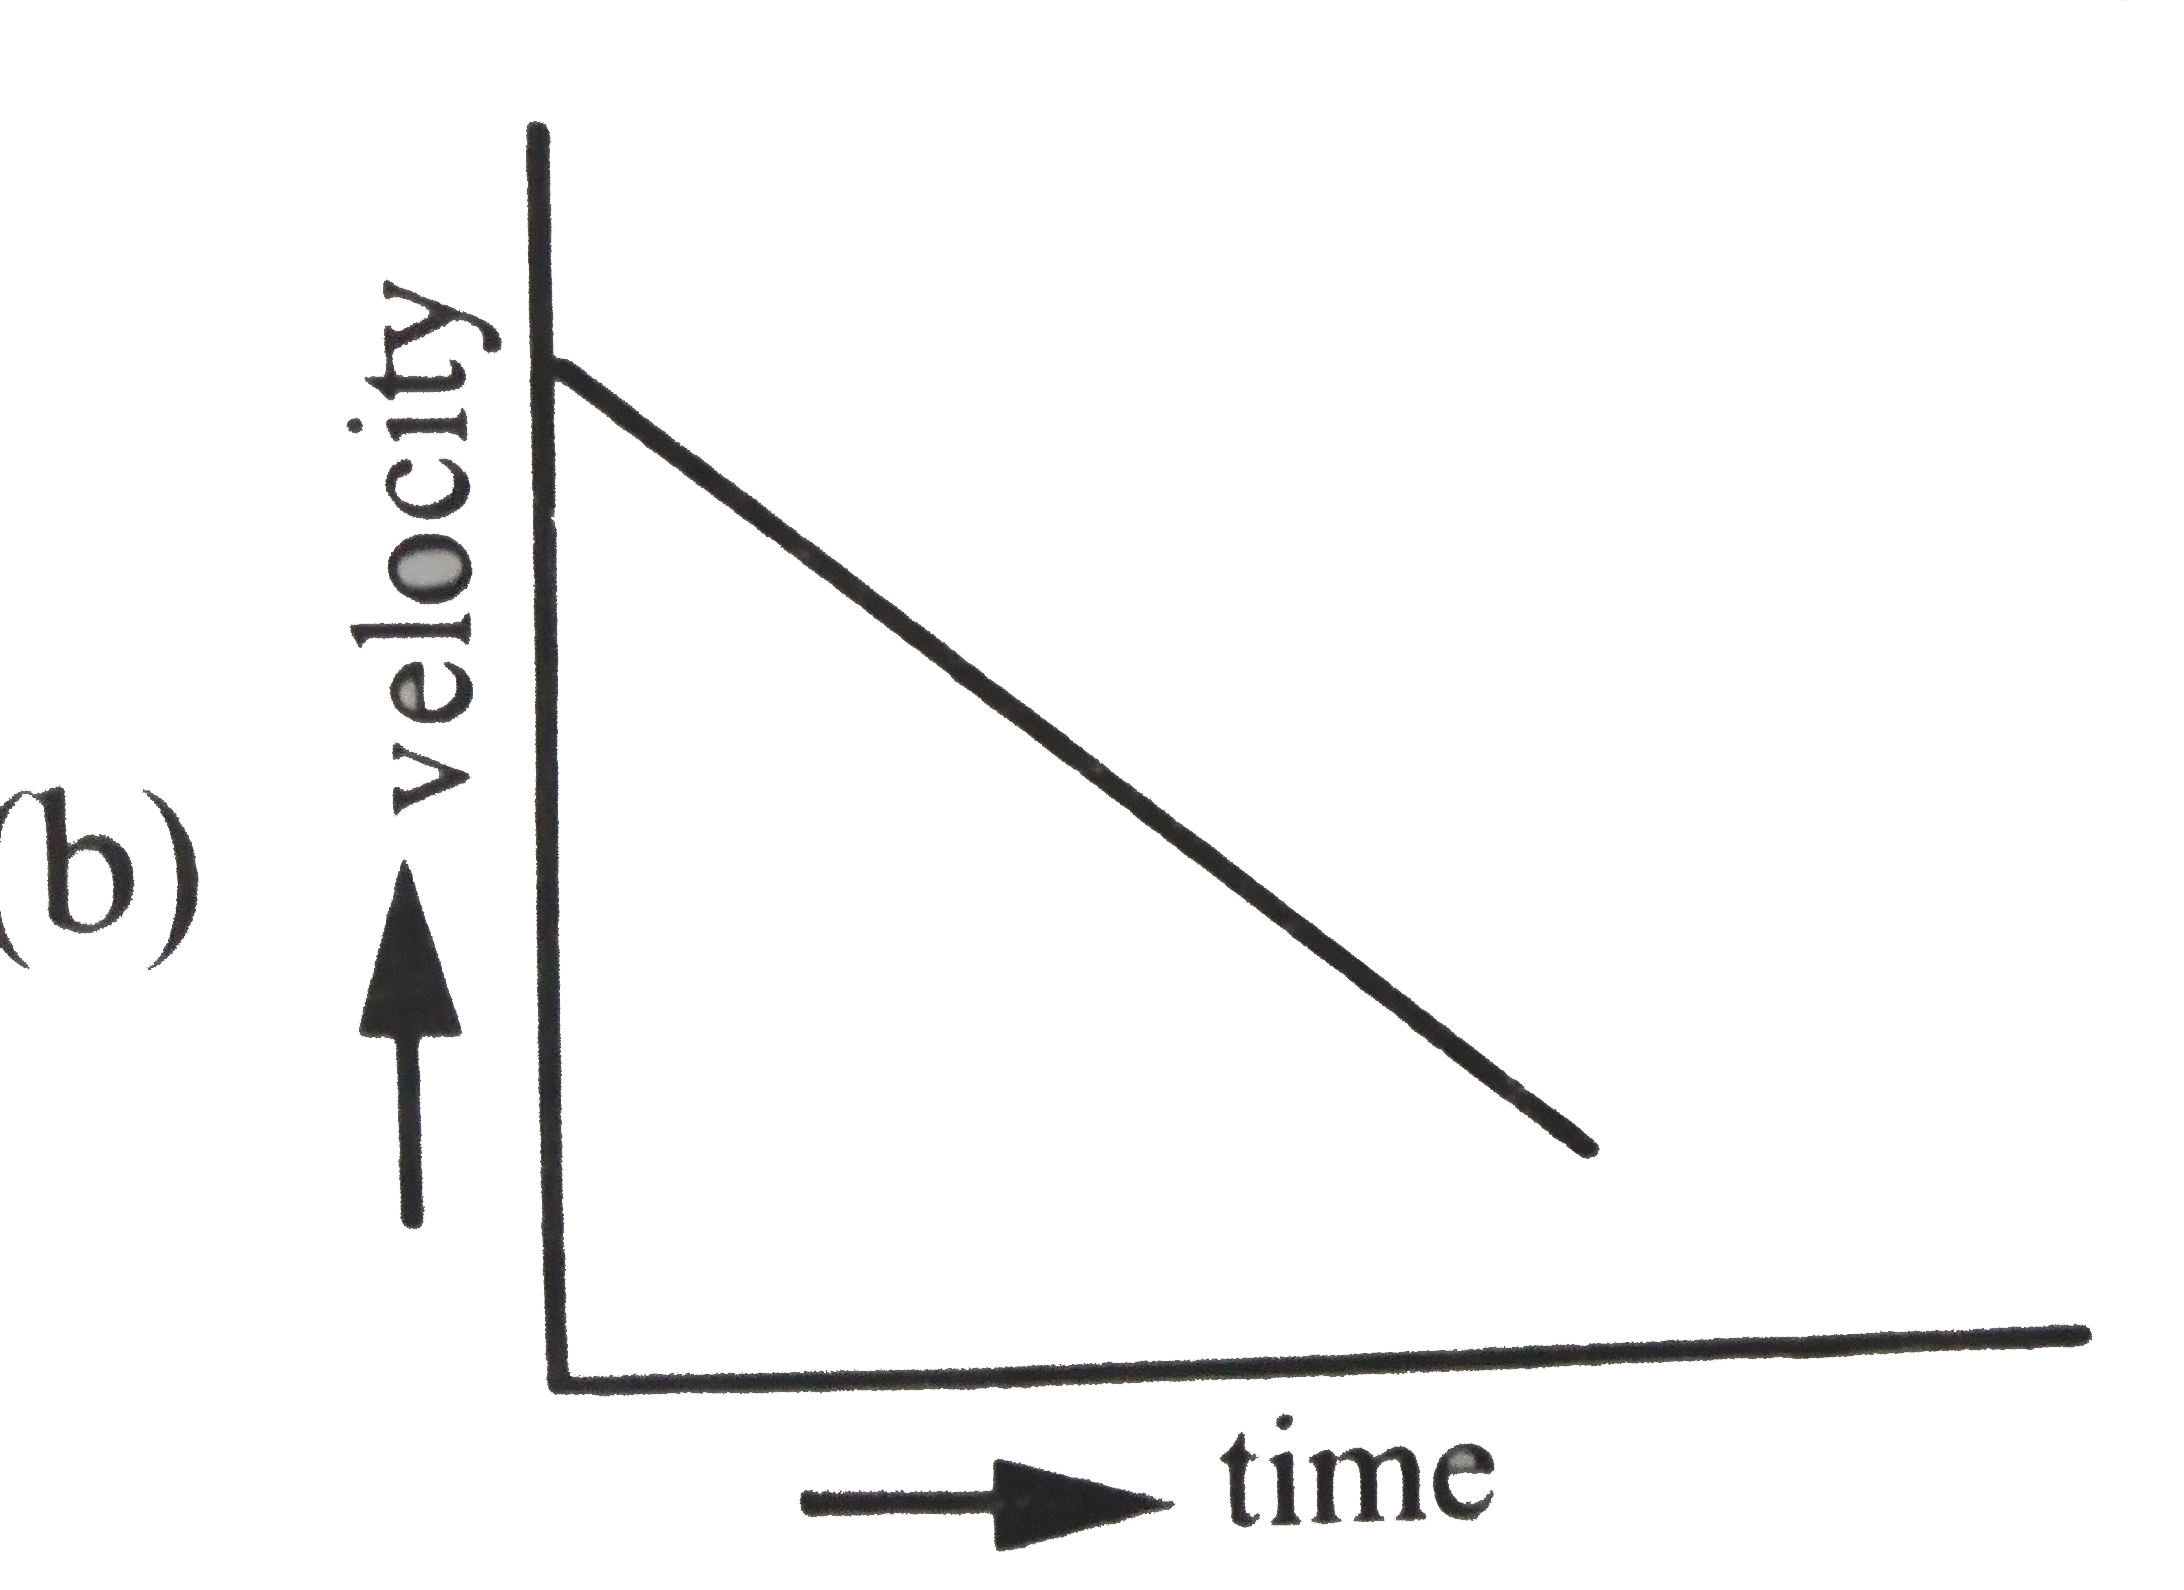 C
C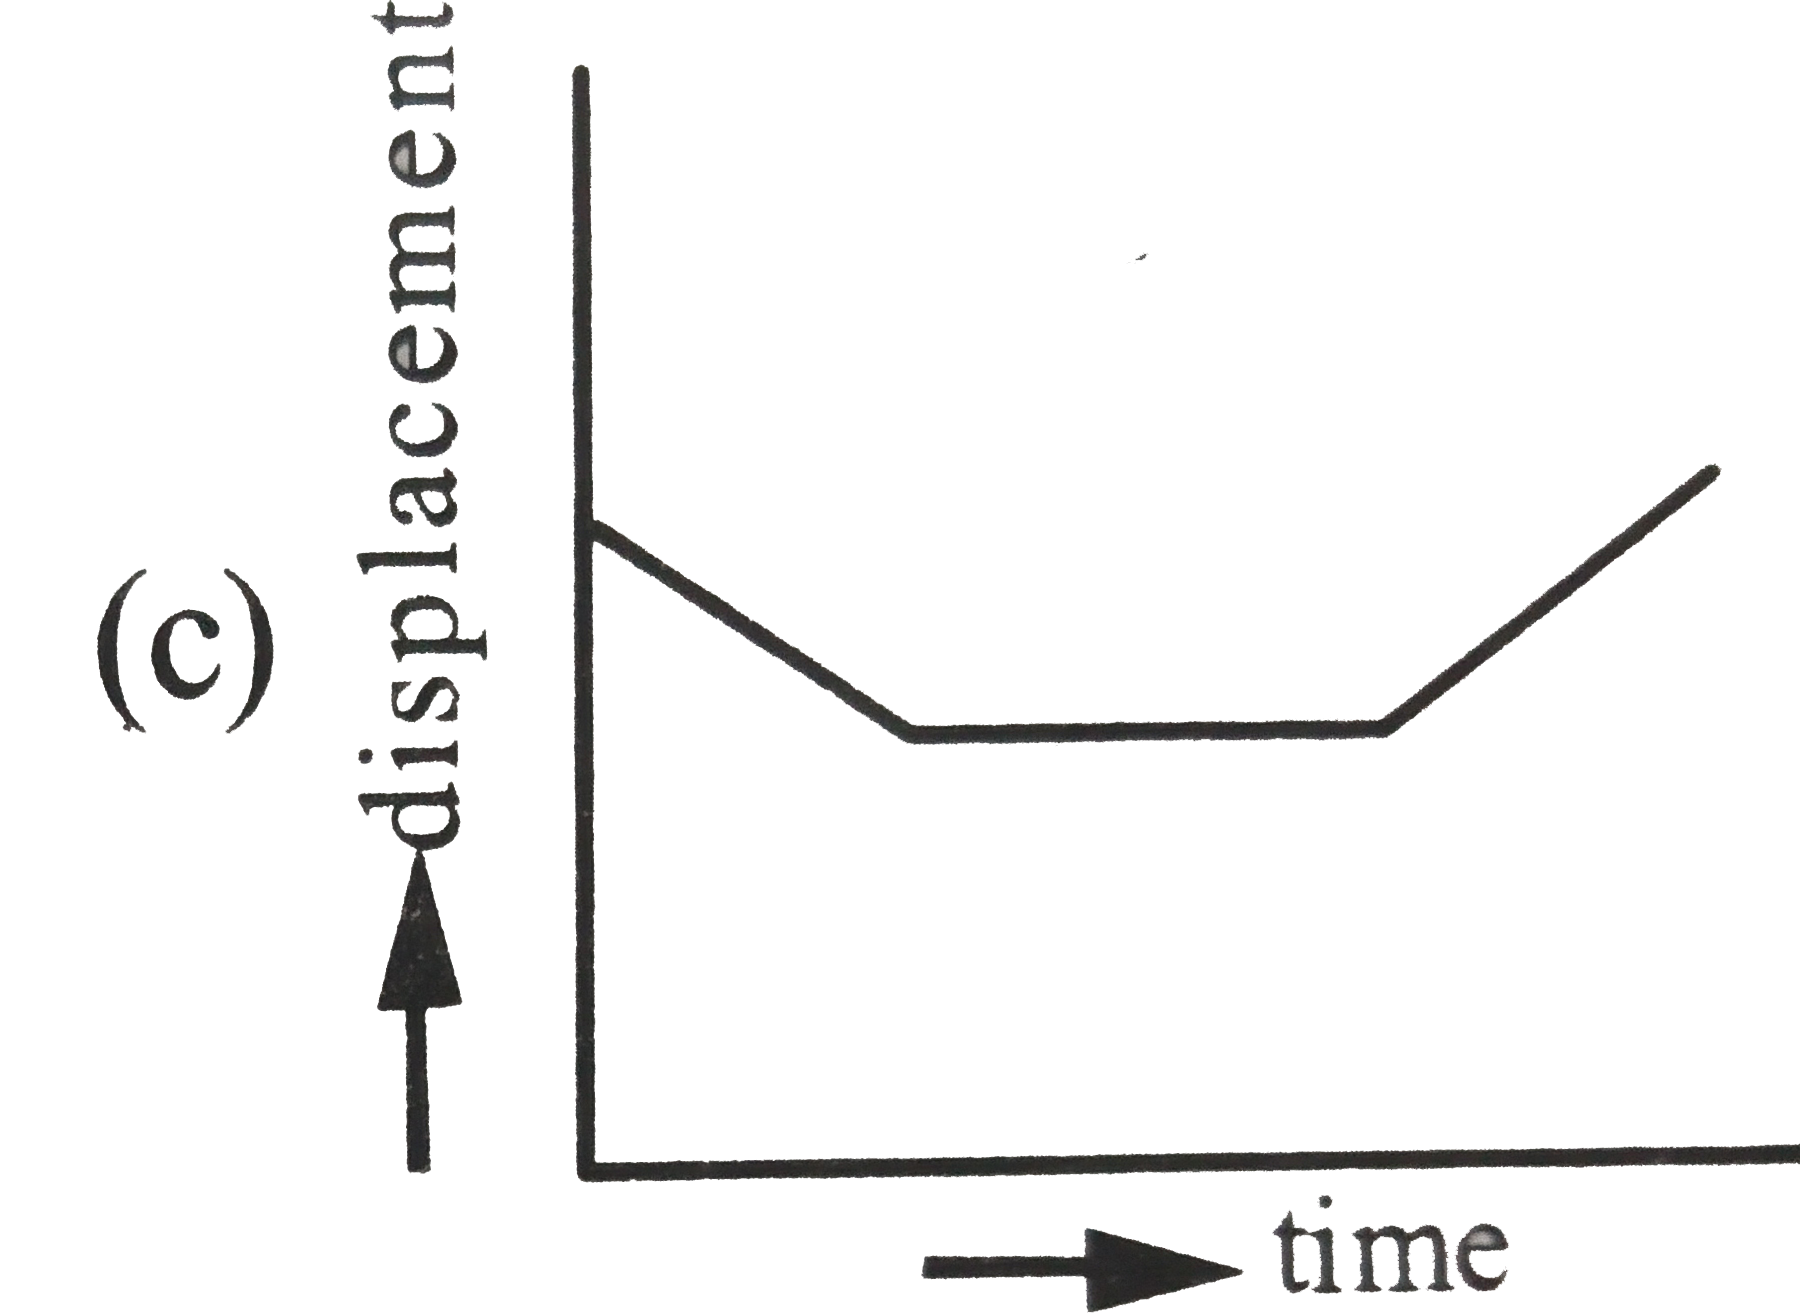 D
D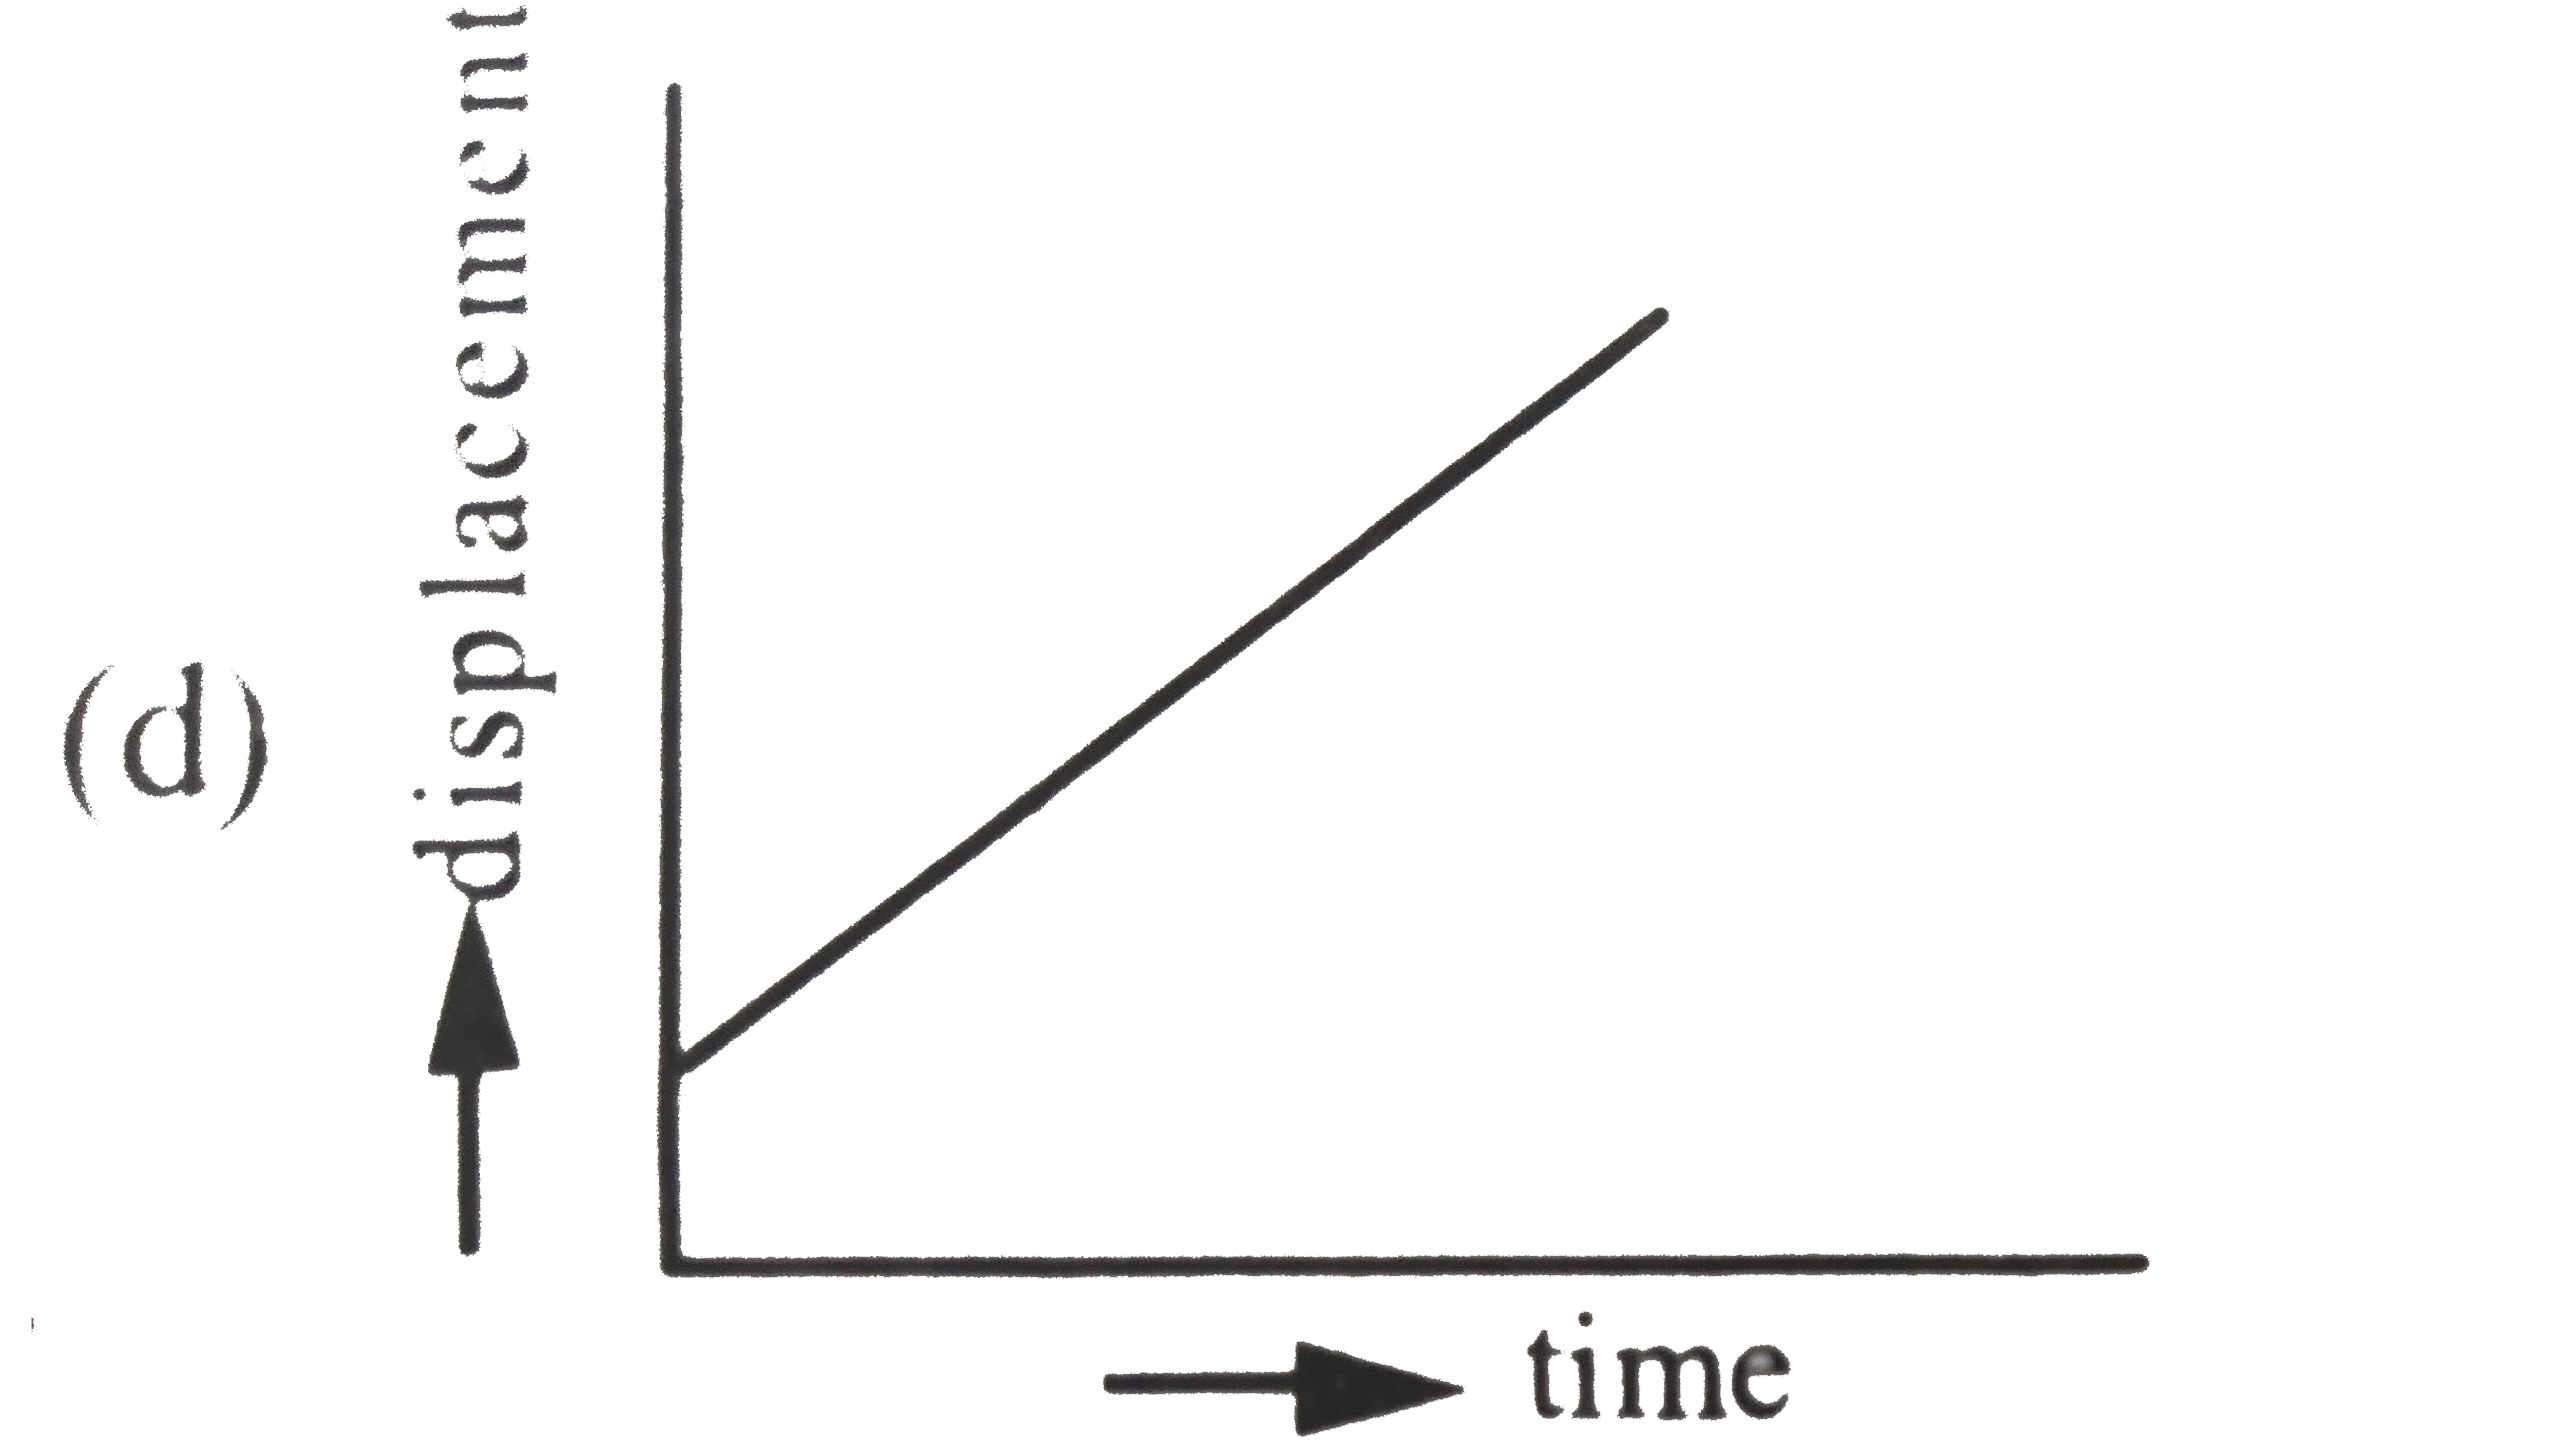
- Question 2 - Select One
Which one of the following correctly represents the variation between linear momentum (P) and kinetic energy (E) ofa body?
A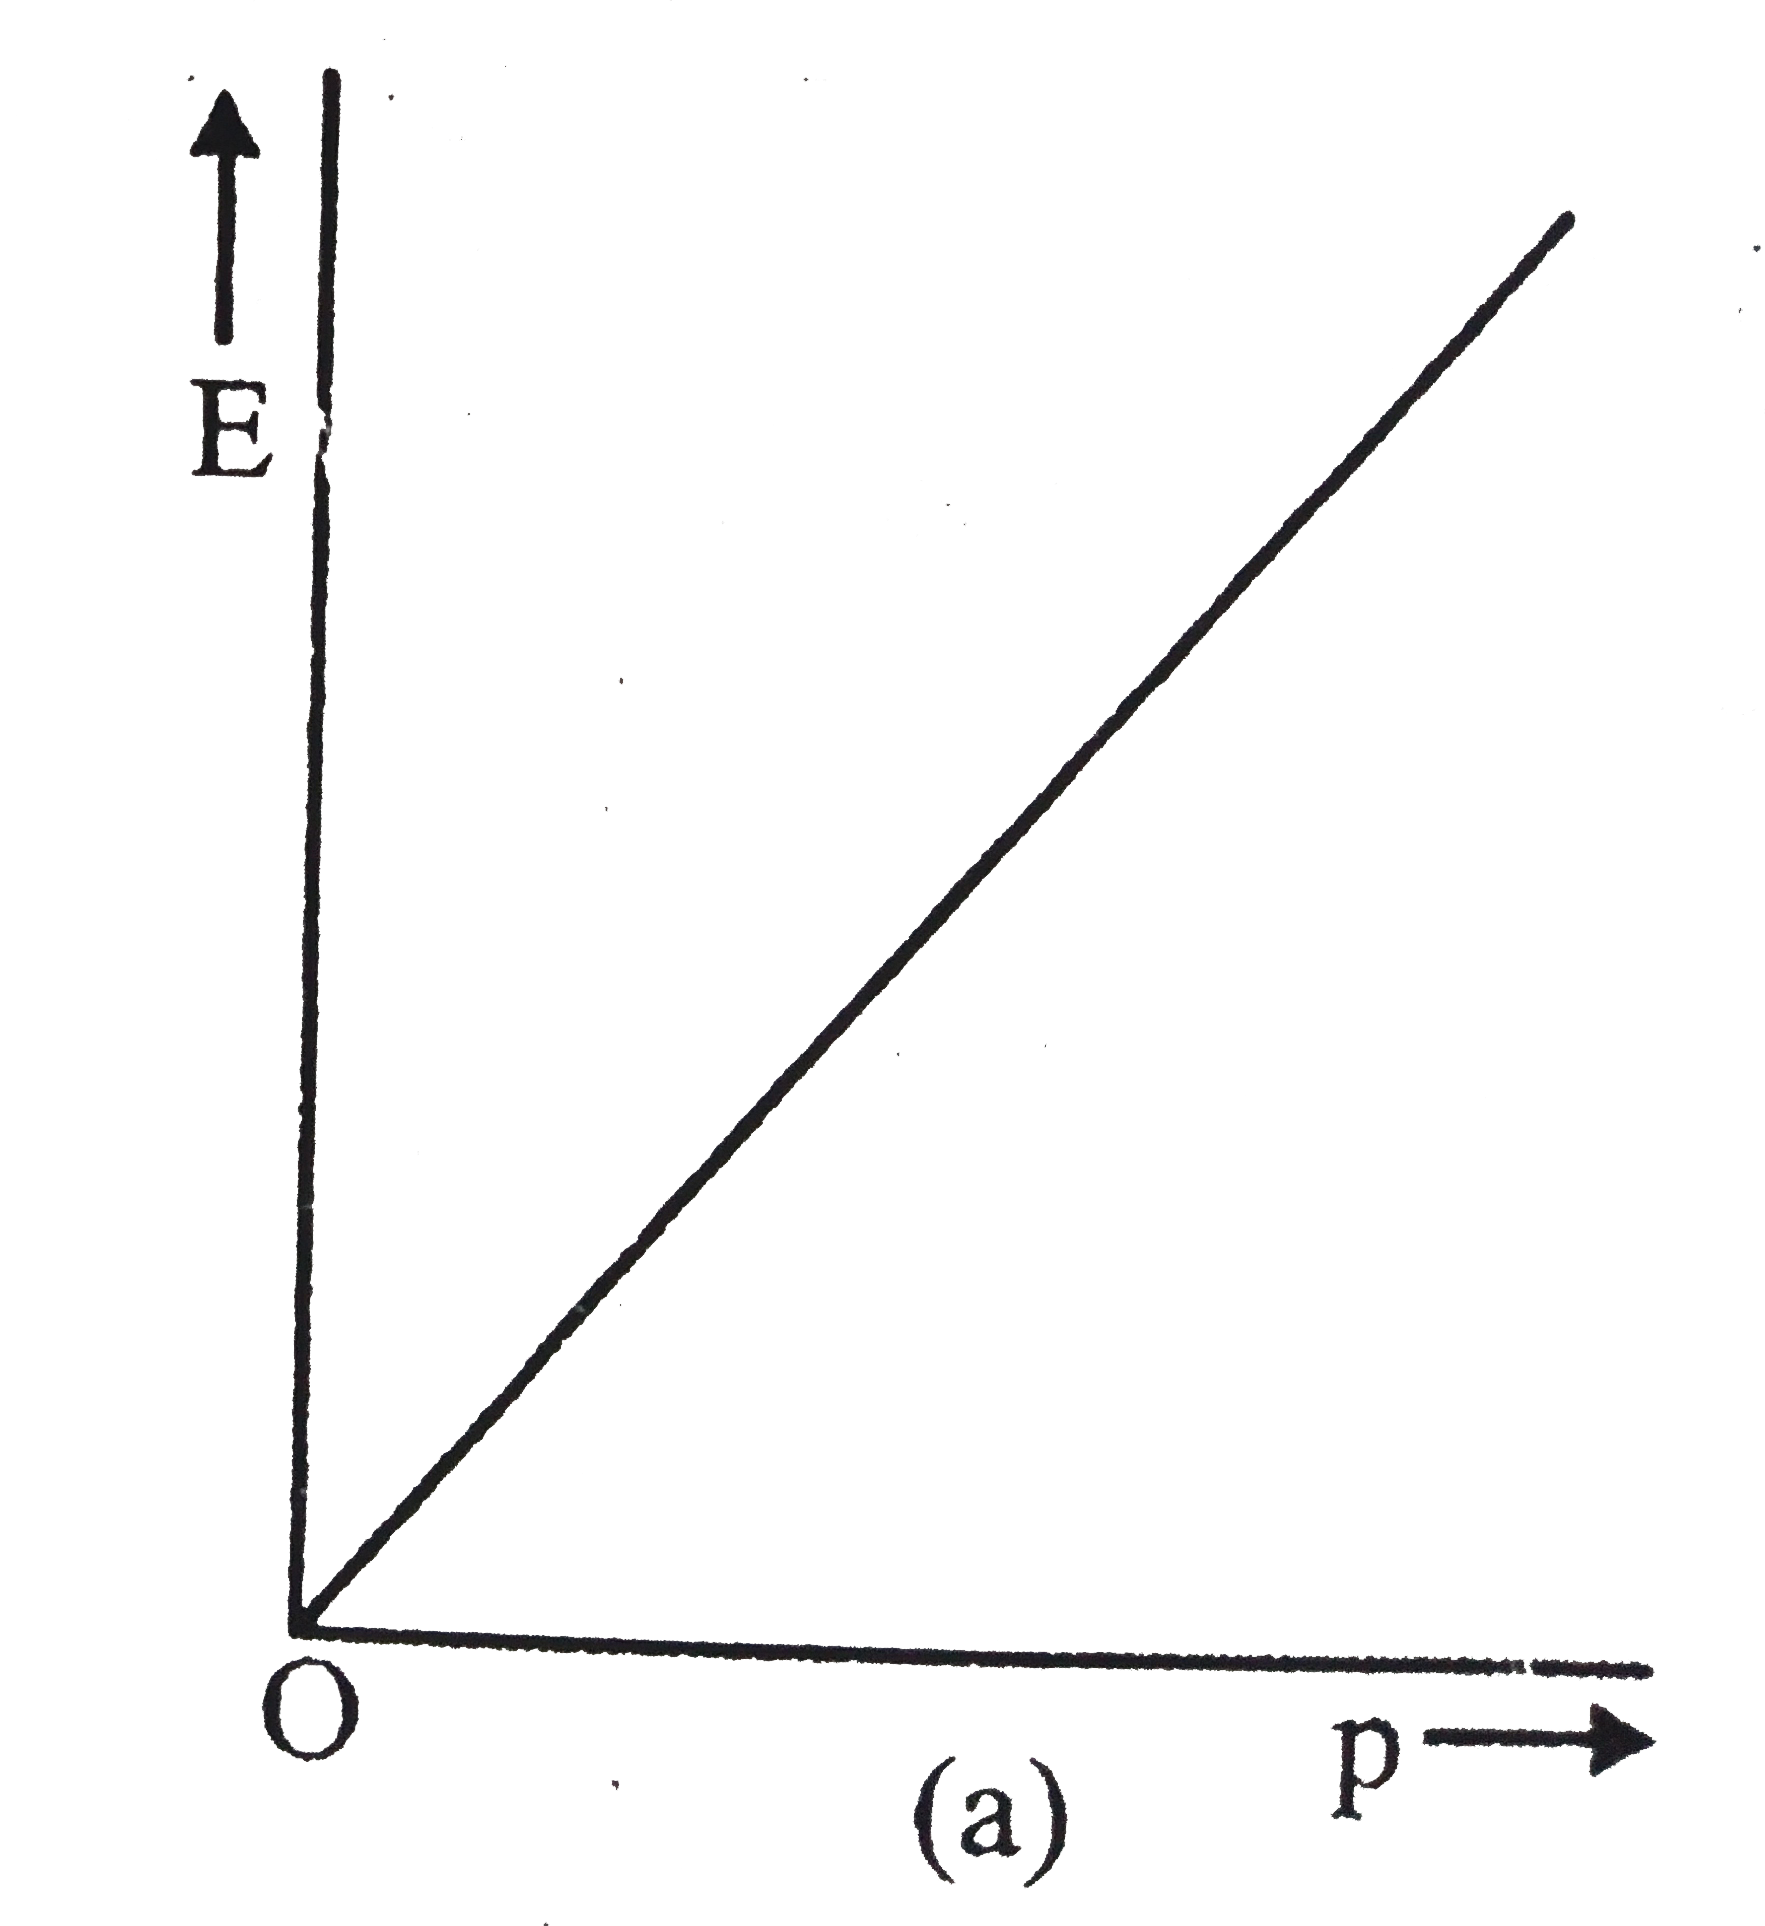 B
B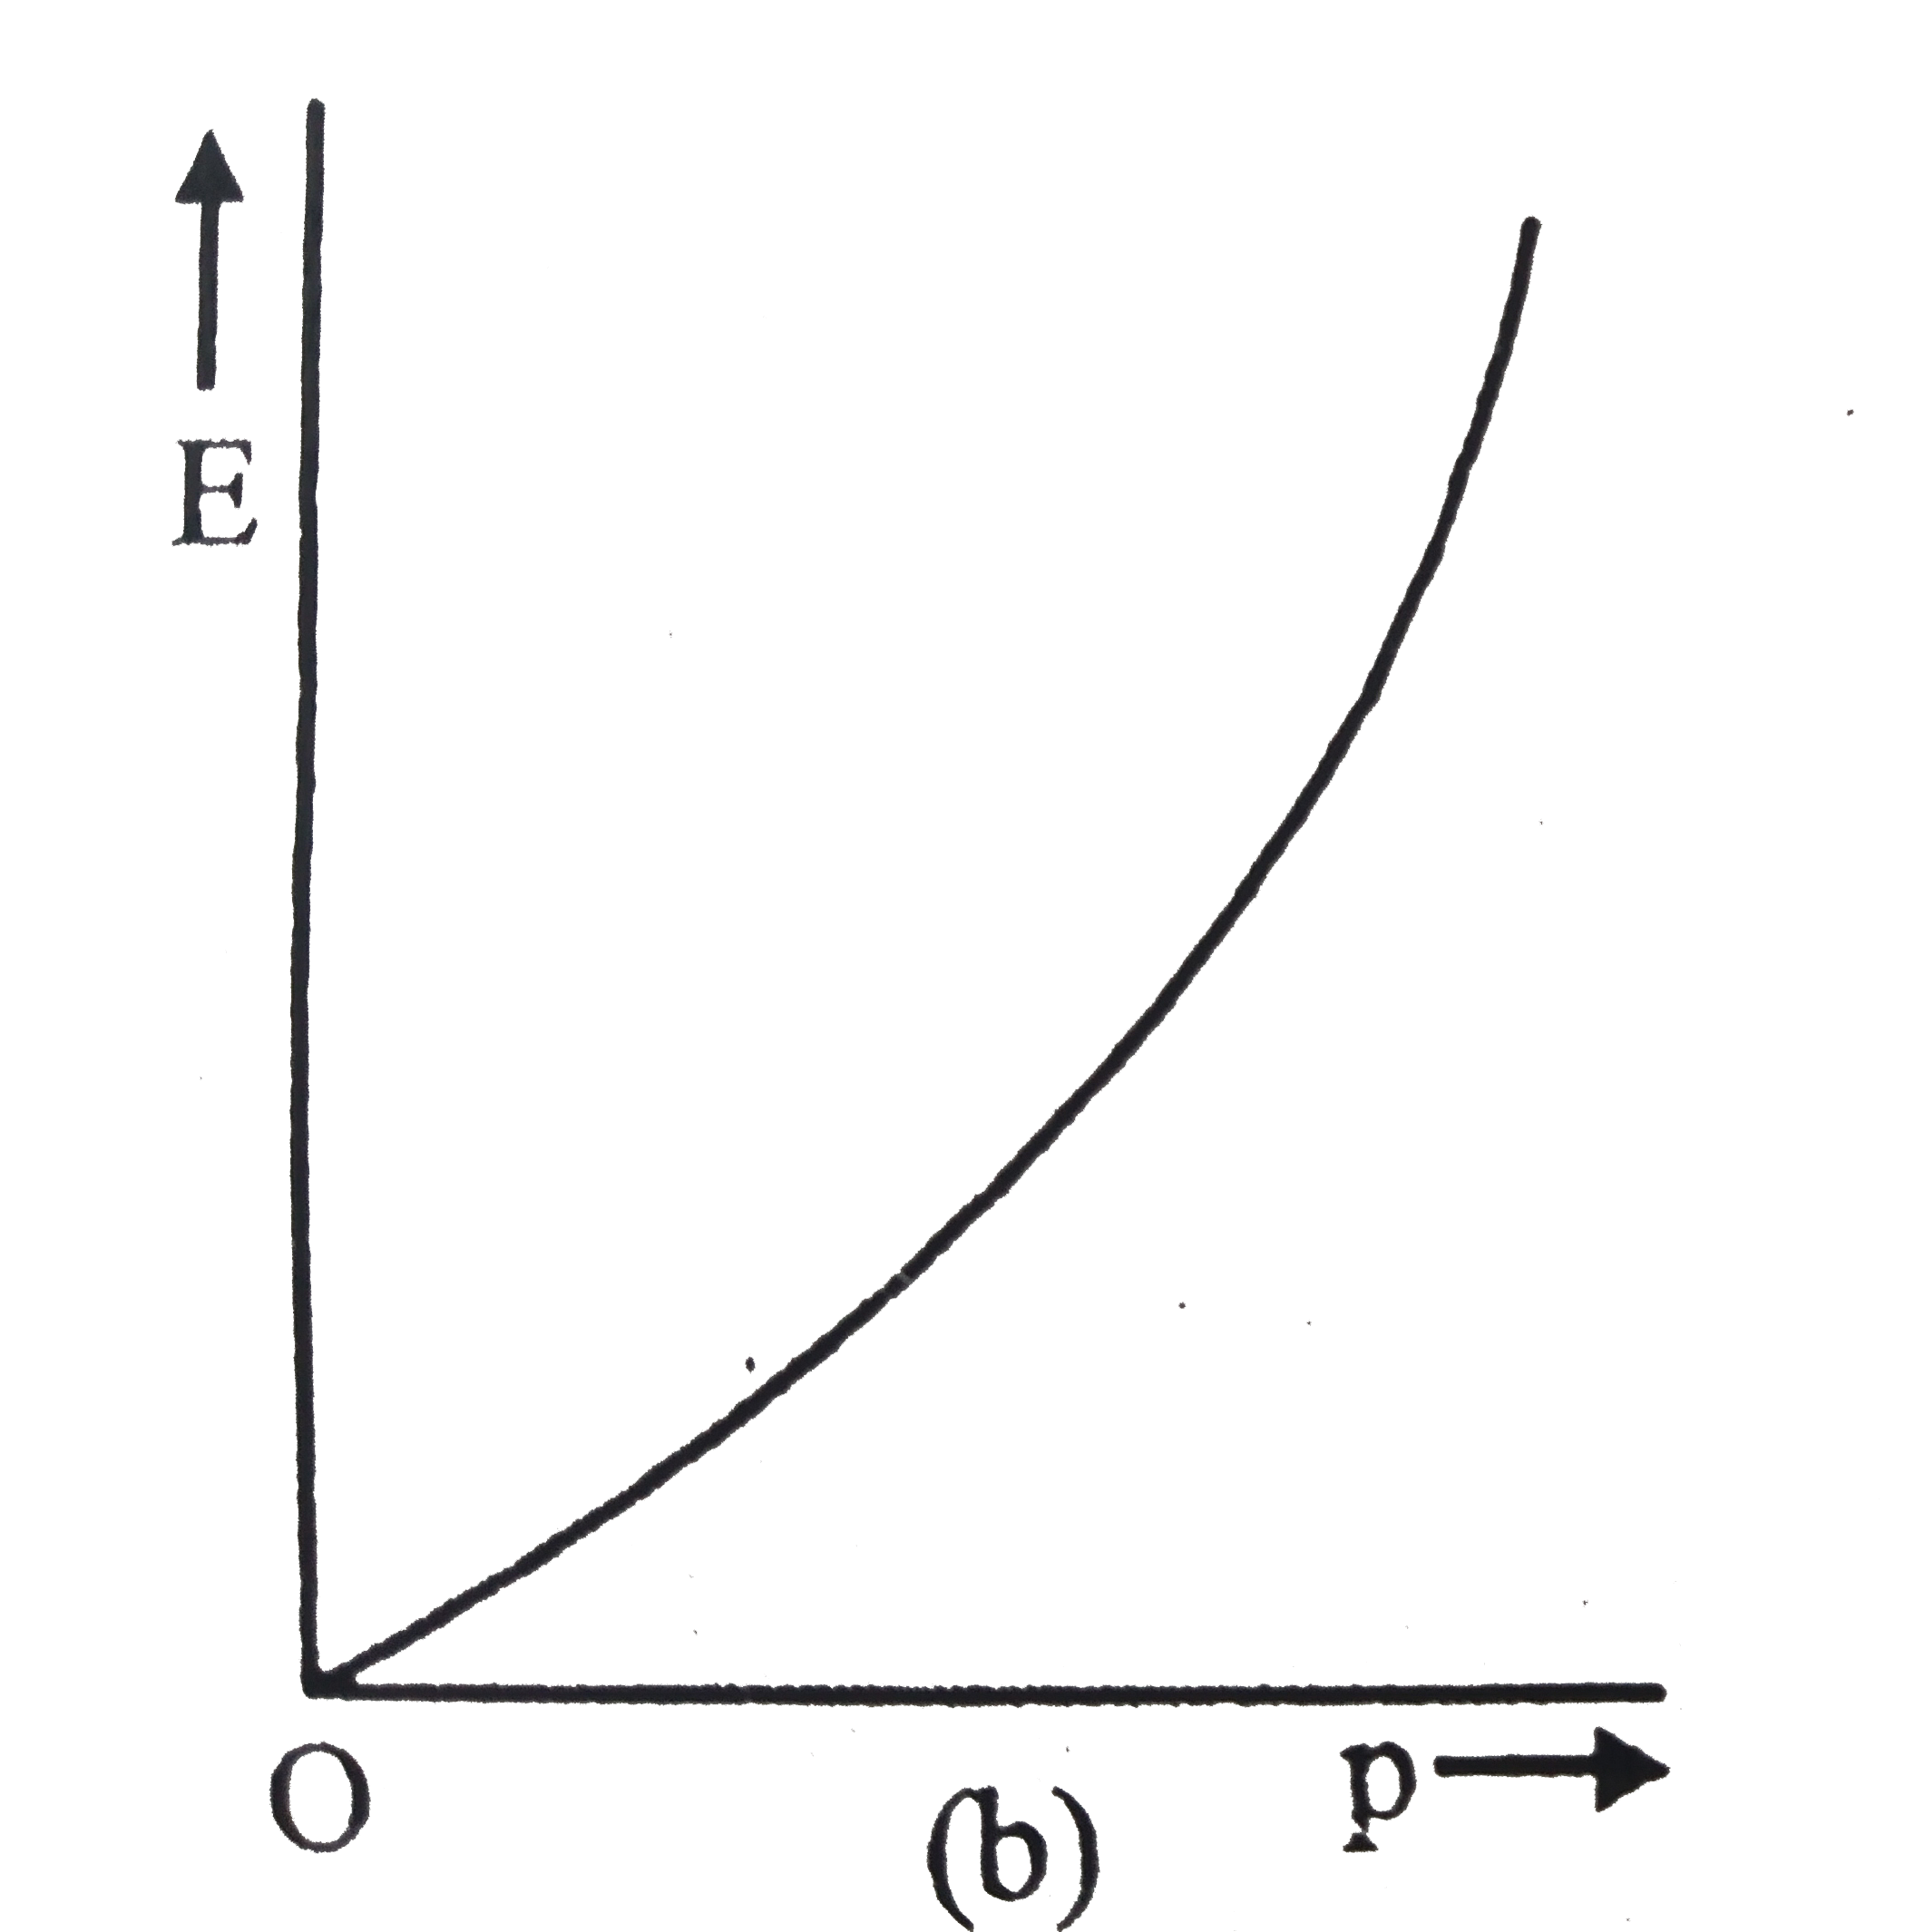 C
C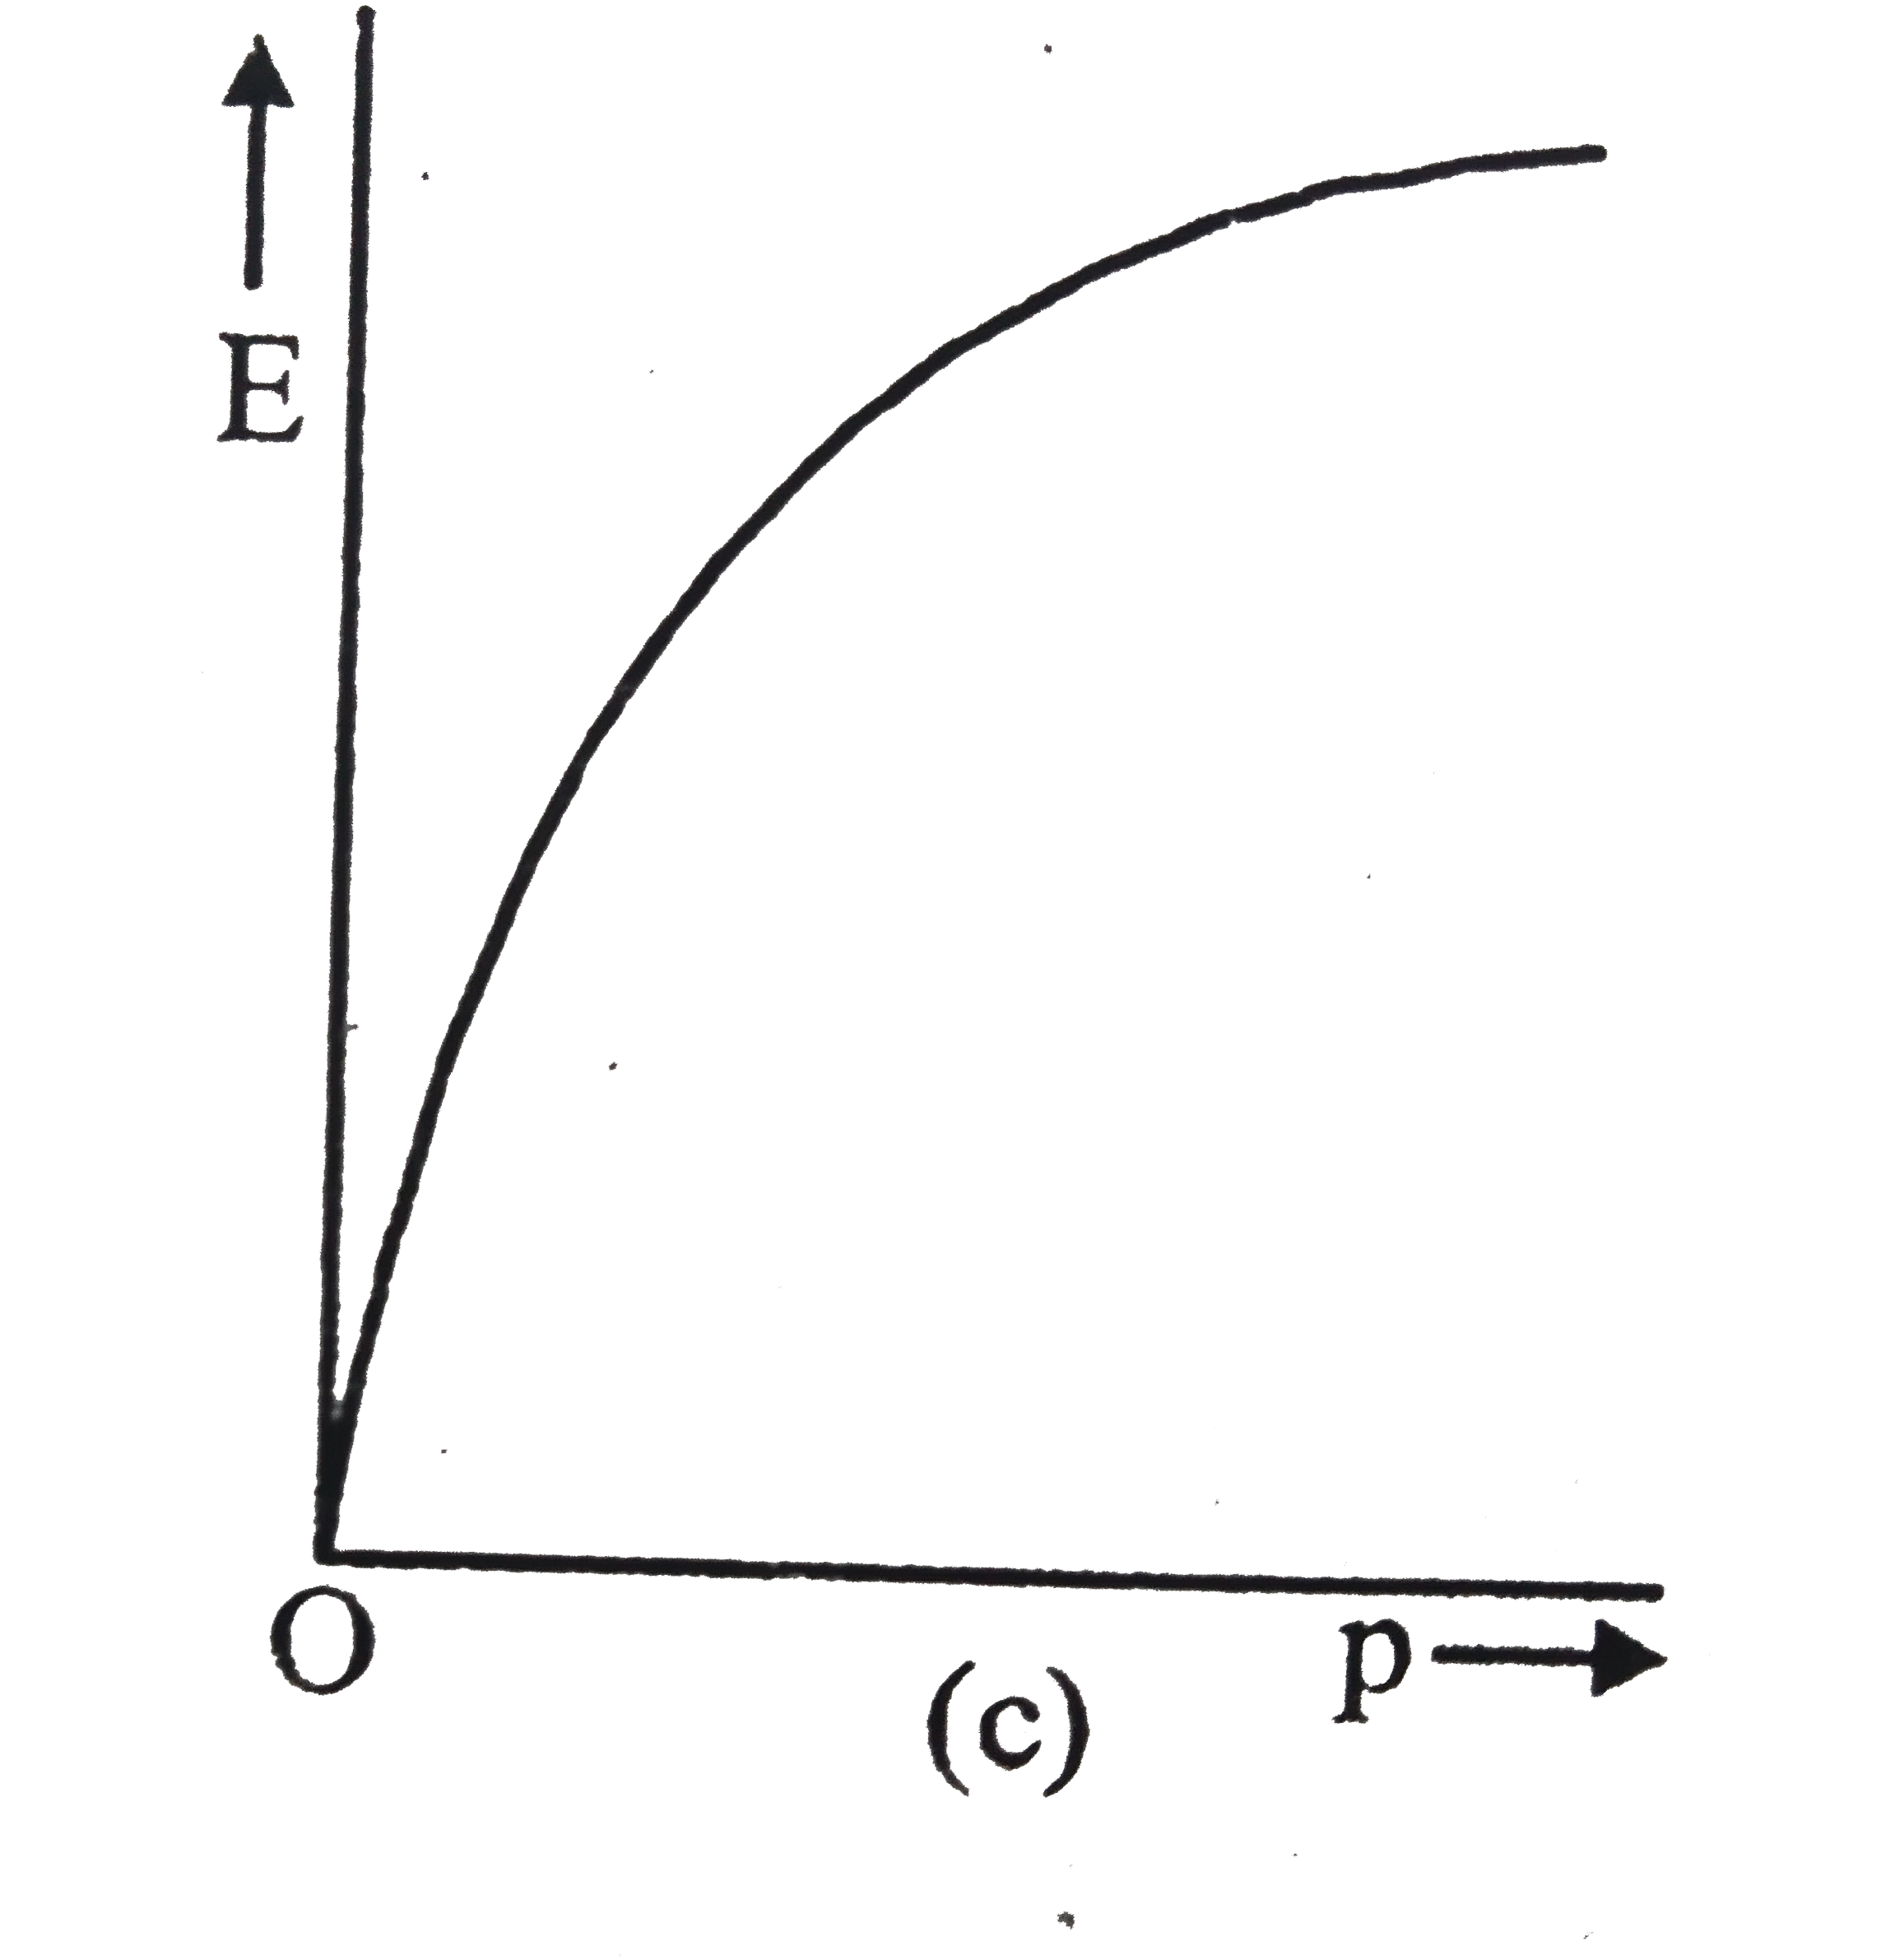 D
D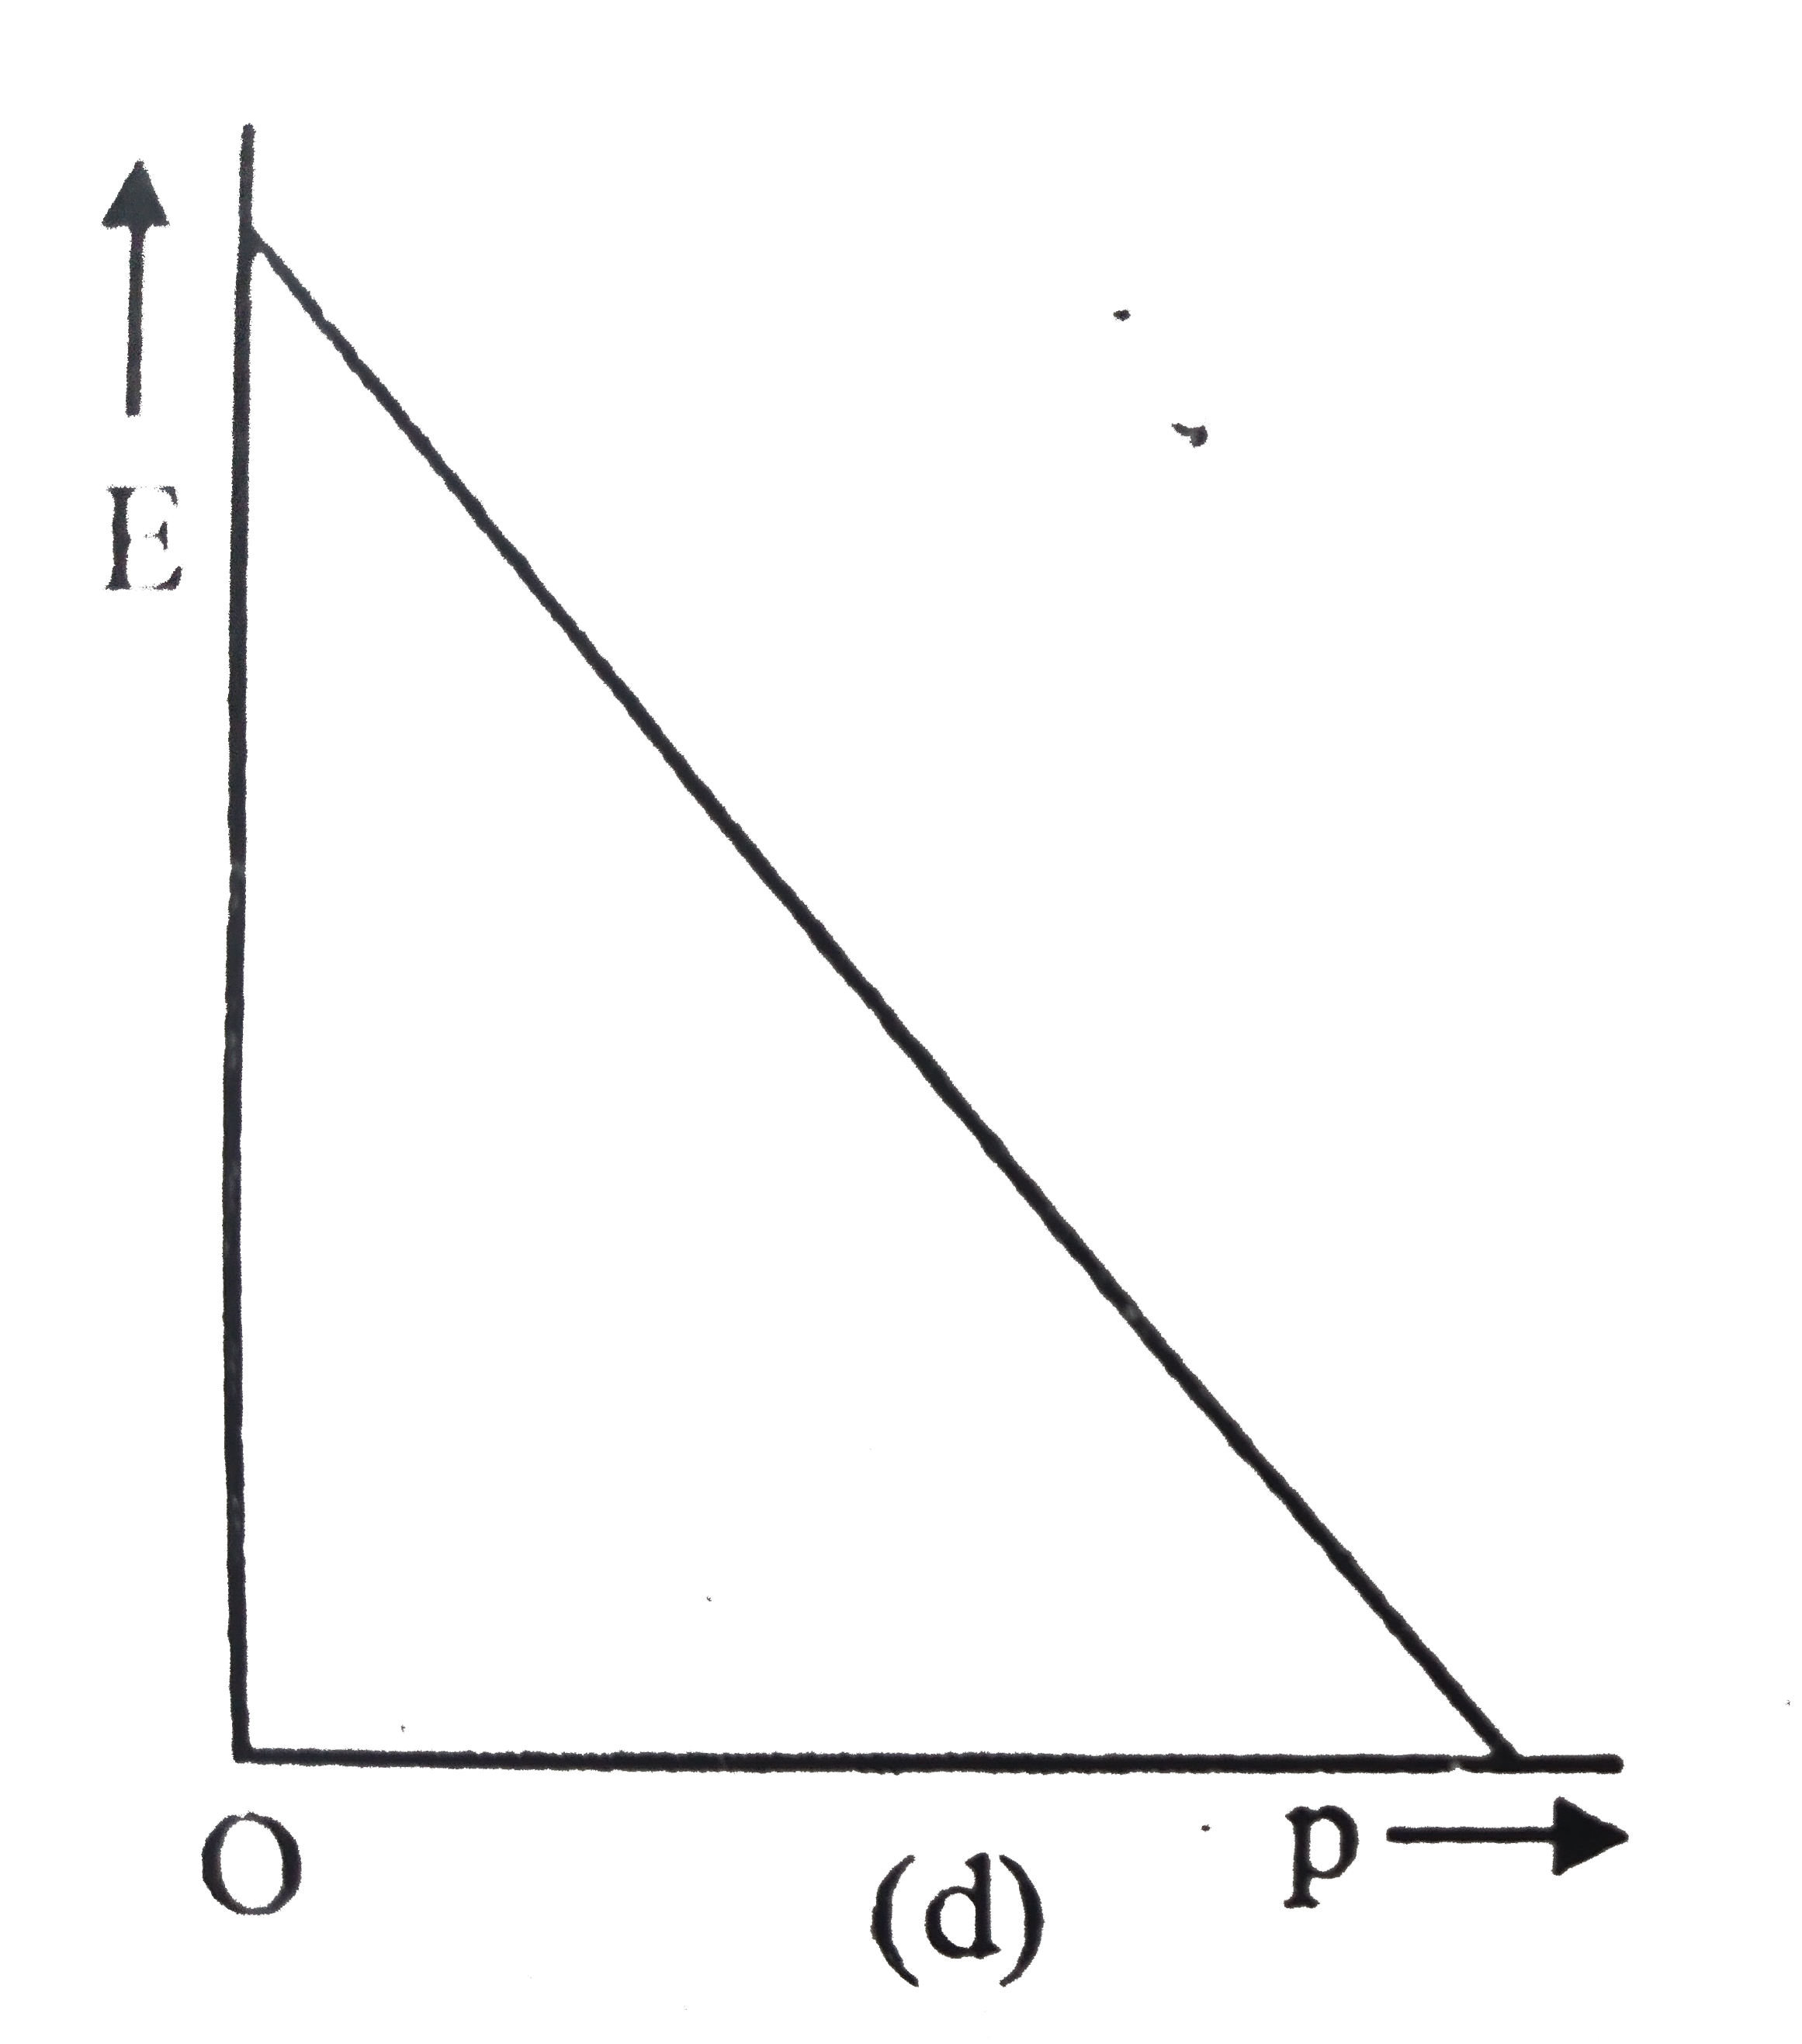
- Question 3 - Select One
Which of the following graph represents uniform motion
A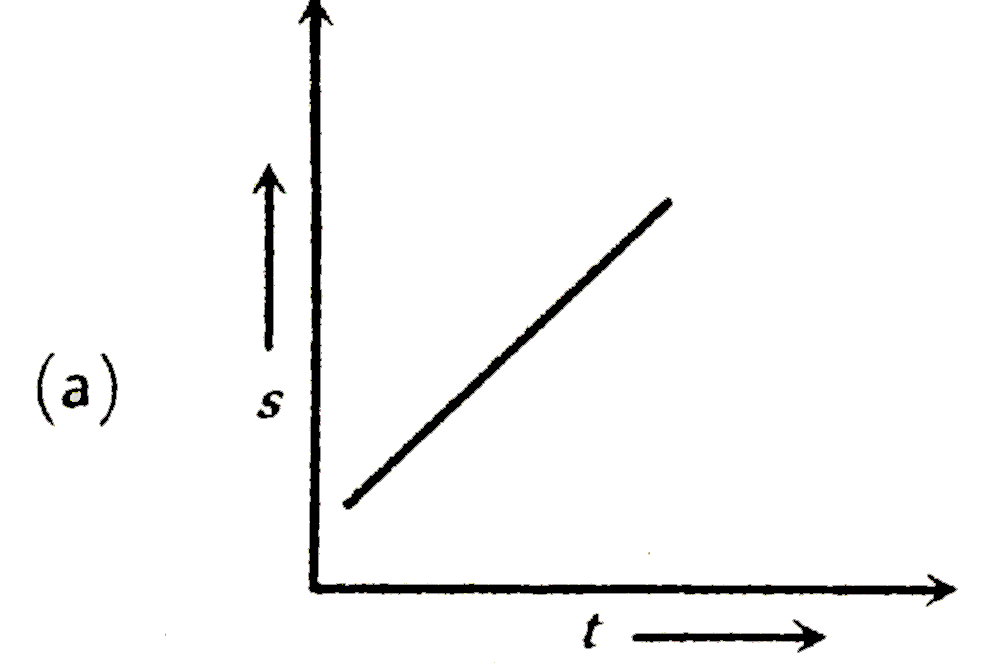 B
B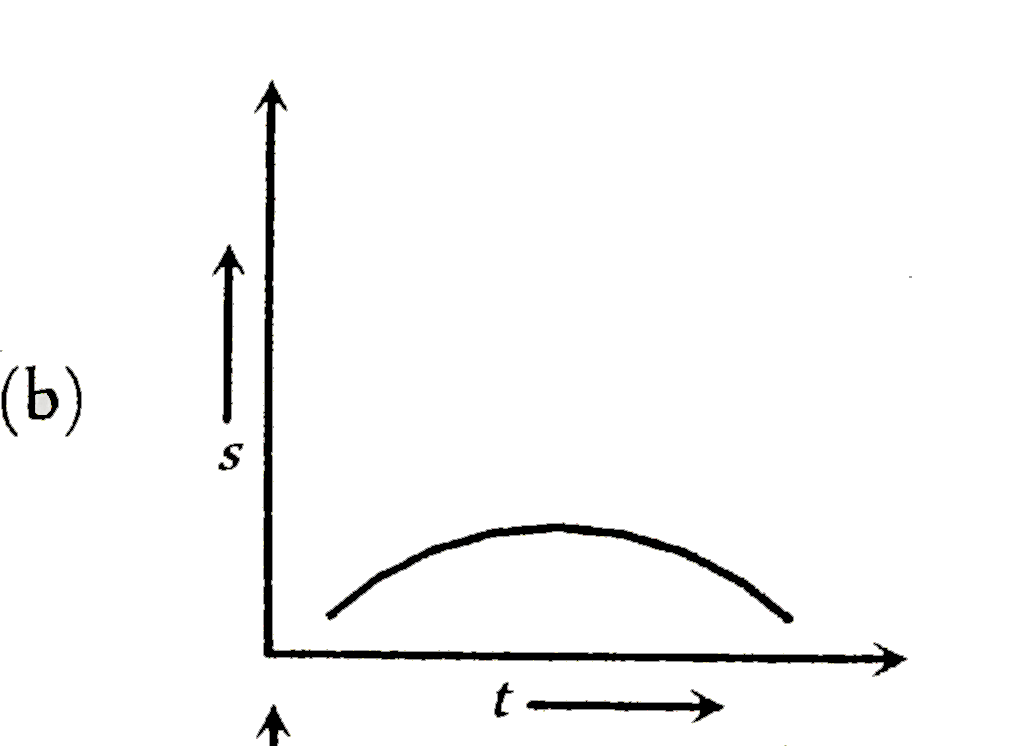 C
C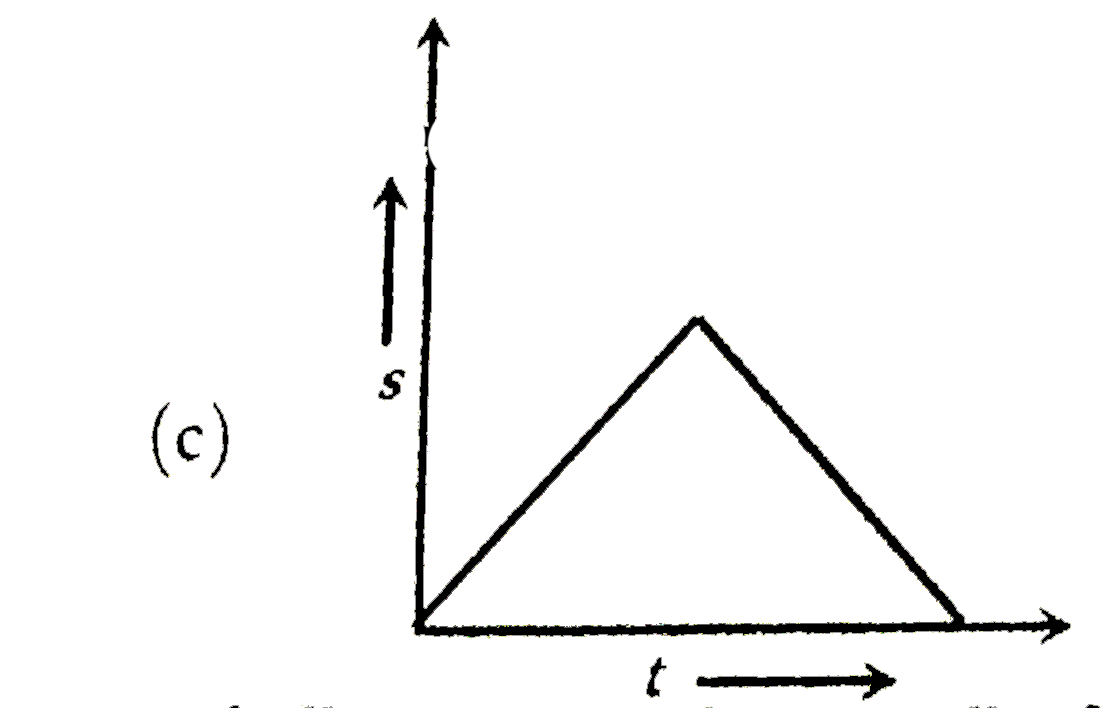 D
D
Which of the following graphs represent a uniformaly accelerated motion ?
View SolutionWhich of following graphs represent accelerated motion ?
View SolutionWhich of the following graphs best represents the motion of a raindrop?
View SolutionRelationship between angular momentum L and kinetic energy E of a rigid body in pure rotation is
View SolutionA body moves from rest with a constant ac- celeration. Which of the following graphs represents the variation of its kinetic energy (E) with distance travelled (x)?
View Solution

