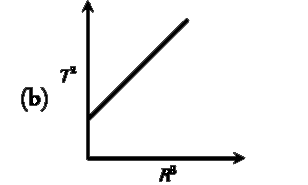
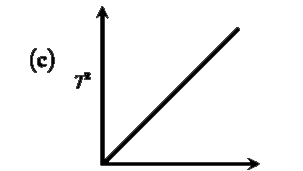
Which of the following graphs represents the motion of the planet moving about the Sun. T is the periode of revolution and r is the average distance (from centre to centre) between the sun and the planet


The correct Answer is:C
Step by step video, text & image solution for Which of the following graphs represents the motion of the planet moving about the Sun. T is the periode of revolution and r is the average distance (from centre to centre) between the sun and the planet by Physics experts to help you in doubts & scoring excellent marks in Class 11 exams.
Topper's Solved these Questions
- BOOK - ERRORLESS CHAPTER - GRAVITATIONEXERCISE - Assertion and Reasons33videos
GRAVITATION
- BOOK - ERRORLESS CHAPTER - GRAVITATIONEXERCISE - SET27videos
GRAVITATION
- BOOK - ERRORLESS CHAPTER - GRAVITATIONEXERCISE - CT18videos
GRAVITATION
- BOOK - ERRORLESS CHAPTER - FRICTIONEXERCISE - MCQ S125videos
FRICTION
- BOOK - ERRORLESS CHAPTER - MOTION IN ONE DIMENSIONEXERCISE - Motion In One Dimension24videos
MOTION IN ONE DIMENSION
Similar Questions
Knowledge Check
- Question 1 - Select One
Which of the following is not a planet of the Sun ?
ASiriusBMercuryCSaturnDEarth - Question 2 - Select One
Which of the following planet is farthest from Sun?
ASaturnBJupiterCNeptuneDUranus - Question 3 - Select One
Which of the following is the farthest planet to the Sun?
AMarsBJupiterCVenusDEarth
Which of the following is not a planet of the Sun ?
View SolutionWhich of the following is NOT a planet of the sun?
View SolutionThe torque on a planet about the centre of sun is
View SolutionWhich of the following graphs between the square of the time period and cube of the distance of the planet from the sun is correct ?
View SolutionIf r denotes the mean distance of a planet from the sun and T is the time period of planet, then
View Solution

