By which curve will the variation of gravitational potential of a hollow sphere of radius R with distance be depicted ?
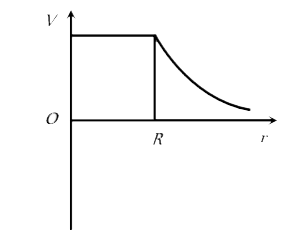
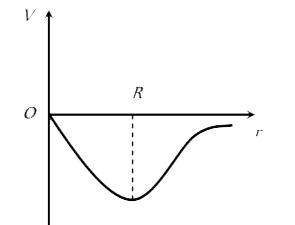
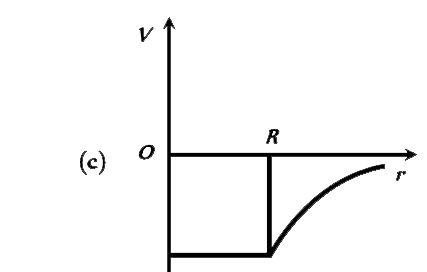
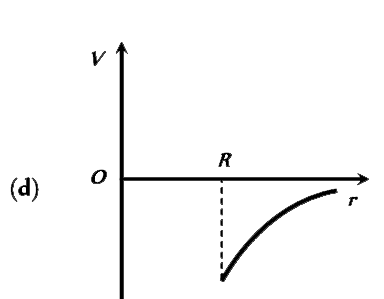
The correct Answer is:C
To determine the variation of gravitational potential V of a hollow sphere with distance r from its center, we can analyze the gravitational potential in different regions relative to the hollow sphere.
1. Understanding the Hollow Sphere:
- A hollow sphere of radius R has mass distributed uniformly over its surface. The gravitational potential is influenced by this mass distribution.
2. Regions to Consider:
- There are three distinct regions to consider when analyzing the gravitational potential:
- Inside the hollow sphere (r<R)
- On the surface of the hollow sphere (r=R)
- Outside the hollow sphere (r>R)
3. Gravitational Potential Inside the Hollow Sphere:
- For a hollow sphere, the gravitational potential V inside the sphere (for r<R) is constant and equal to the potential at the surface. This is because, according to the shell theorem, a uniform spherical shell exerts no gravitational force on a mass located inside it.
- The potential at the surface is given by:
V(R)=−GMR
- Therefore, for r<R:
V(r)=−GMR
4. Gravitational Potential on the Surface:
- At the surface of the hollow sphere, the potential is:
V(R)=−GMR
5. Gravitational Potential Outside the Hollow Sphere:
- For r>R, the gravitational potential behaves as if all the mass M of the hollow sphere is concentrated at its center. The potential at a distance r is given by:
V(r)=−GMr
6. Graphical Representation:
- The graph of gravitational potential V versus distance r will show:
- A horizontal line at V=−GMR for r<R (constant potential inside the hollow sphere).
- A point at V=−GMR at r=R.
- A curve that decreases as −GMr for r>R, approaching zero as r increases.
Conclusion:
The variation of gravitational potential of a hollow sphere with distance can be depicted as a graph that has a constant value for r<R, a value at r=R, and a decreasing curve for r>R.
- A hollow sphere of radius R has mass distributed uniformly over its surface. The gravitational potential is influenced by this mass distribution.
- There are three distinct regions to consider when analyzing the gravitational potential:
- Inside the hollow sphere (r<R)
- On the surface of the hollow sphere (r=R)
- Outside the hollow sphere (r>R)
- For a hollow sphere, the gravitational potential V inside the sphere (for r<R) is constant and equal to the potential at the surface. This is because, according to the shell theorem, a uniform spherical shell exerts no gravitational force on a mass located inside it.
- The potential at the surface is given by:
V(R)=−GMR
- Therefore, for r<R:
V(r)=−GMR
- At the surface of the hollow sphere, the potential is:
V(R)=−GMR
- For r>R, the gravitational potential behaves as if all the mass M of the hollow sphere is concentrated at its center. The potential at a distance r is given by:
V(r)=−GMr
- The graph of gravitational potential V versus distance r will show:
- A horizontal line at V=−GMR for r<R (constant potential inside the hollow sphere).
- A point at V=−GMR at r=R.
- A curve that decreases as −GMr for r>R, approaching zero as r increases.
The variation of gravitational potential of a hollow sphere with distance can be depicted as a graph that has a constant value for r<R, a value at r=R, and a decreasing curve for r>R.
Topper's Solved these Questions
- GRAVITATIONBook:ERRORLESS Chapter:GRAVITATIONExercise:Assertion and Reasons
Explore 33 Videos
- GRAVITATIONBook:ERRORLESS Chapter:GRAVITATIONExercise:SET
Explore 27 Videos
- GRAVITATIONBook:ERRORLESS Chapter:GRAVITATIONExercise:CT
Explore 18 Videos
- FRICTIONBook:ERRORLESS Chapter:FRICTIONExercise:MCQ S
Explore 125 Videos
- MOTION IN ONE DIMENSIONBook:ERRORLESS Chapter:MOTION IN ONE DIMENSIONExercise:Motion In One Dimension
Explore 24 Videos
Similar Questions
Intensity Of Gravitational Field Due To Hollow Sphere
View SolutionThere is a uniform sphere of mass M and radius R. Find the strength G and the potential varϕ of the gravitational field of this sphere as a function of the distance r from its centre (with r<R and r>R). Draw the approximate plots of the functions G(r) and φ(r).
View Solution
Knowledge Check
By which curve will be variation of gravitational potential of a hollow sphere of radius R with distance be depicted ?
A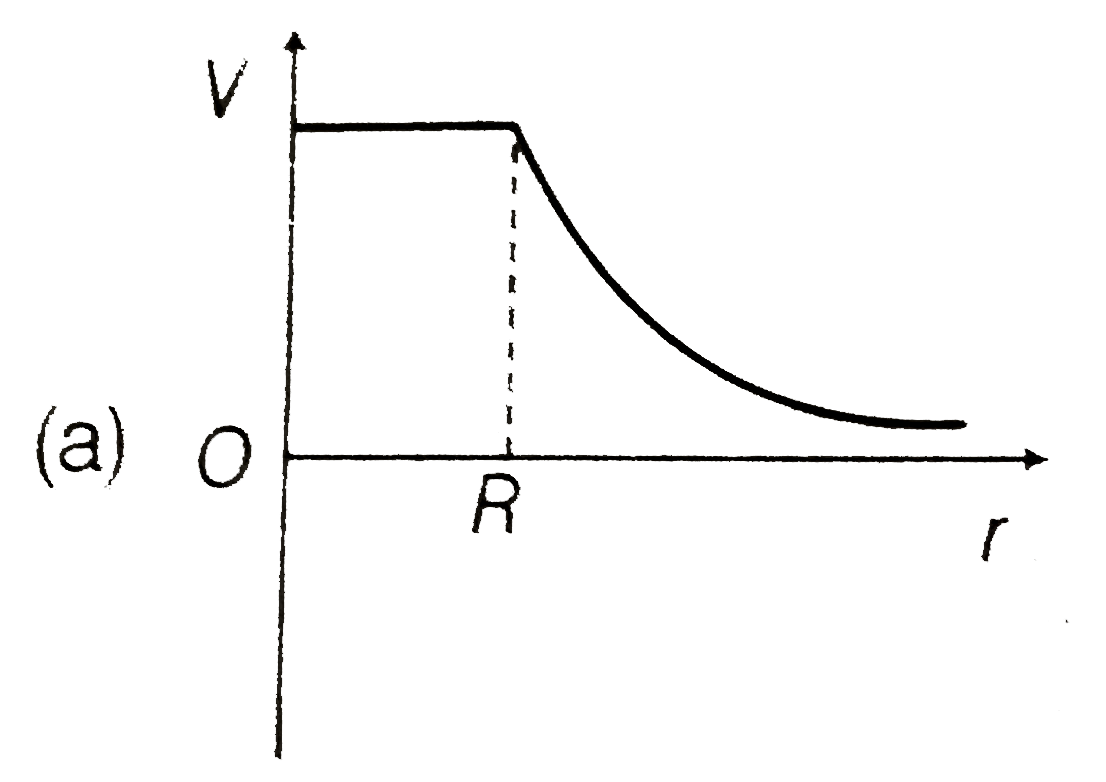 B
B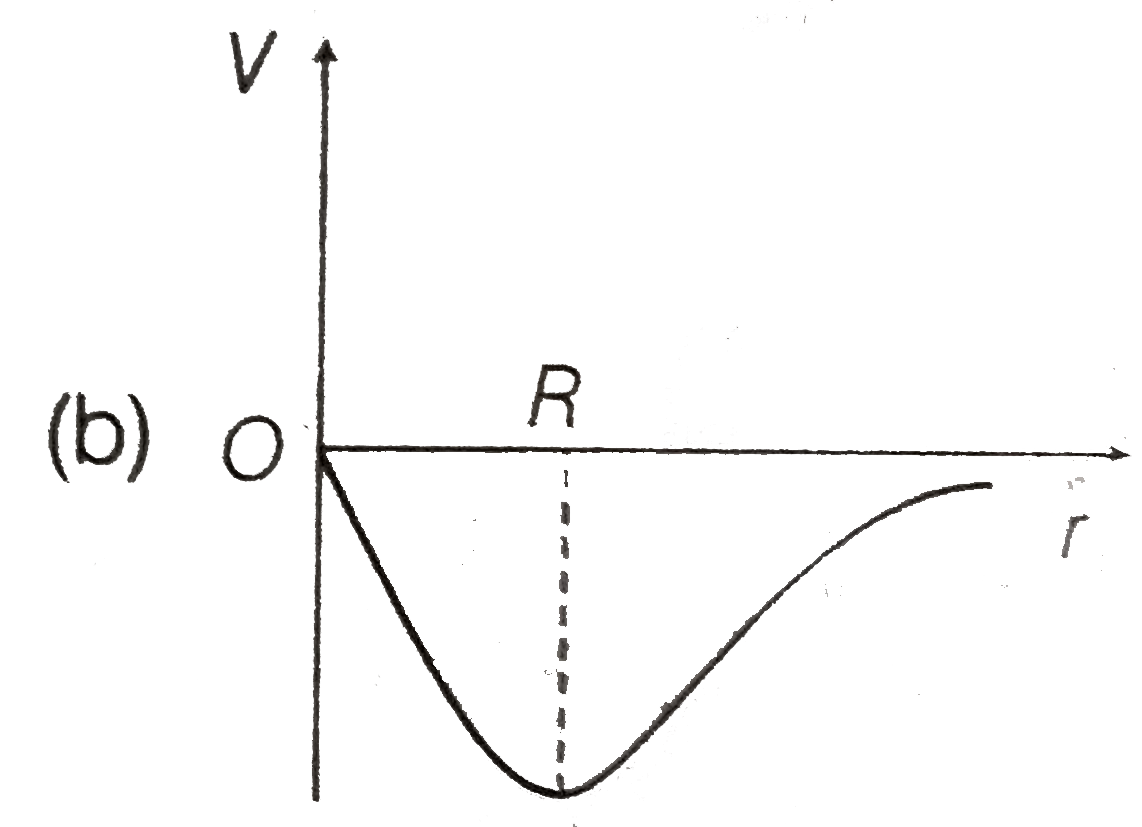 C
C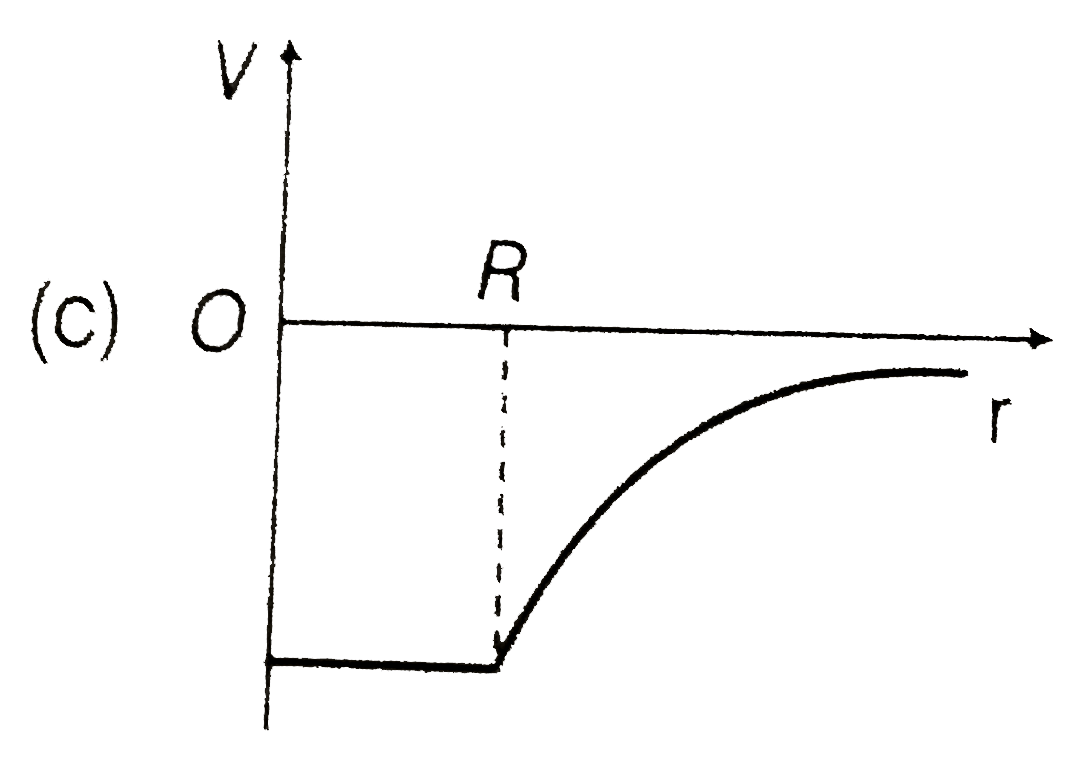 D
D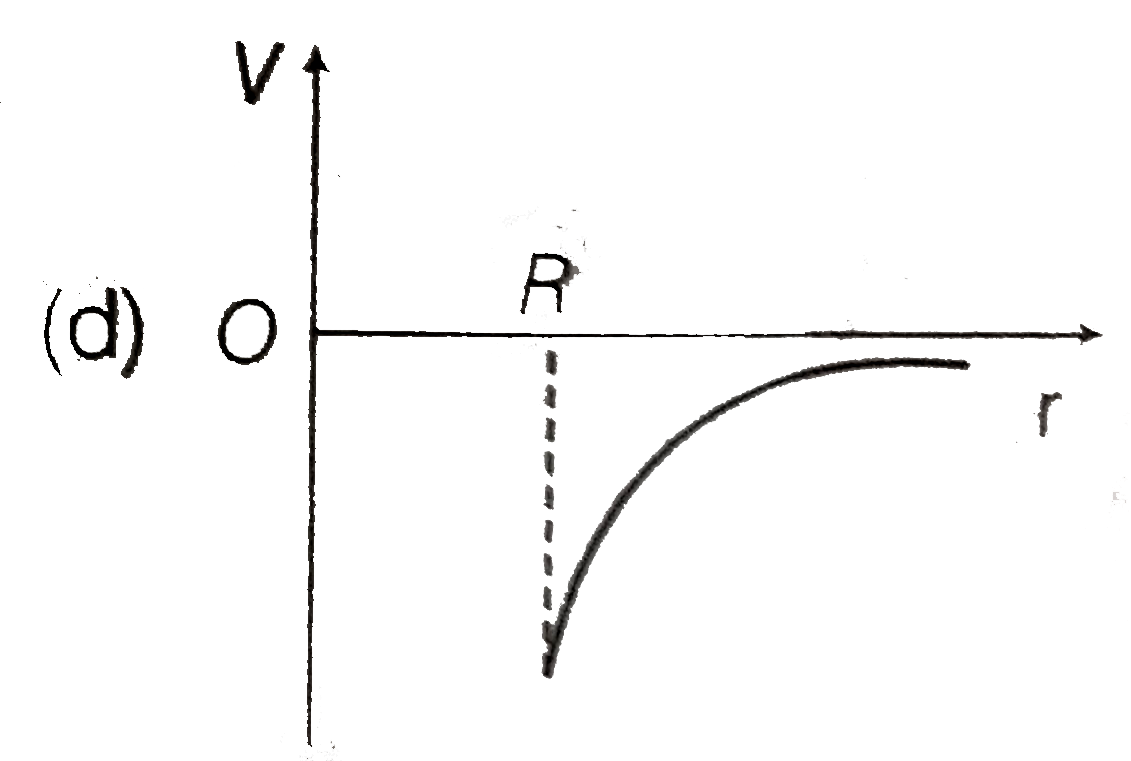
The diagram showing the variation of gravitational potential of earth with distance from the centre of earth is
A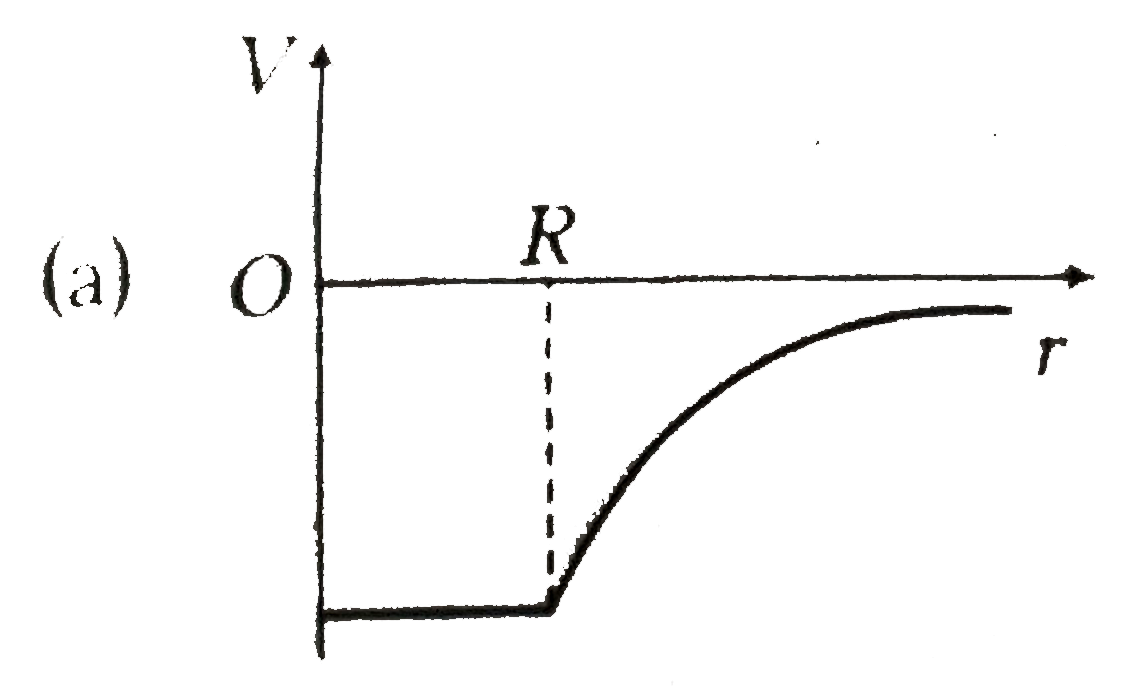 B
B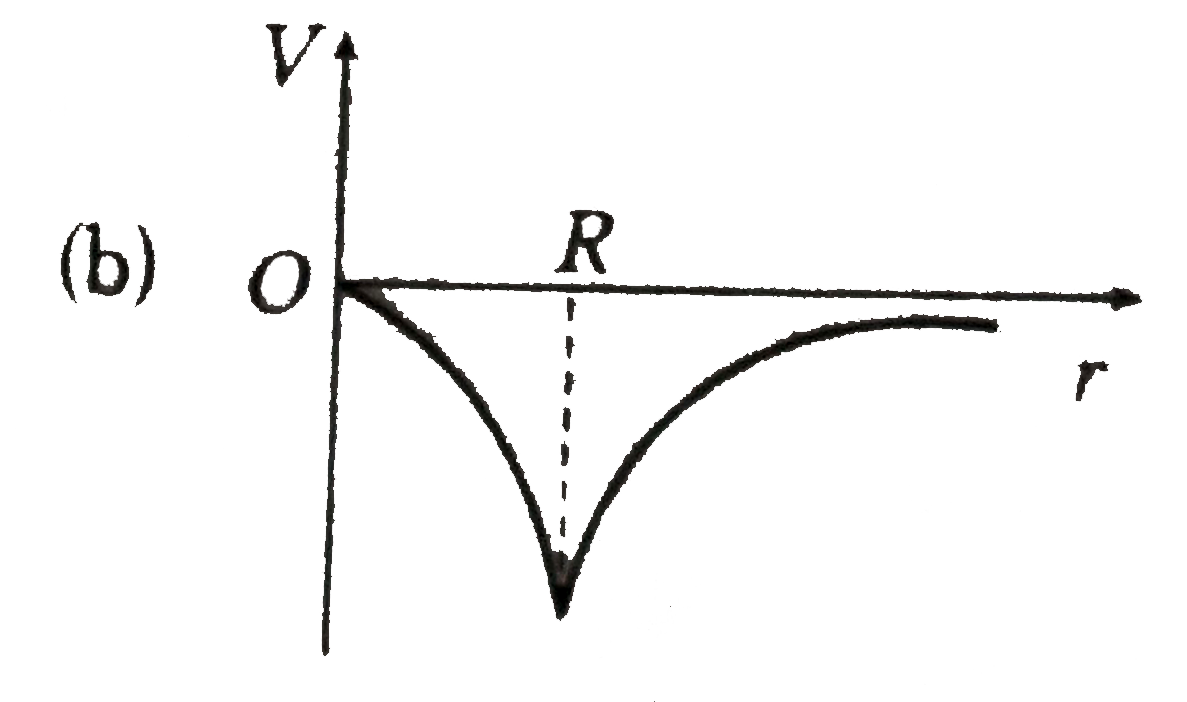 C
C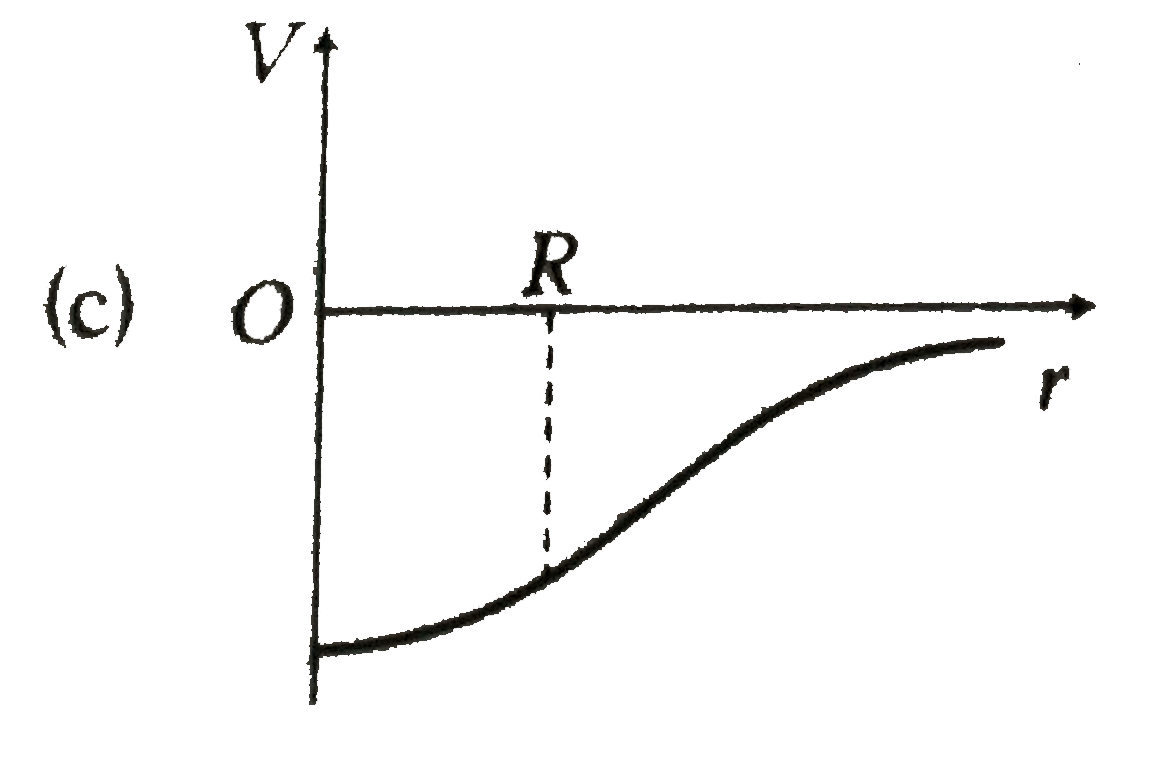 D
D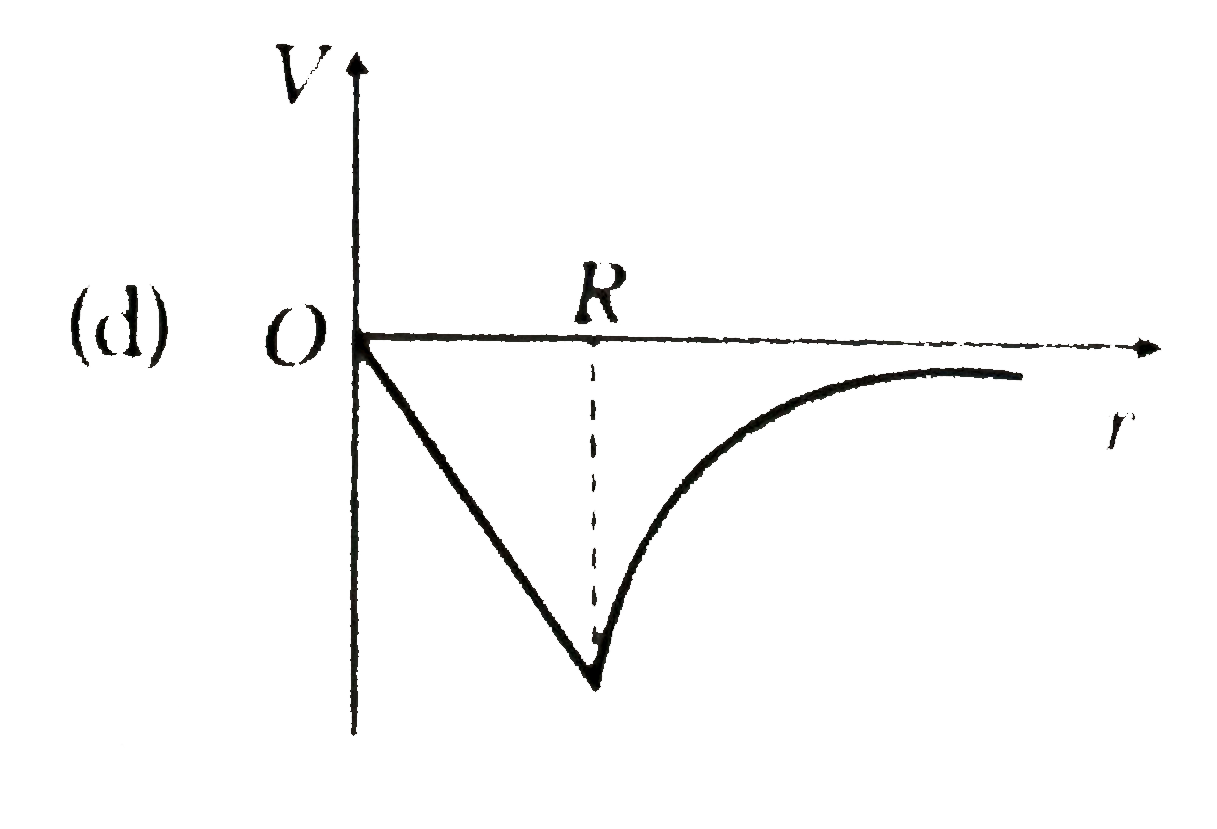
The diagram showing the variation of gravitational potential of earth with distance from the centre of earth is
A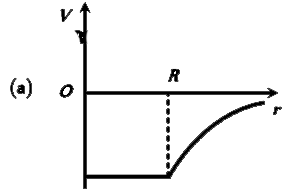 B
B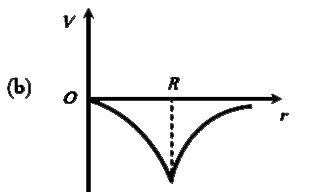 C
C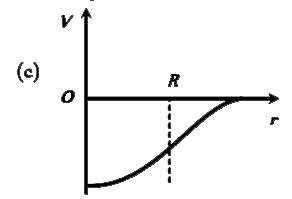 D
D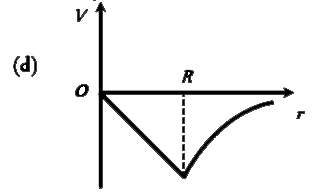
Gravitational force is a conservation and medium independent force. Its nature is attractive. Gravitational field intensity and gravitational potential gives information about gravitational fied in vector and scaler form respectively. Actually gravitational fied intensity is equal to the negative of the negative of teh potential gradient. potential energy is defined for only conservation force. it is also equal to the total energy in escaping condition. gravitational potential is either negative or zero but can never be positive due to attractive nature of gravitational force.
The gravitational potential inside a hollow sphere (mass M, radius R) at a distance r from the centre is:
View SolutionThe correct variation of gravitational potential V with radius r measured from the centre of earth of radius R is given by
View SolutionWhich one of t he following plots represents the variation of gravitational field of a particle with distance r due to thin spherical shell of radius R ?
View SolutionFollowing curve shows the variation of intesity of gravitational field (→I) with distance from the centre of solid sphere(r) :
View SolutionThe potential at a distance R/2 from the centre of a conducting sphere of radius R will be
View Solution