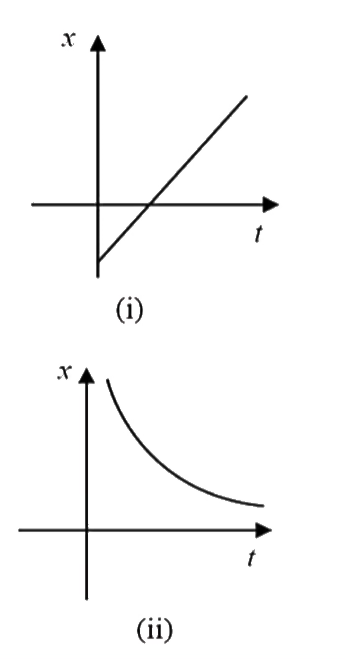
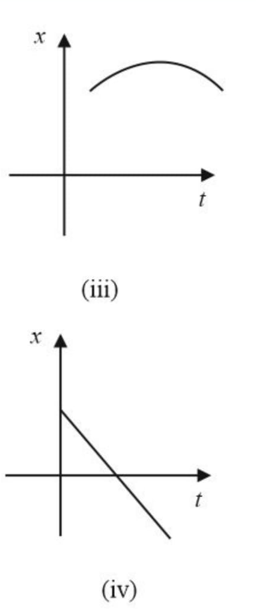
Which of the following graphs represents the position time-graph of a particle moving with negative velocity?
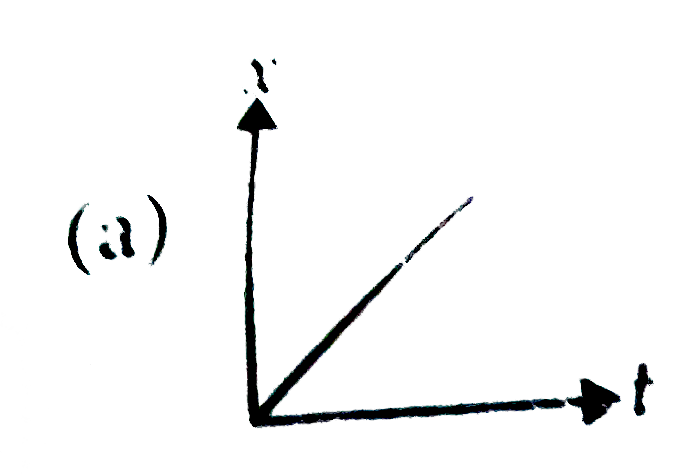
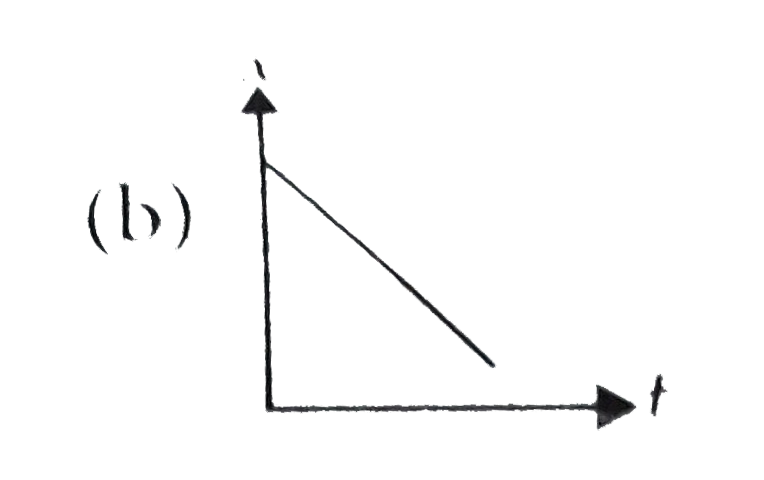
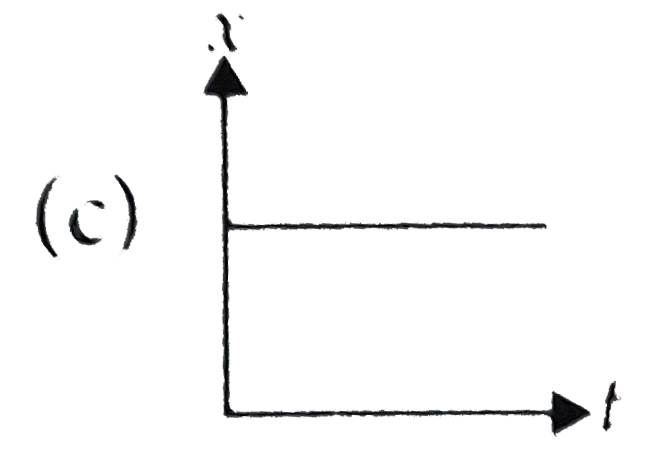
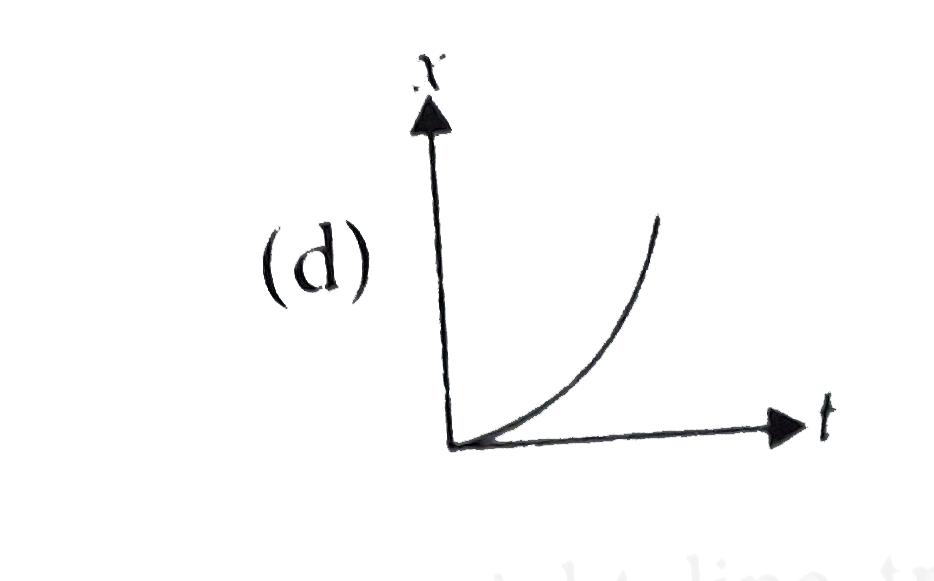
The correct Answer is:B
To determine which graph represents the position-time graph of a particle moving with negative velocity, we will analyze each of the given graphs step by step.
1. Understanding Negative Velocity:
- Negative velocity indicates that the position of the particle is decreasing over time. This means that the slope of the position-time graph must be negative.
2. Analyzing Graph A:
- Graph A shows a straight line with a positive slope. Since the slope is positive, this indicates that the velocity is positive. Therefore, Graph A does not represent negative velocity.
3. Analyzing Graph B:
- Graph B shows a straight line with a slope that is negative (the line is sloping downwards as time increases). This indicates that the position of the particle is decreasing over time, which means the particle is moving with negative velocity. Thus, Graph B is a candidate for representing negative velocity.
4. Analyzing Graph C:
- Graph C is a horizontal line, which indicates that the position of the particle is constant over time. Since the position does not change, the velocity is zero. Therefore, Graph C does not represent negative velocity.
5. Analyzing Graph D:
- Graph D is a parabolic curve that opens upwards. The slope of the tangent line at any point on this curve is positive and increasing. This indicates that the velocity is increasing and is positive. Therefore, Graph D does not represent negative velocity.
6. Conclusion:
- After analyzing all the graphs, we find that only Graph B has a negative slope, indicating that the particle is moving with negative velocity.
Final Answer:
Graph B represents the position-time graph of a particle moving with negative velocity.
---
- Negative velocity indicates that the position of the particle is decreasing over time. This means that the slope of the position-time graph must be negative.
- Graph A shows a straight line with a positive slope. Since the slope is positive, this indicates that the velocity is positive. Therefore, Graph A does not represent negative velocity.
- Graph B shows a straight line with a slope that is negative (the line is sloping downwards as time increases). This indicates that the position of the particle is decreasing over time, which means the particle is moving with negative velocity. Thus, Graph B is a candidate for representing negative velocity.
- Graph C is a horizontal line, which indicates that the position of the particle is constant over time. Since the position does not change, the velocity is zero. Therefore, Graph C does not represent negative velocity.
- Graph D is a parabolic curve that opens upwards. The slope of the tangent line at any point on this curve is positive and increasing. This indicates that the velocity is increasing and is positive. Therefore, Graph D does not represent negative velocity.
- After analyzing all the graphs, we find that only Graph B has a negative slope, indicating that the particle is moving with negative velocity.
Graph B represents the position-time graph of a particle moving with negative velocity.
Topper's Solved these Questions
- MOTION IN A STRAIGHT LINEBOOK - NCERT FINGERTIPSCHAPTER - MOTION IN A STRAIGHT LINEEXERCISE - Instantaneous Velocity And Speed
16 Videos
- MOTION IN A STRAIGHT LINEBOOK - NCERT FINGERTIPSCHAPTER - MOTION IN A STRAIGHT LINEEXERCISE - Acceleration
19 Videos
- MOTION IN A STRAIGHT LINEBOOK - NCERT FINGERTIPSCHAPTER - MOTION IN A STRAIGHT LINEEXERCISE - Position, Path Length And Displacement
6 Videos
- MOTION IN A PLANE BOOK - NCERT FINGERTIPSCHAPTER - MOTION IN A PLANE EXERCISE - Assertion And Reason
15 Videos
- OSCILLATIONS BOOK - NCERT FINGERTIPSCHAPTER - OSCILLATIONS EXERCISE - Assertion And Reason
15 Videos
Similar Questions
Knowledge Check
Which of the following graphs represents the velocity-time relationship for a falling apple?
A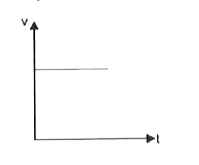 B
B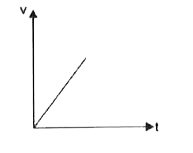 C
C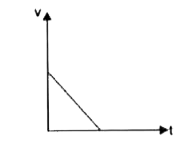 D
D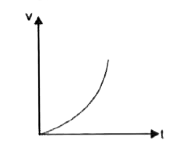
Position - time graph for motion with negative acceleration is
A B
B C
C D
D
A ball is thrown vertically upwards. Which of the following graph/graphs represent velocity time graph of the ball during its flight ( air resistance is neglected).
A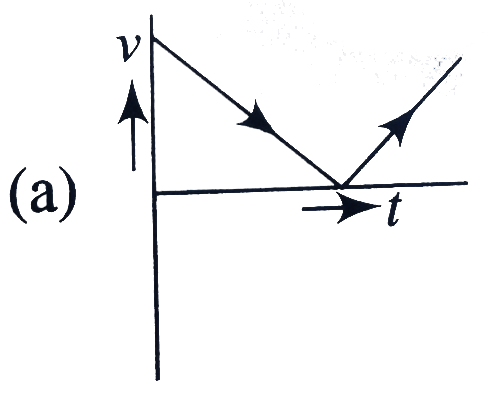 B
B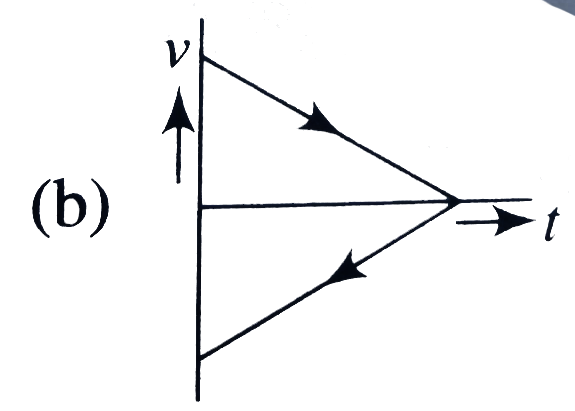 C
C D
D
The graph shown the variation with times t of the velocity v of an object . Which one of the following graphs best represents the variation of acceleration a of the object with time t?

View SolutionWhich one of the following represents displacement-time graph of two objects A and B moving with zero relative velocity?
View SolutionThe velocity v of a particle moving along x - axis varies with ist position (x) as v=α√x, where α is a constant. Which of the following graph represents the variation of its acceleration (a) with time (t)?
View SolutionThe velocity -displacement graph of a particle is as shown in the figure. Which of the following graphs correctly represents the variation of acceleration with displacement?

View SolutionWhich graph represents positive acceleration ?
View Solution

