The velocity v of a particle moving along x - axis varies with ist position (x) as v=α√x, where α is a constant. Which of the following graph represents the variation of its acceleration (a) with time (t)?
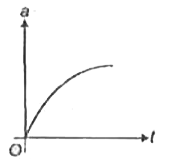
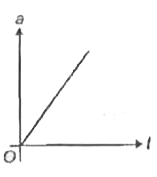
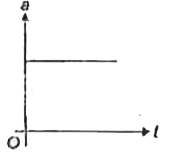
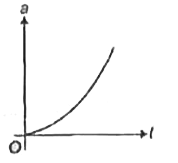
The correct Answer is:C
To solve the problem, we need to find the relationship between acceleration a and time t for a particle whose velocity v varies with position x as v=α√x.
1. Understanding the Given Relation:
The velocity of the particle is given by:
v=α√x
where α is a constant.
2. Finding Acceleration:
Acceleration a is defined as the rate of change of velocity with respect to time:
a=dvdt
We can use the chain rule to express this in terms of position:
a=dvdx⋅dxdt
Here, dxdt is the velocity v.
3. Calculating dvdx:
We need to differentiate v with respect to x:
v=α√x
Differentiating:
dvdx=α2√x
4. Substituting Back into the Acceleration Formula:
Now substituting dvdx and v into the acceleration formula:
a=v⋅dvdx=α√x⋅α2√x=α22
This shows that the acceleration a is a constant value, independent of x.
5. Relating Acceleration to Time:
Since the acceleration a is constant, it does not change with time. Therefore, the graph representing the variation of acceleration a with time t will be a horizontal line.
6. Conclusion:
The correct graph representing the variation of acceleration a with time t is a horizontal line, indicating that acceleration is constant.
Final Answer:
The graph that represents the variation of acceleration a with time t is a horizontal line (constant acceleration).
---
The velocity of the particle is given by:
v=α√x
where α is a constant.
Acceleration a is defined as the rate of change of velocity with respect to time:
a=dvdt
We can use the chain rule to express this in terms of position:
a=dvdx⋅dxdt
Here, dxdt is the velocity v.
We need to differentiate v with respect to x:
v=α√x
Differentiating:
dvdx=α2√x
Now substituting dvdx and v into the acceleration formula:
a=v⋅dvdx=α√x⋅α2√x=α22
This shows that the acceleration a is a constant value, independent of x.
Since the acceleration a is constant, it does not change with time. Therefore, the graph representing the variation of acceleration a with time t will be a horizontal line.
The correct graph representing the variation of acceleration a with time t is a horizontal line, indicating that acceleration is constant.
The graph that represents the variation of acceleration a with time t is a horizontal line (constant acceleration).
Topper's Solved these Questions
- MOTION IN A STRAIGHT LINEBook:AAKASH INSTITUTEChapter:MOTION IN A STRAIGHT LINEExercise:ASSIGNMENT (SECTION - C)
Explore 37 Videos
- MOTION IN A STRAIGHT LINEBook:AAKASH INSTITUTEChapter:MOTION IN A STRAIGHT LINEExercise:ASSIGNMENT (SECTION - D)
Explore 15 Videos
- MOTION IN A STRAIGHT LINEBook:AAKASH INSTITUTEChapter:MOTION IN A STRAIGHT LINEExercise:ASSIGNMENT (SECTION - A)
Explore 60 Videos
- MOTION IN A PLANEBook:AAKASH INSTITUTEChapter:MOTION IN A PLANEExercise:Assignement section -J (Aakash Challengers Questions)
Explore 4 Videos
- MOTION IN STRAIGHT LINEBook:AAKASH INSTITUTEChapter:MOTION IN STRAIGHT LINEExercise:Assignment (SECTION - J)
Explore 2 Videos
Similar Questions
The velocity (v) of a particle of mass m moving along x-axis is given by v=α√x, where α is a constant. Find work done by force acting on particle during its motion from x=0 to x=2m :-
View SolutionThe velocity of a particle moving in the positive direction of x-axis varies as v=α√x where α is positive constant. Assuming that at the moment t=0, the particle was located at x=0, find (i) the time dependance of the velocity and the acceleration of the particle and (ii) the mean velocity of the particle averaged over the time that the particle takes to cover first s meters of the path.
View Solution
Knowledge Check
Which of the following graph(s) represent retardation ? [v : velocity, t : time, x : position]
A B
B C
C D
D
The velocity (υ) of a particle moving along X-axis varies with its position x as shown in figure. The acceleration (a) of particle varies with position (x) as
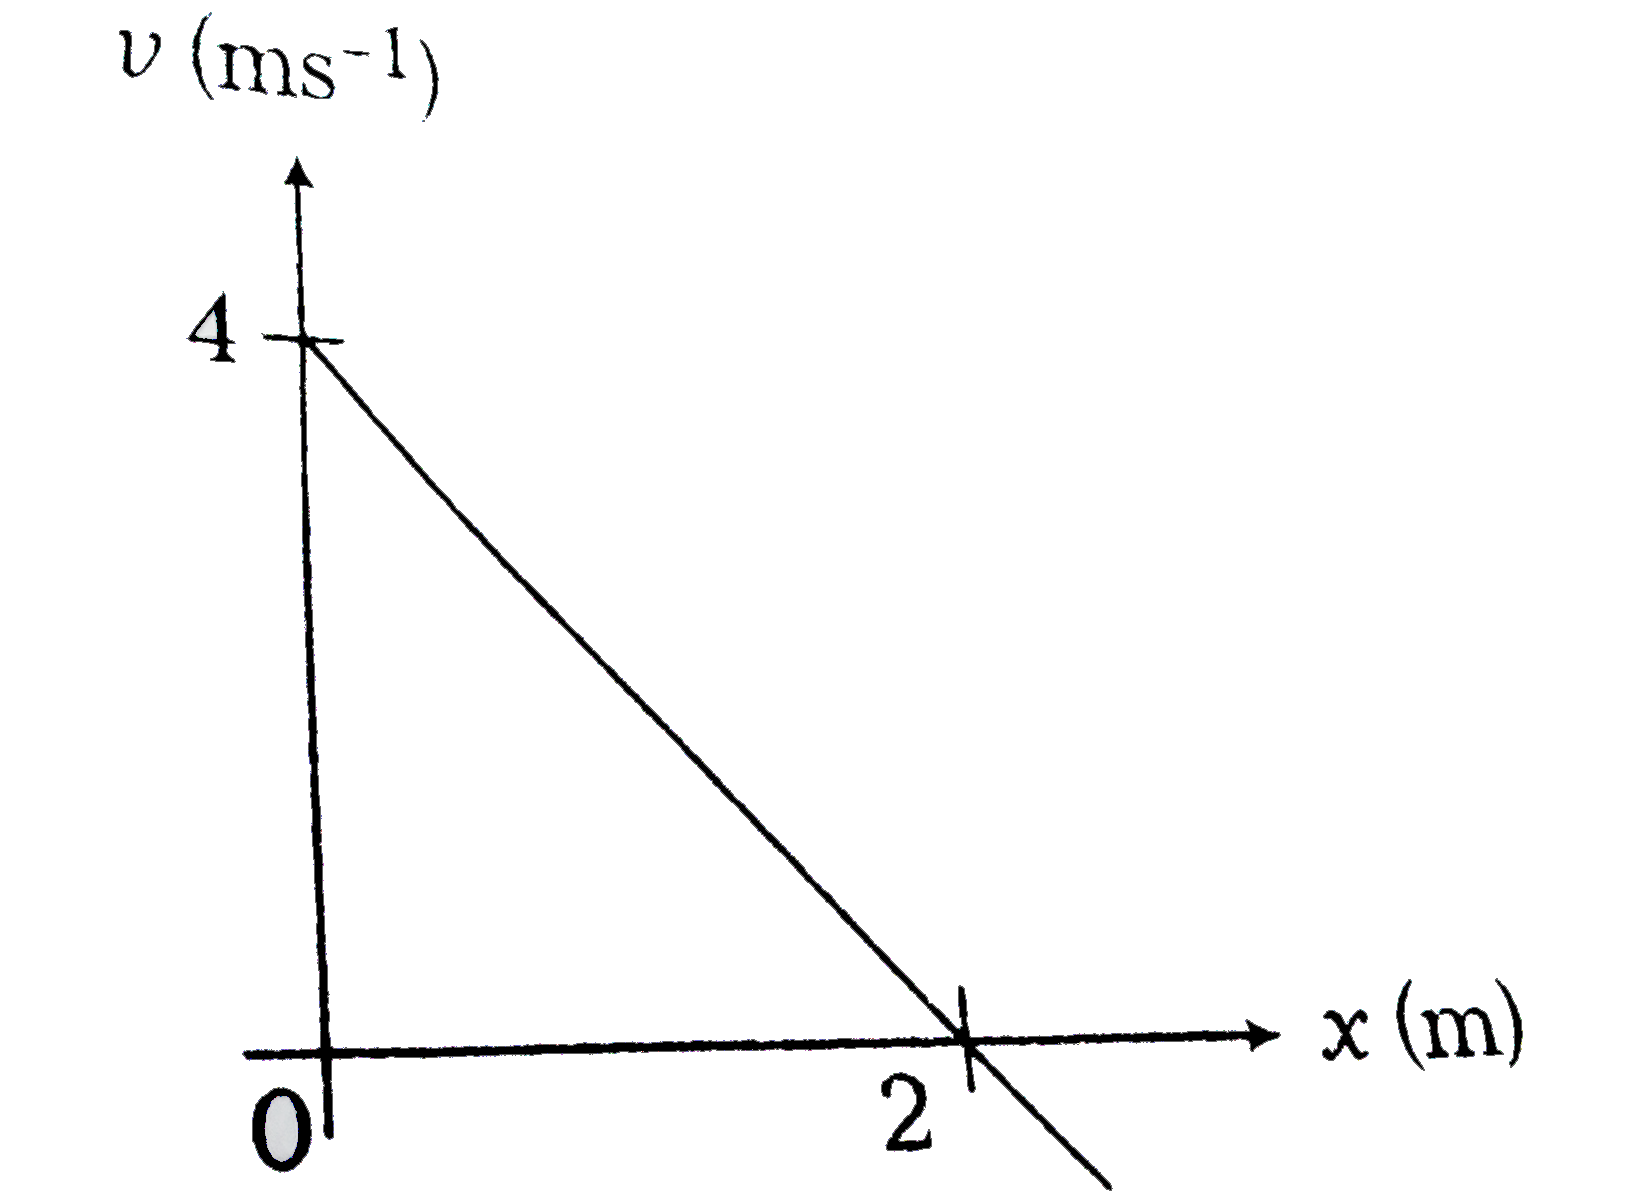 Aa2=x+3Ba=2x2+4C2a=3x+5Da=4x−8
The graph shown the variation with times t of the velocity v of an object . Which one of the following graphs best represents the variation of acceleration a of the object with time t?
 A
A B
B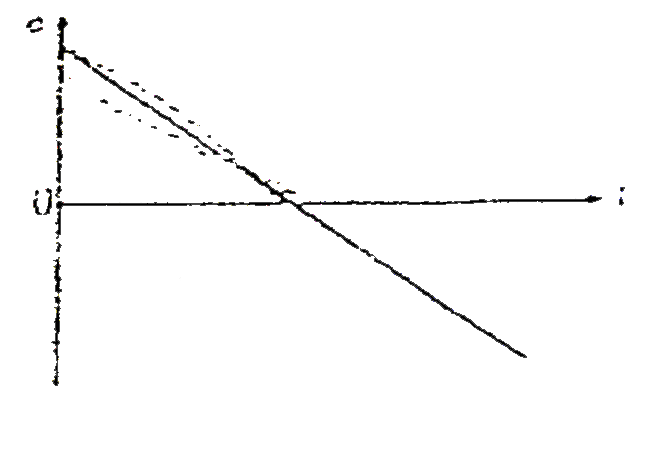 C
C D
D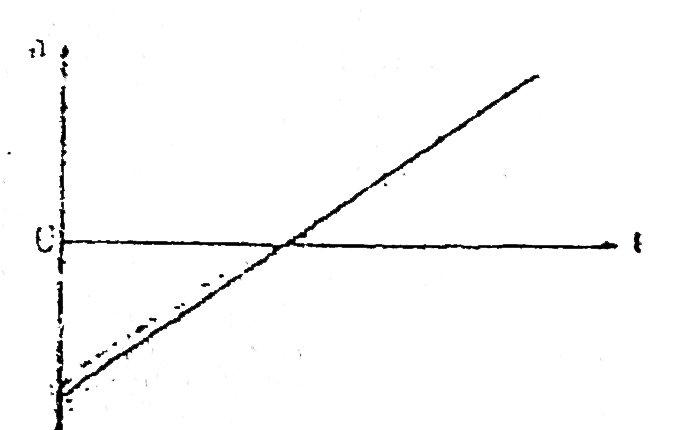
The position of a particle moving along x-axis varies with time t according to equation x=√3sinωt−cosωt where ω is constants. Find the refion in which the particle is confined.
View SolutionThe velocity of a particle moving in the positive direction of the X-axis varies as V=K√S where K is a positive constant. Draw V−t graph.
View SolutionThe velocity of a particle moving in the positive direction of the x axis varies as v=α√x, where α is a positive constant. Assuming that at the moment t=0 the particle was located at the point x=0, find:
(a) the time dependence of the velocity and the acceleration of the particle,
(b) the mean velocity of the particle averaged over the time that the particle takes to cover the first s metres of the path.
View SolutionA body starting from the the rest moves along a straight line with constant acceleration. Which one of the following graphs represents the variation of speed(v) and distance(s)?
View SolutionA body starting from the rest moves along a straight line with constant acceleration .Which one of the following graphs represent the variation of speed (v) and distance (s) ?
View Solution