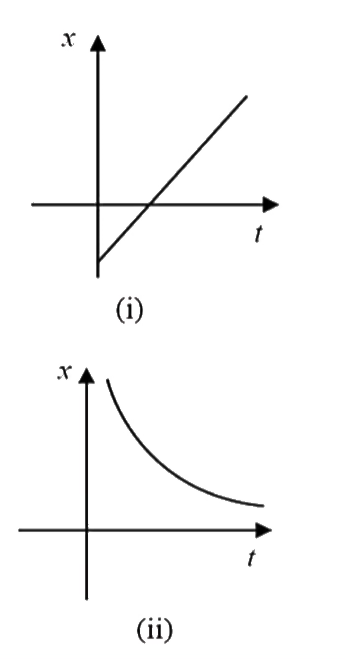
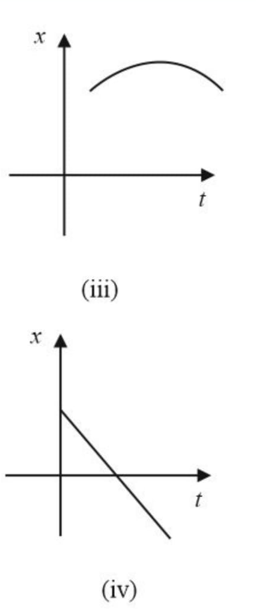
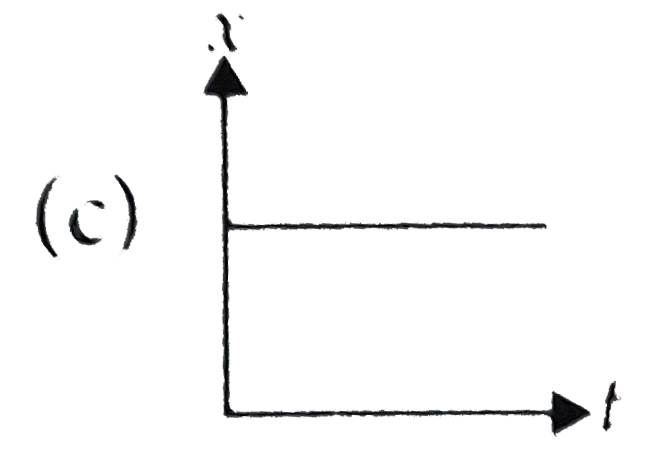
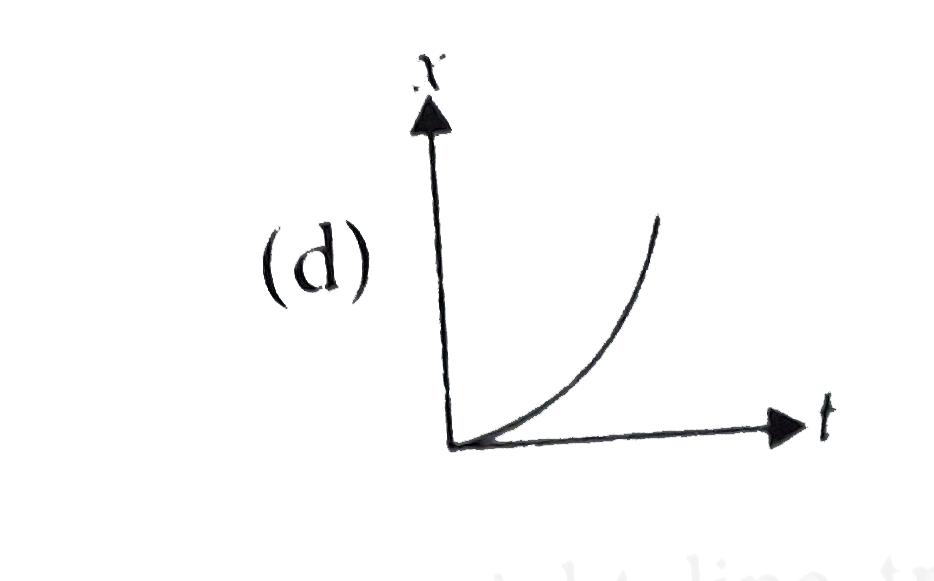
Which of the following graphs represents the position time-graph of a particle moving with negative velocity?
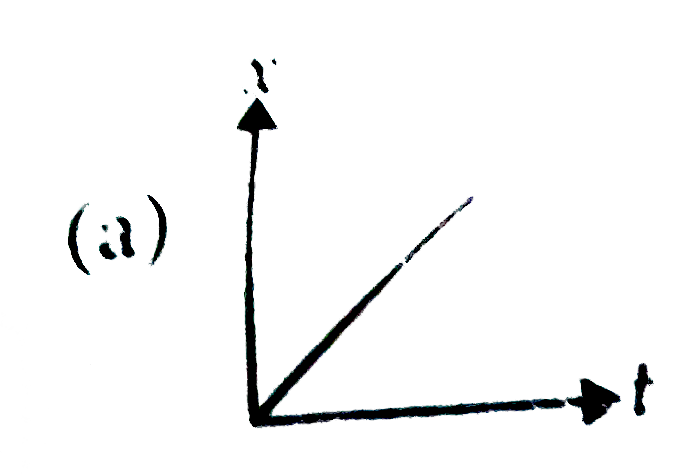
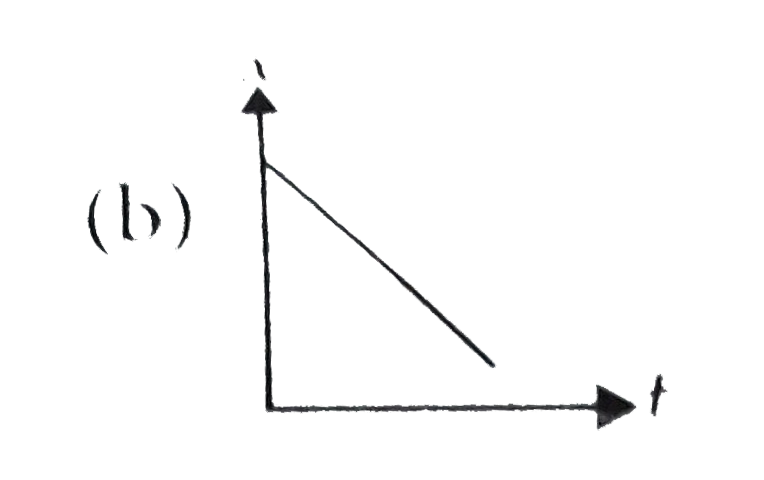
The correct Answer is:B
To determine which graph represents the position-time graph of a particle moving with negative velocity, we can analyze the characteristics of each graph based on the relationship between position and time.
1. Understanding Position-Time Graphs:
- A position-time graph plots the position of an object against time. The slope of this graph indicates the velocity of the object.
- A positive slope indicates positive velocity (the object is moving away from the origin), while a negative slope indicates negative velocity (the object is moving towards the origin).
2. Analyzing Each Graph:
- Graph A: As time increases, the position also increases. This indicates a positive slope, which means the particle is moving with positive velocity.
- Graph B: As time increases, the position decreases. This indicates a negative slope, which means the particle is moving with negative velocity.
- Graph C: The position remains constant as time increases. This indicates a slope of zero, meaning the object is at rest.
- Graph D: As time increases, the position increases. This indicates a positive slope, which means the particle is moving with positive velocity.
3. Conclusion:
- From the analysis, we can conclude that Graph B represents the position-time graph of a particle moving with negative velocity.
Final Answer:
The graph that represents the position-time graph of a particle moving with negative velocity is Graph B.
- A position-time graph plots the position of an object against time. The slope of this graph indicates the velocity of the object.
- A positive slope indicates positive velocity (the object is moving away from the origin), while a negative slope indicates negative velocity (the object is moving towards the origin).
- Graph A: As time increases, the position also increases. This indicates a positive slope, which means the particle is moving with positive velocity.
- Graph B: As time increases, the position decreases. This indicates a negative slope, which means the particle is moving with negative velocity.
- Graph C: The position remains constant as time increases. This indicates a slope of zero, meaning the object is at rest.
- Graph D: As time increases, the position increases. This indicates a positive slope, which means the particle is moving with positive velocity.
- From the analysis, we can conclude that Graph B represents the position-time graph of a particle moving with negative velocity.
The graph that represents the position-time graph of a particle moving with negative velocity is Graph B.
Topper's Solved these Questions
- BOOK - NCERT FINGERTPS ENGLISHCHAPTER - MOTION IN A STRAIGHT LINEEXERCISE - INSTANTANEOUS VELOCITY AND SPEED16videos
MOTION IN A STRAIGHT LINE
- BOOK - NCERT FINGERTPS ENGLISHCHAPTER - MOTION IN A STRAIGHT LINEEXERCISE - ACCELERATION19videos
MOTION IN A STRAIGHT LINE
- BOOK - NCERT FINGERTPS ENGLISHCHAPTER - MOTION IN A STRAIGHT LINEEXERCISE - POSITION, PATH LENGTH AND DISPLACEMENT6videos
MOTION IN A STRAIGHT LINE
- BOOK - NCERT FINGERTPS ENGLISHCHAPTER - MOTION IN A PLANE EXERCISE - Assertion And Reason15videos
MOTION IN A PLANE
- BOOK - NCERT FINGERTPS ENGLISHCHAPTER - OSCILLATIONS EXERCISE - Assertion And Reason15videos
OSCILLATIONS
Similar Questions
Knowledge Check
- Question 1 - Select One
Which one of the following represents displacement-time graph of two objects A and B moving with zero relative velocity?
A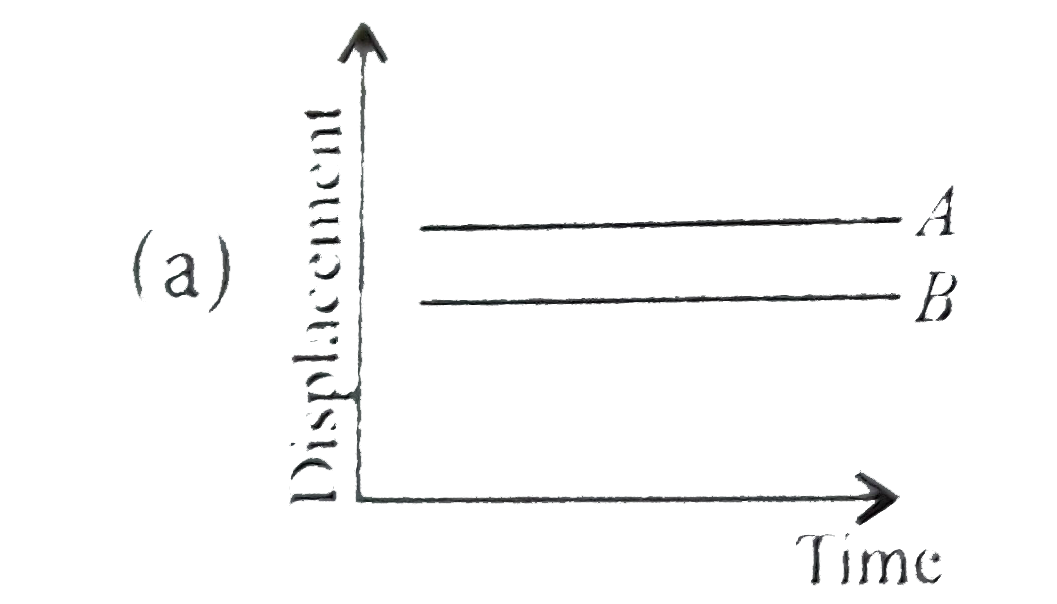 B
B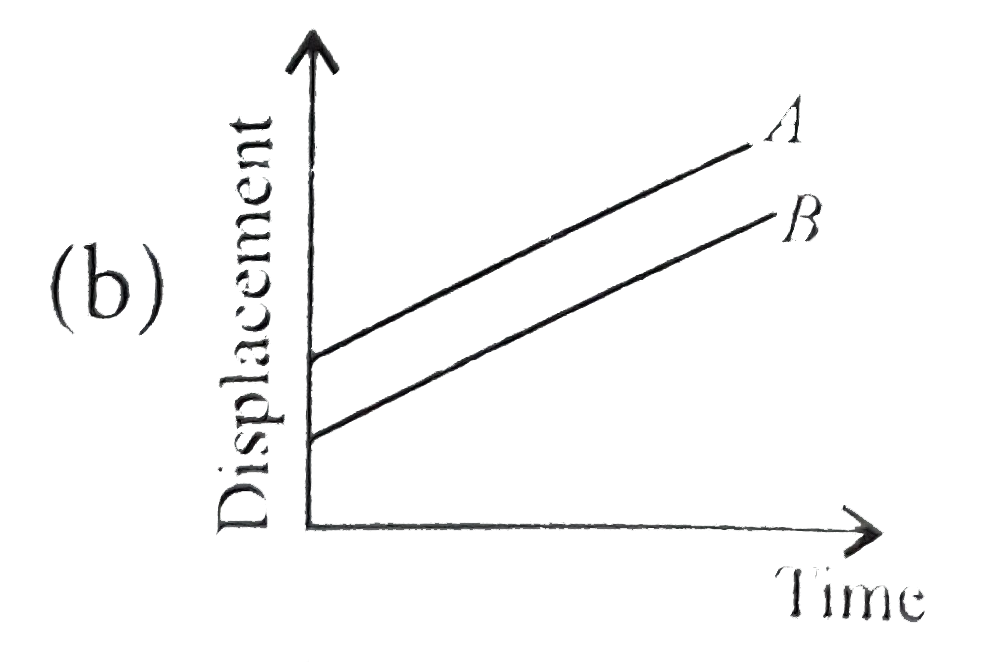 C
C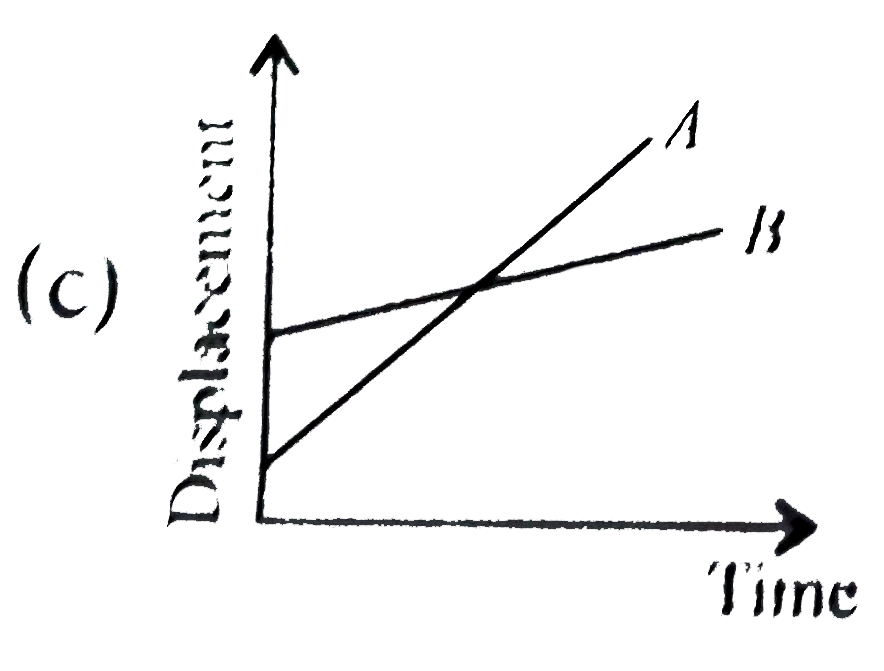 D
D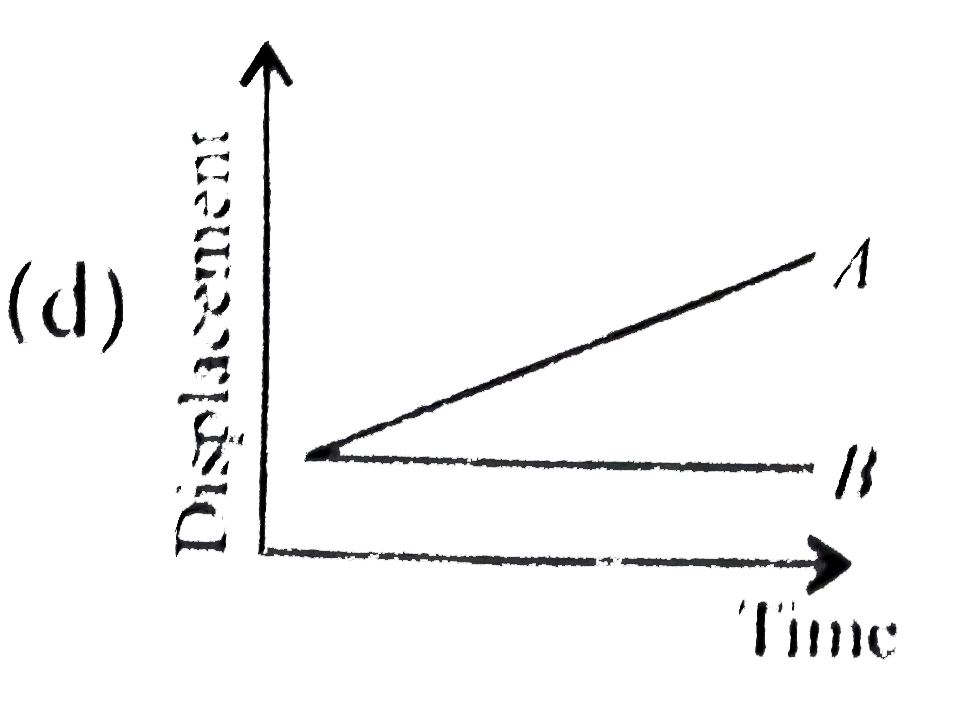
- Question 2 - Select One
The velocity -displacement graph of a particle is as shown in the figure. Which of the following graphs correctly represents the variation of acceleration with displacement?
 A
A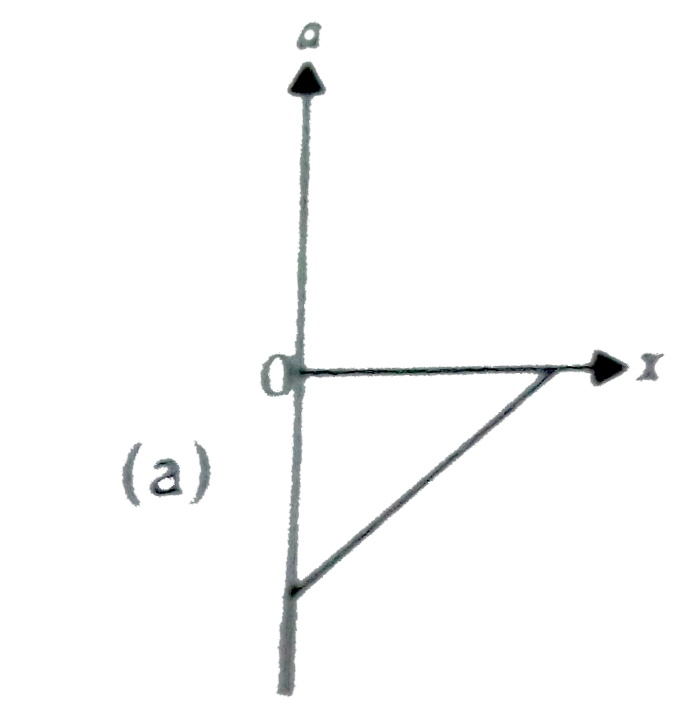 B
B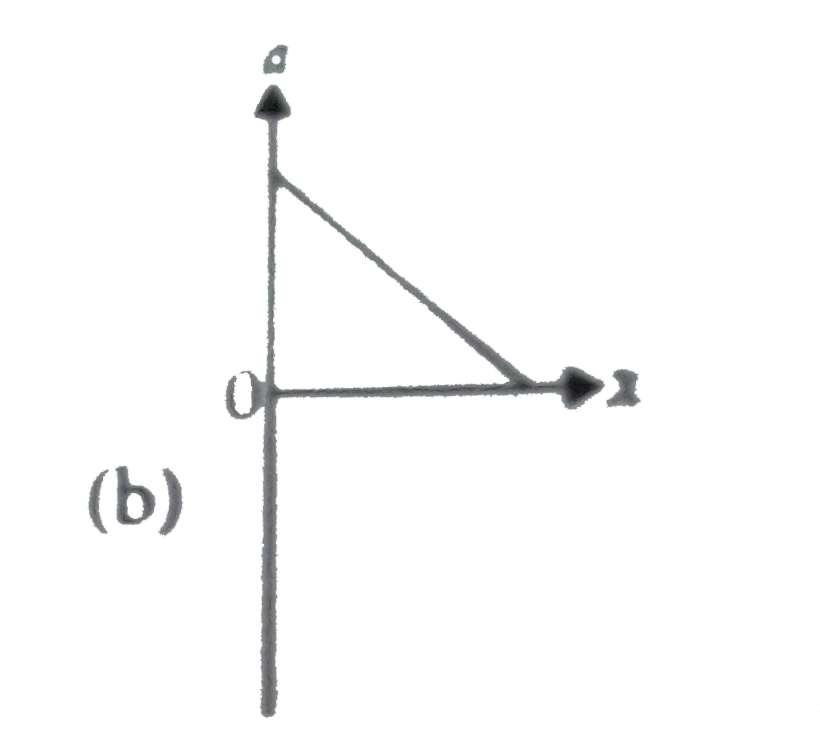 C
C D
D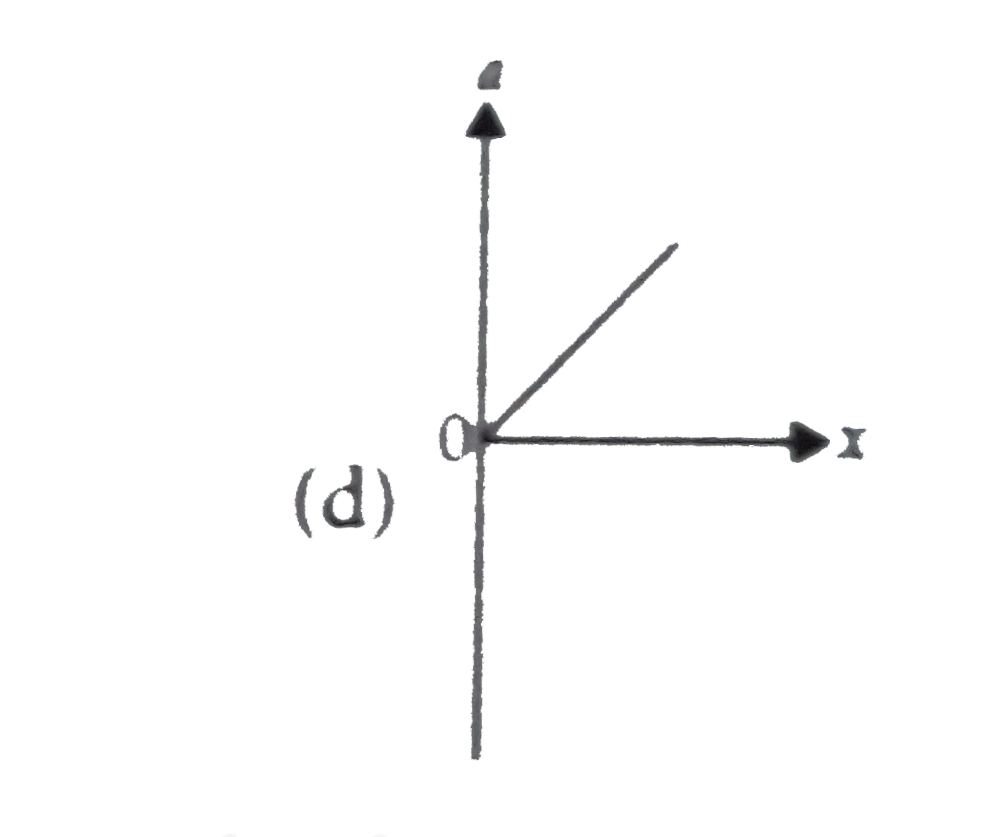
A ball is thrown vertically upwards. Which of the following graph/graphs represent velocity-time graph of the ball during its flight (air resistance is neglected)
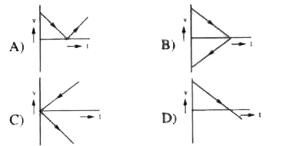 View Solution
Which of the following velocity-time graphs represent uniform motion
View SolutionThe graph shown the variation with times t of the velocity v of an object . Which one of the following graphs best represents the variation of acceleration a of the object with time t?
 View Solution
The velocity v of a particle moving along x - axis varies with ist position (x) as v=α√x, where α is a constant. Which of the following graph represents the variation of its acceleration (a) with time (t)?
View SolutionWhich graph represents positive acceleration ?
View SolutionFor which of the following graphs the average velocity of a particle moving along a straight line for time interval (0,t) must be negative−
View Solution


