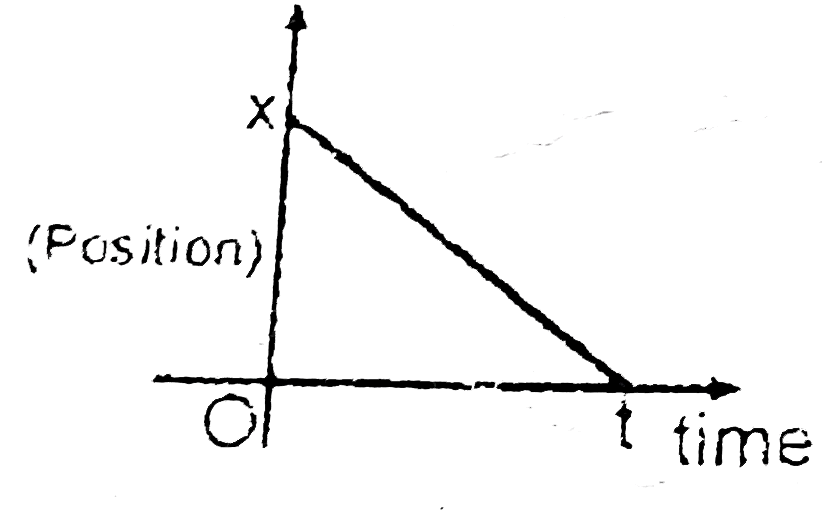
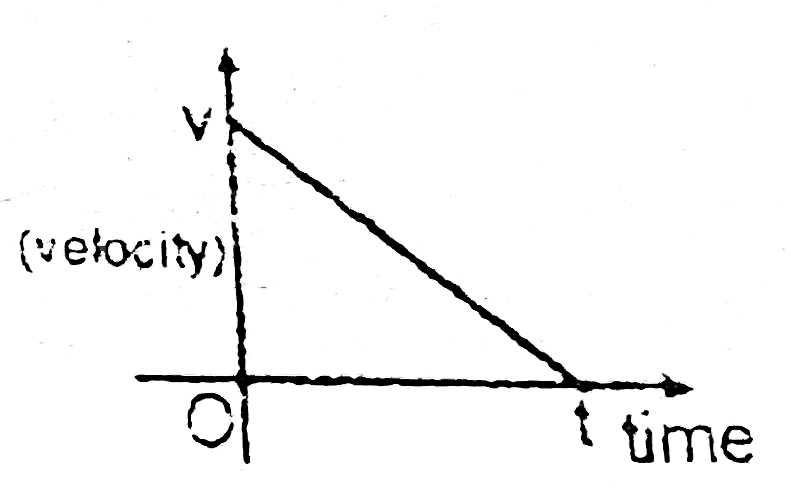
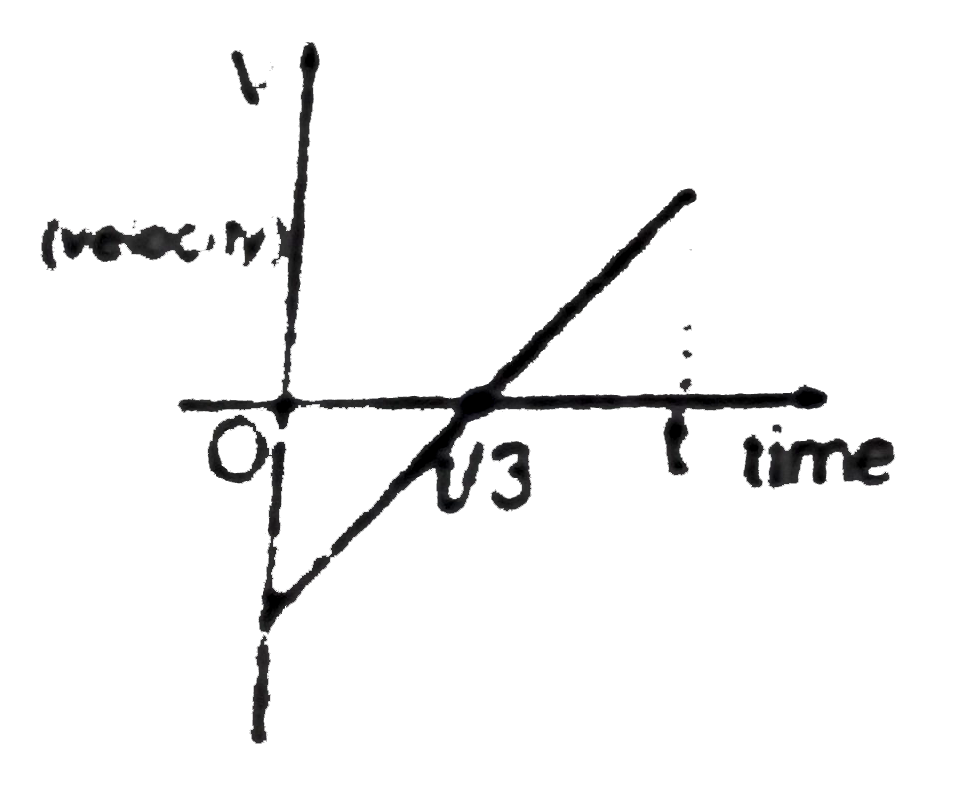
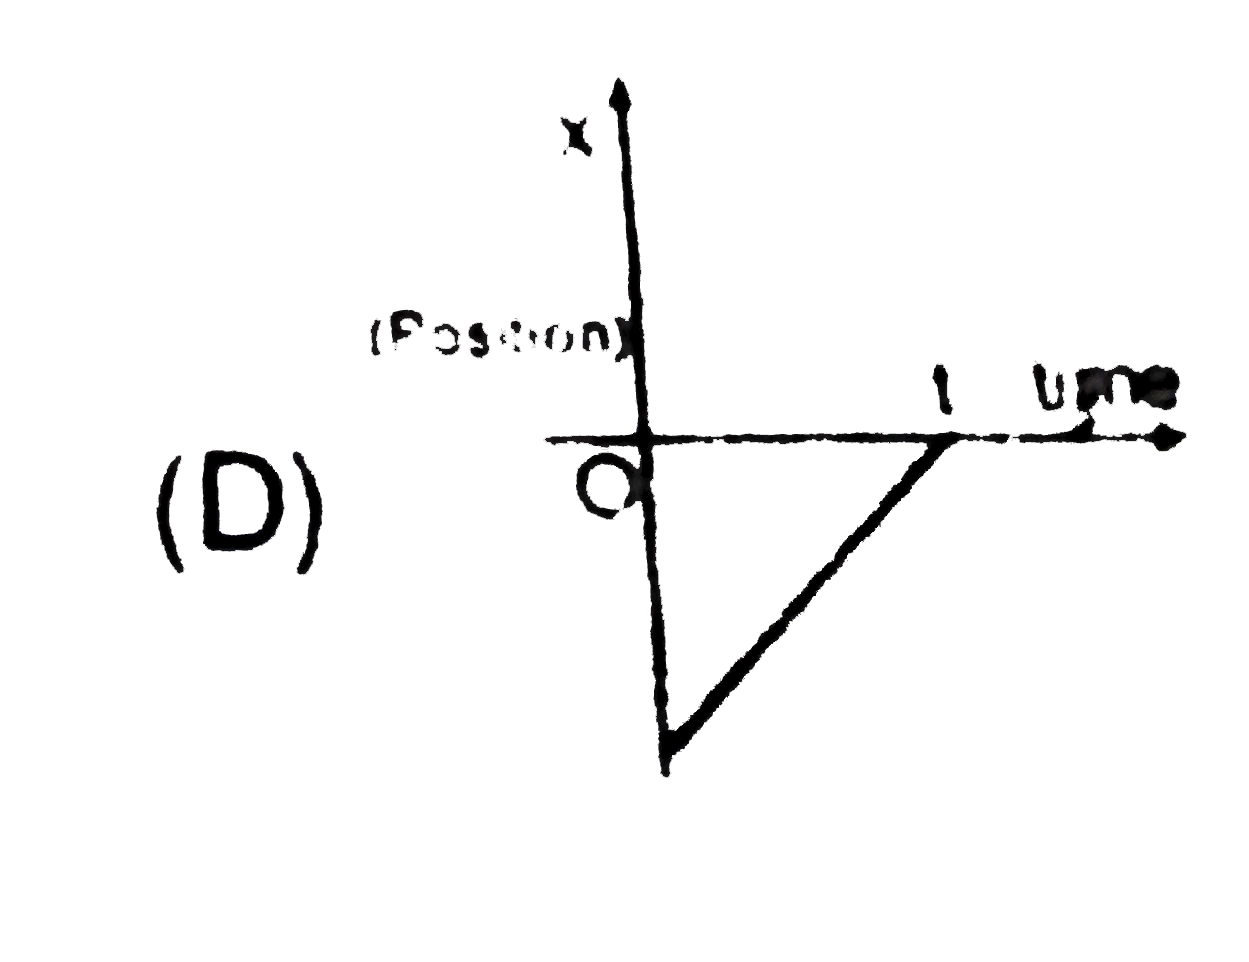
For which of the following graphs the average velocity of a particle moving along a straight line for time interval (0,t) must be negative−
The correct Answer is:A
To determine which graph indicates a negative average velocity for a particle moving along a straight line during the time interval (0,t), we need to analyze the concept of average velocity and how it relates to displacement.
1. Understanding Average Velocity:
Average velocity (vavg) is defined as the total displacement (Δx) divided by the total time (Δt):
vavg=ΔxΔt
For the interval (0,t), this can be expressed as:
vavg=x(t)−x(0)t−0=x(t)−x(0)t
2. Condition for Negative Average Velocity:
For the average velocity to be negative, the displacement must be negative:
x(t)−x(0)<0⟹x(t)<x(0)
This means that the final position of the particle at time t must be less than its initial position at time 0.
3. Analyzing Graphs:
We need to look at the position-time graphs provided in the options. The graph that shows the position decreasing over time will indicate a negative displacement.
4. Identifying the Correct Graph:
- If the graph shows a downward slope (i.e., the position decreases as time increases), then x(t)<x(0), leading to a negative average velocity.
- Conversely, if the graph shows an upward slope or remains constant, the average velocity will be zero or positive.
5. Conclusion:
After analyzing the graphs, the graph that exhibits a downward slope (indicating that the position of the particle decreases over time) is the correct answer. This corresponds to option A.
Final Answer:
The graph for which the average velocity of a particle moving along a straight line for the time interval (0,t) must be negative is Option A.
Average velocity (vavg) is defined as the total displacement (Δx) divided by the total time (Δt):
vavg=ΔxΔt
For the interval (0,t), this can be expressed as:
vavg=x(t)−x(0)t−0=x(t)−x(0)t
For the average velocity to be negative, the displacement must be negative:
x(t)−x(0)<0⟹x(t)<x(0)
This means that the final position of the particle at time t must be less than its initial position at time 0.
We need to look at the position-time graphs provided in the options. The graph that shows the position decreasing over time will indicate a negative displacement.
- If the graph shows a downward slope (i.e., the position decreases as time increases), then x(t)<x(0), leading to a negative average velocity.
- Conversely, if the graph shows an upward slope or remains constant, the average velocity will be zero or positive.
After analyzing the graphs, the graph that exhibits a downward slope (indicating that the position of the particle decreases over time) is the correct answer. This corresponds to option A.
The graph for which the average velocity of a particle moving along a straight line for the time interval (0,t) must be negative is Option A.
Topper's Solved these Questions
- DAILY PRACTICE PROBLEMBOOK - RESONANCE ENGLISHCHAPTER - DAILY PRACTICE PROBLEMEXERCISE - DPP No.12
9 Videos
- DAILY PRACTICE PROBLEMBOOK - RESONANCE ENGLISHCHAPTER - DAILY PRACTICE PROBLEMEXERCISE - DPP No.13
20 Videos
- DAILY PRACTICE PROBLEMBOOK - RESONANCE ENGLISHCHAPTER - DAILY PRACTICE PROBLEMEXERCISE - DPP No.10
9 Videos
- CURRENT ELECTRICITYBOOK - RESONANCE ENGLISHCHAPTER - CURRENT ELECTRICITYEXERCISE - High Level Problems (HIP)
19 Videos
- ELECTRO MAGNETIC WAVESBOOK - RESONANCE ENGLISHCHAPTER - ELECTRO MAGNETIC WAVESEXERCISE - Exercise 3
27 Videos
Similar Questions
Knowledge Check
Which of the following graphs represents the position time-graph of a particle moving with negative velocity?
A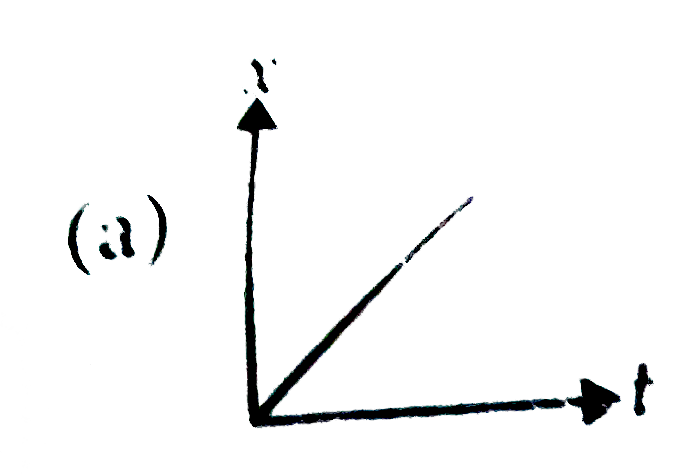 B
B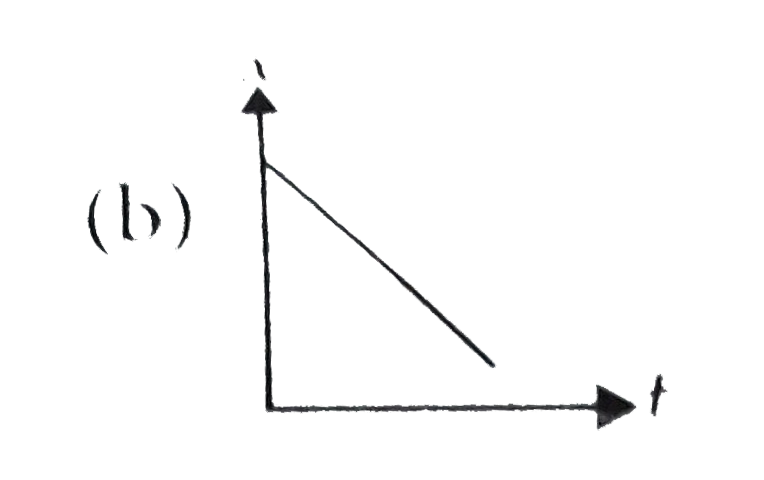 C
C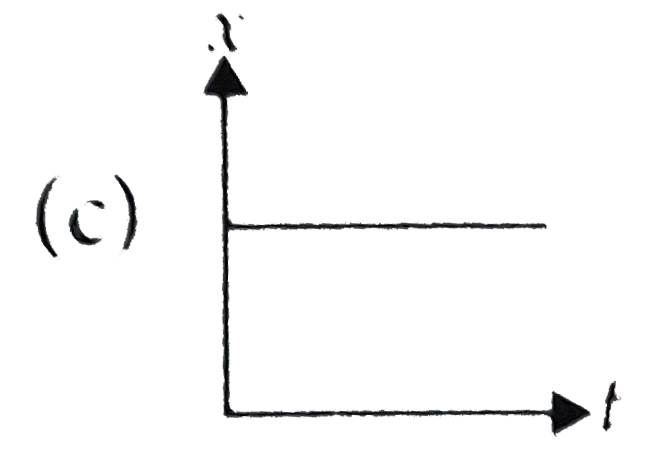 D
D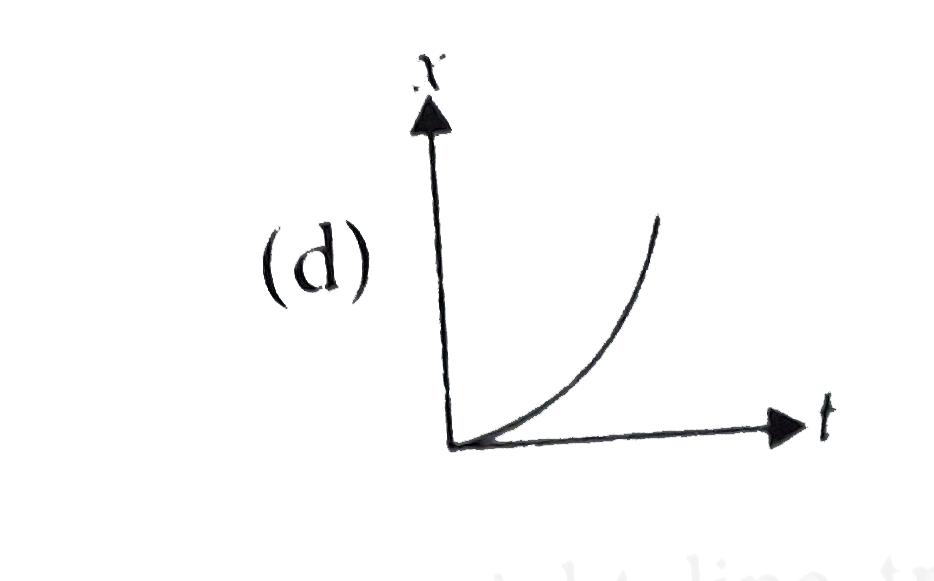
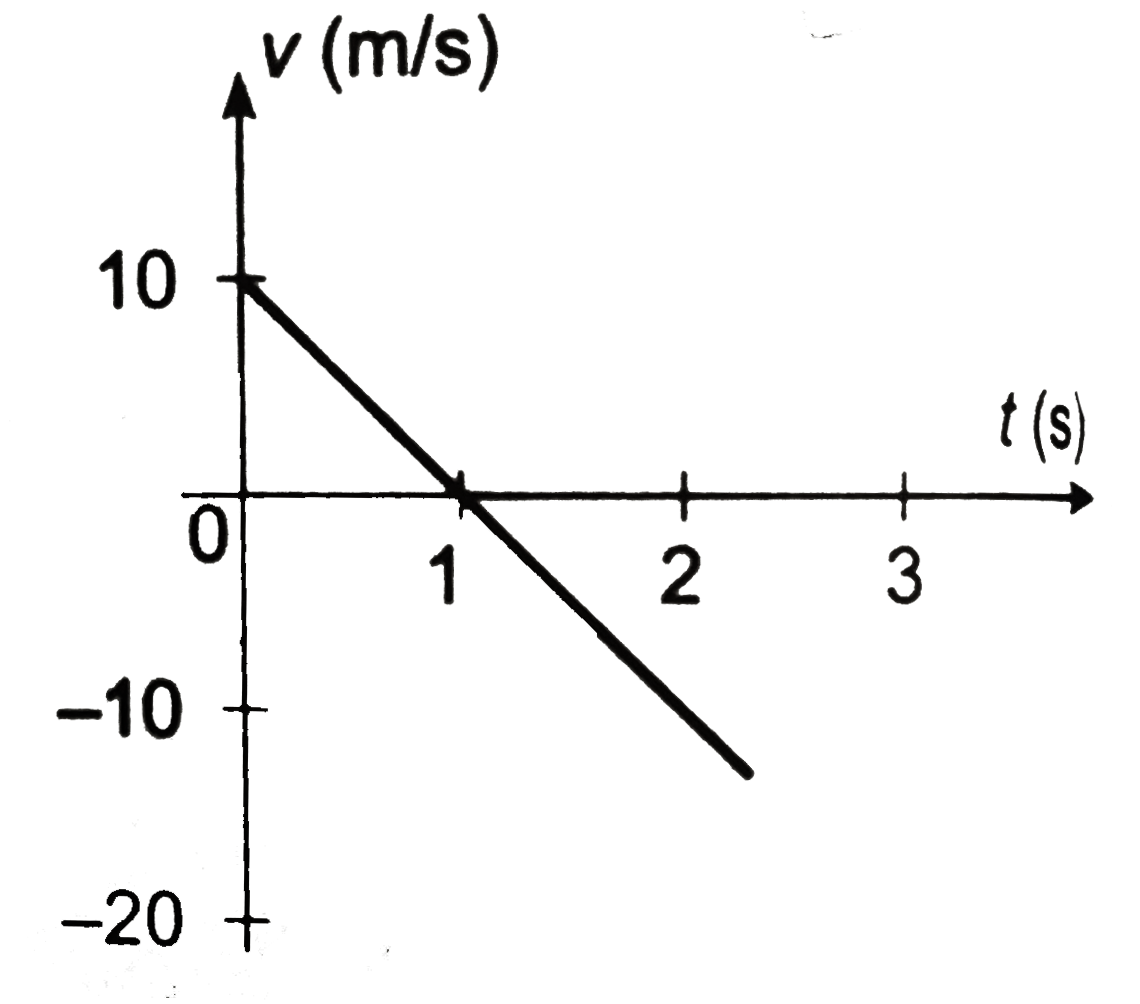
The figure shows velocity-time graph of a particle moving along a straight line. Identify the correct statement.
View SolutionAverage velocity of a particle moving in a straight line, with constant acceleration a and initial velocity u in first t seconds is.
View SolutionAverage velocity of a particle moving in a straight line, with constant acceleration a and initial velocity u in first t seconds is.
View SolutionWhich of the following graph for a body moving along a straight line is possible ?
View SolutionVelocity displacement graph of a particle moving in a straight line is as shown in figure.

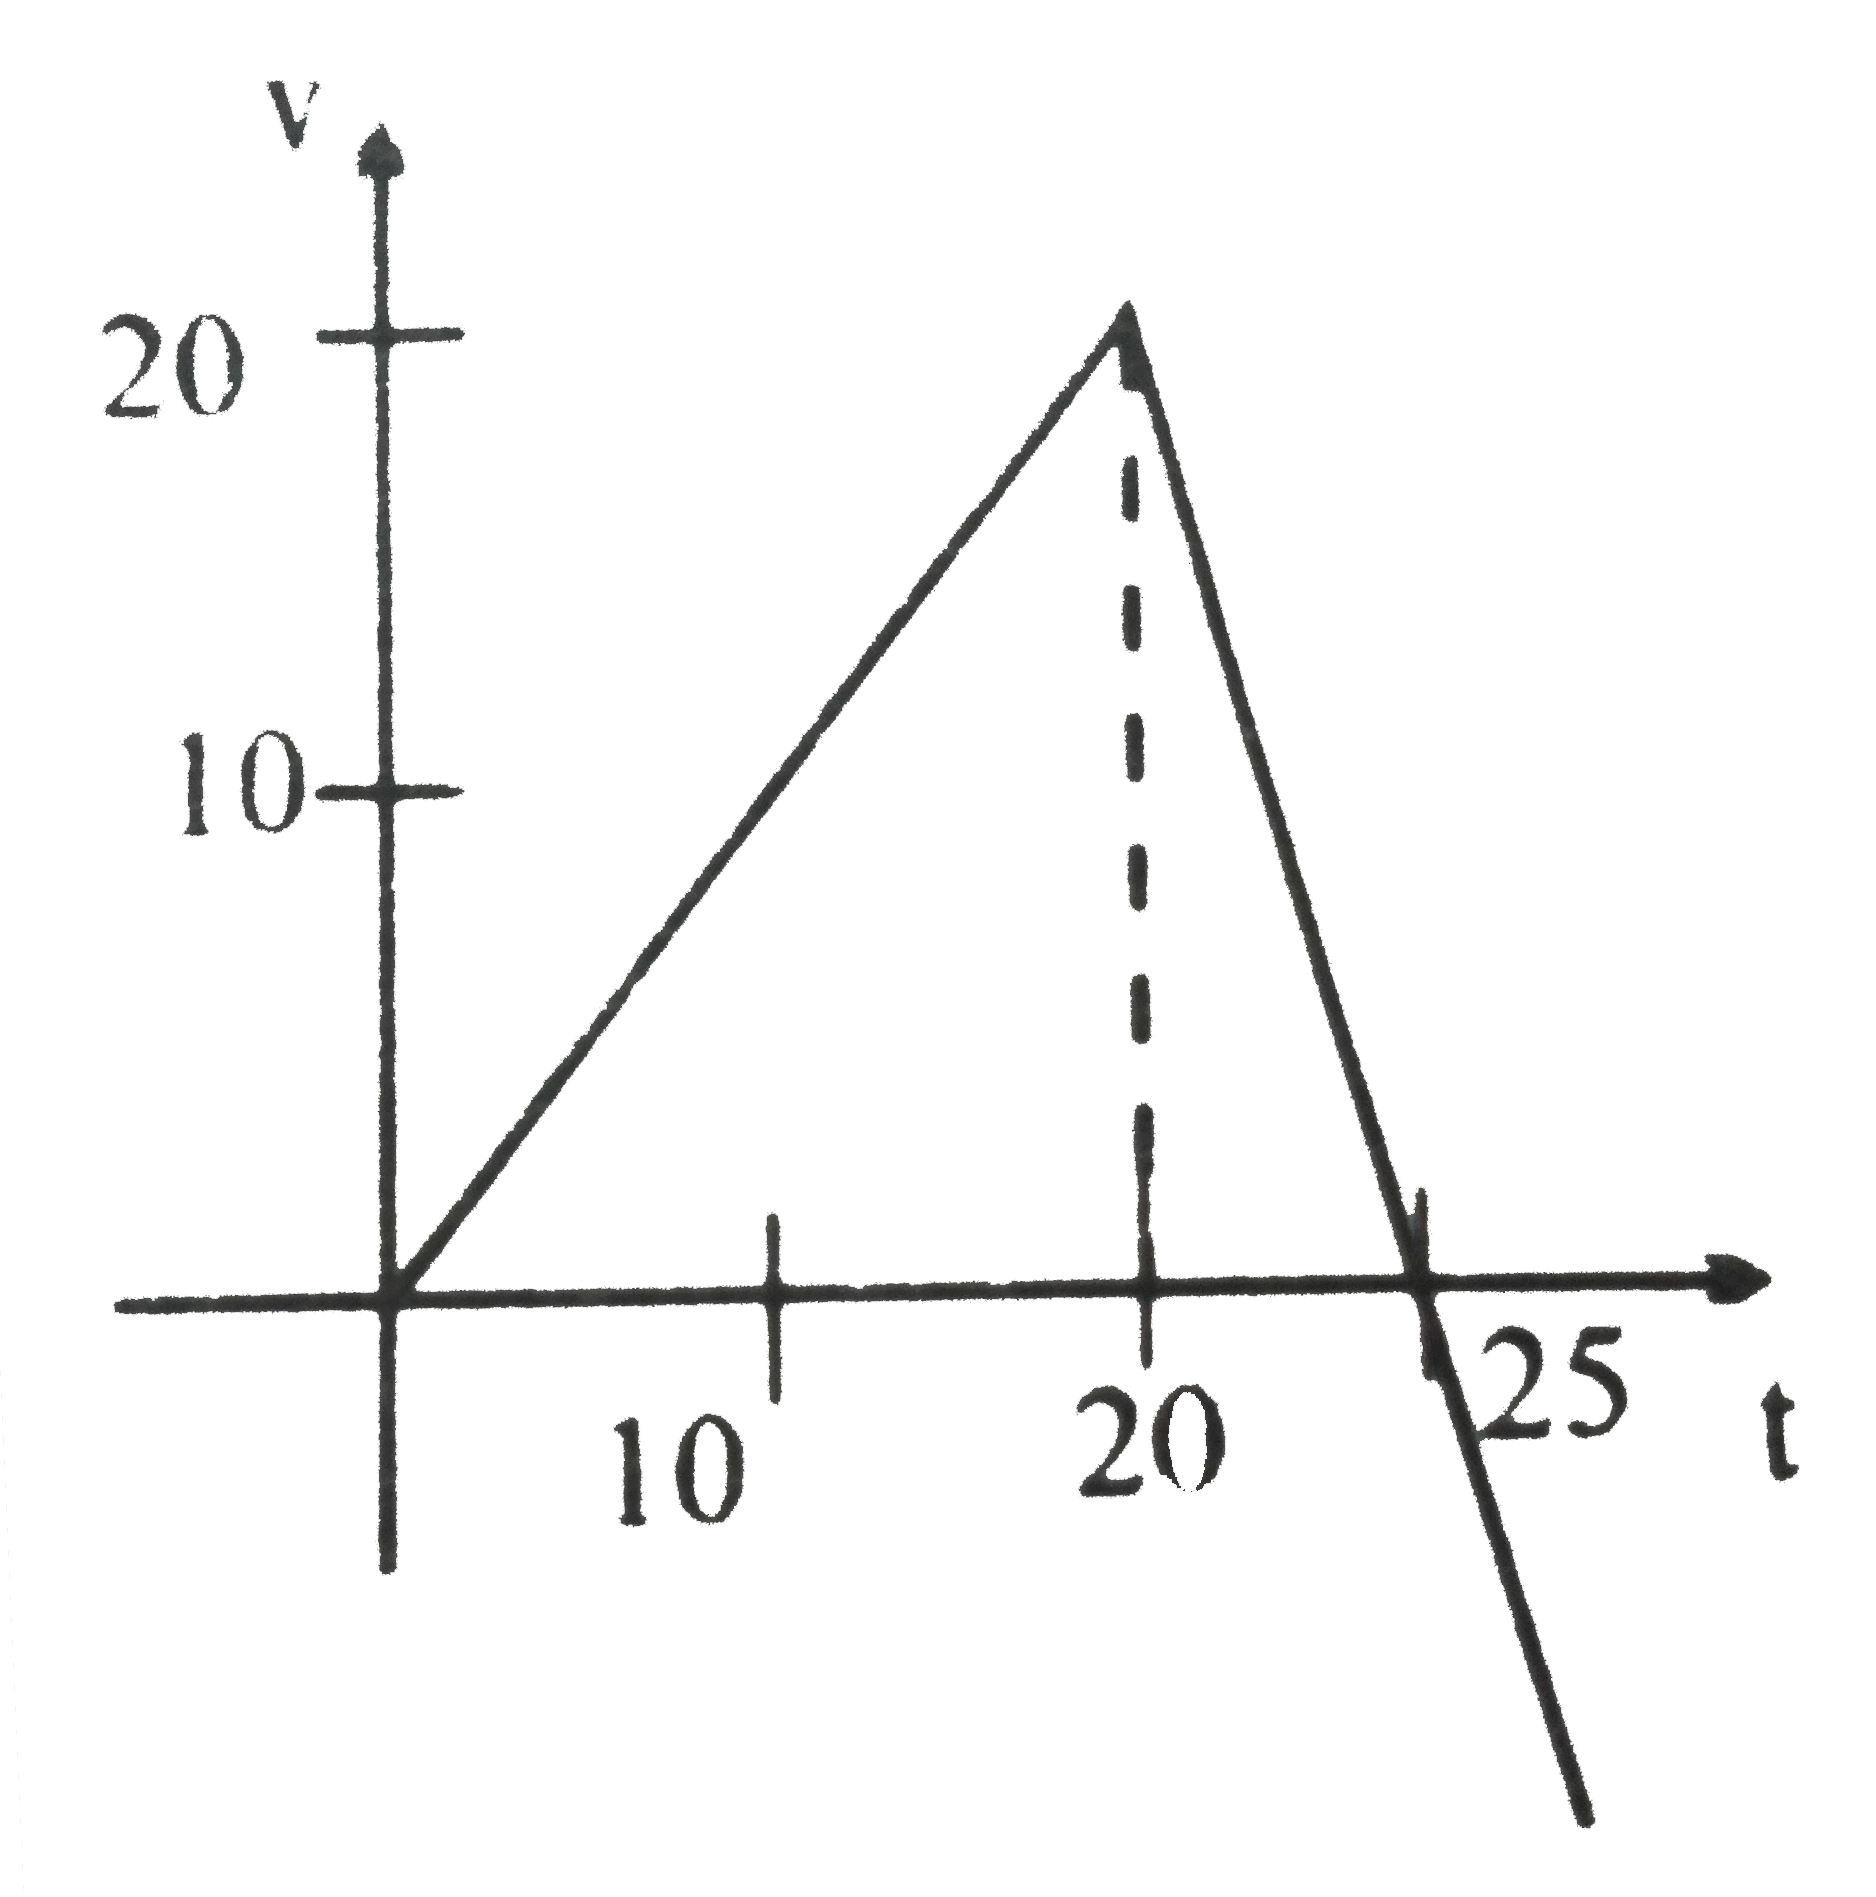
View SolutionThe fig. shows the v−t graph of a particle moving in straight line. Find the time when particle returns to the starting point.
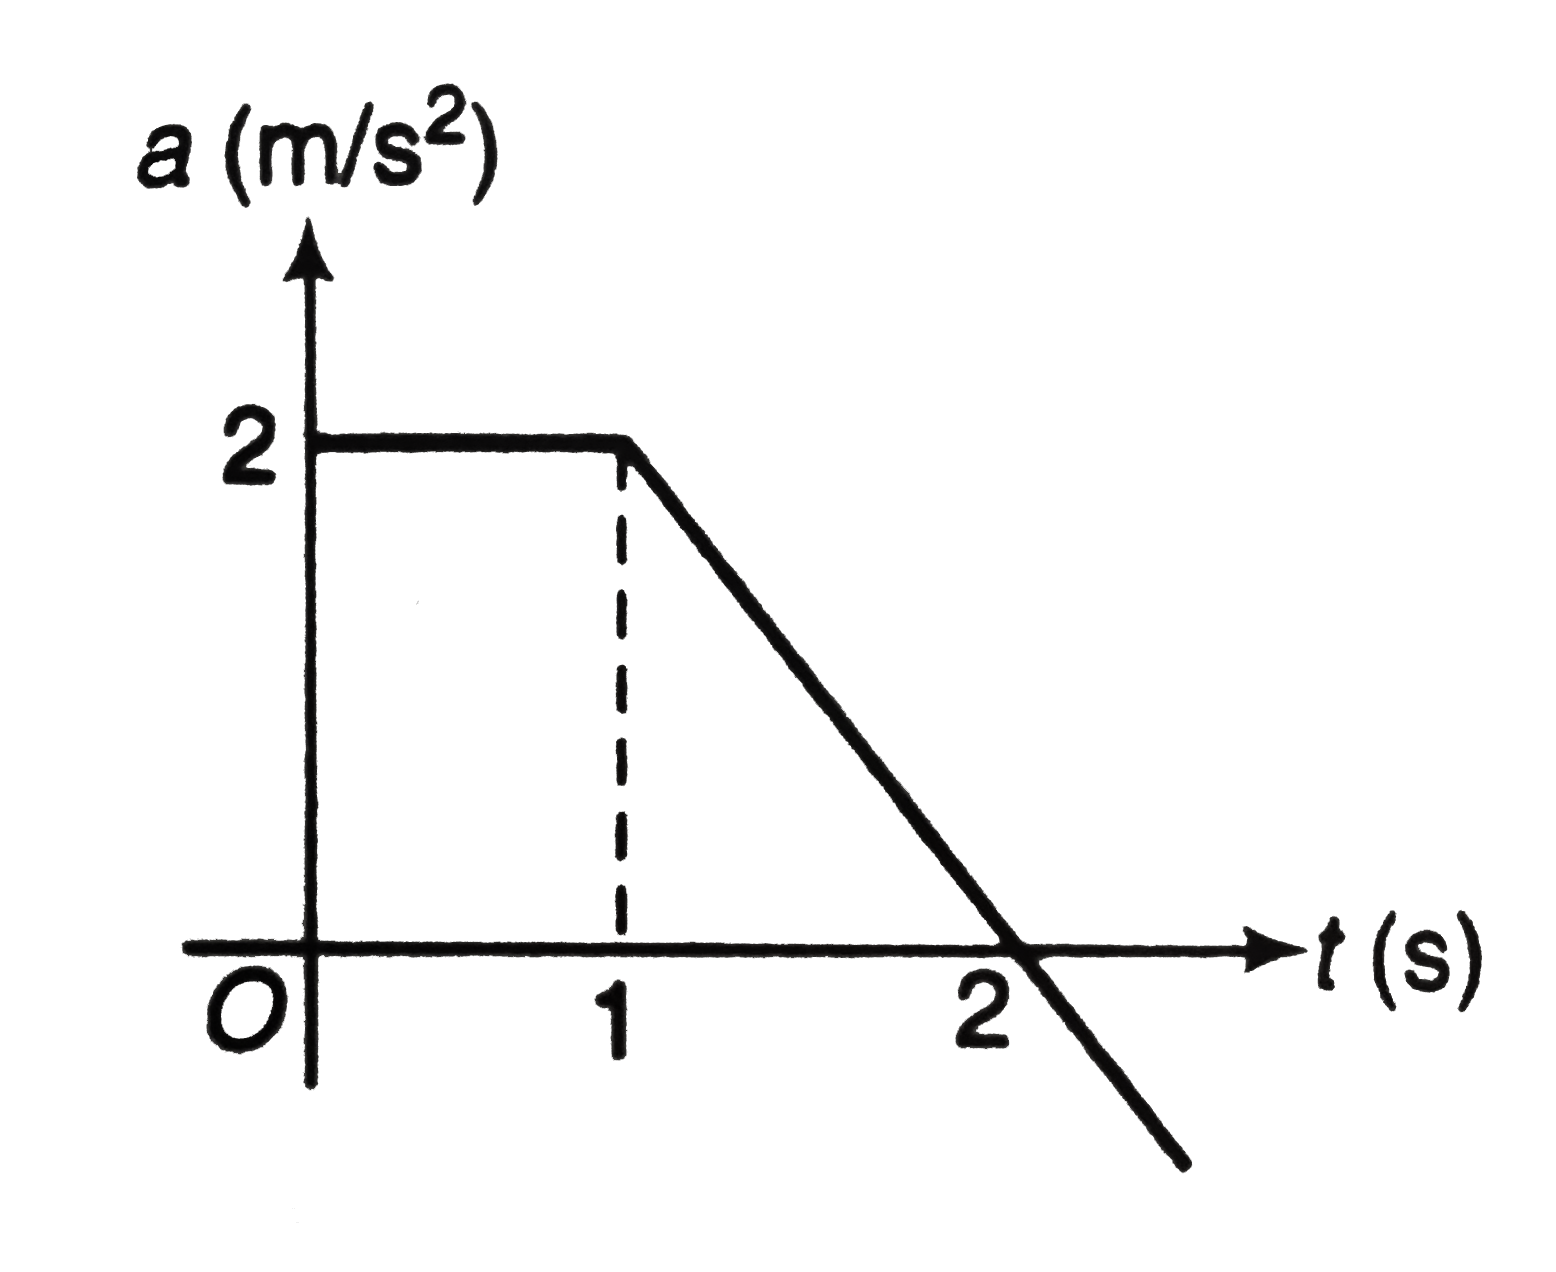
View SolutionFigure shows the acceleration-time graph of a particle moving along a straight line. After what time the particle acquires its initial velocity?
View Solution
