Which of the following is the graph showing stress-strain variation for elastomers ?
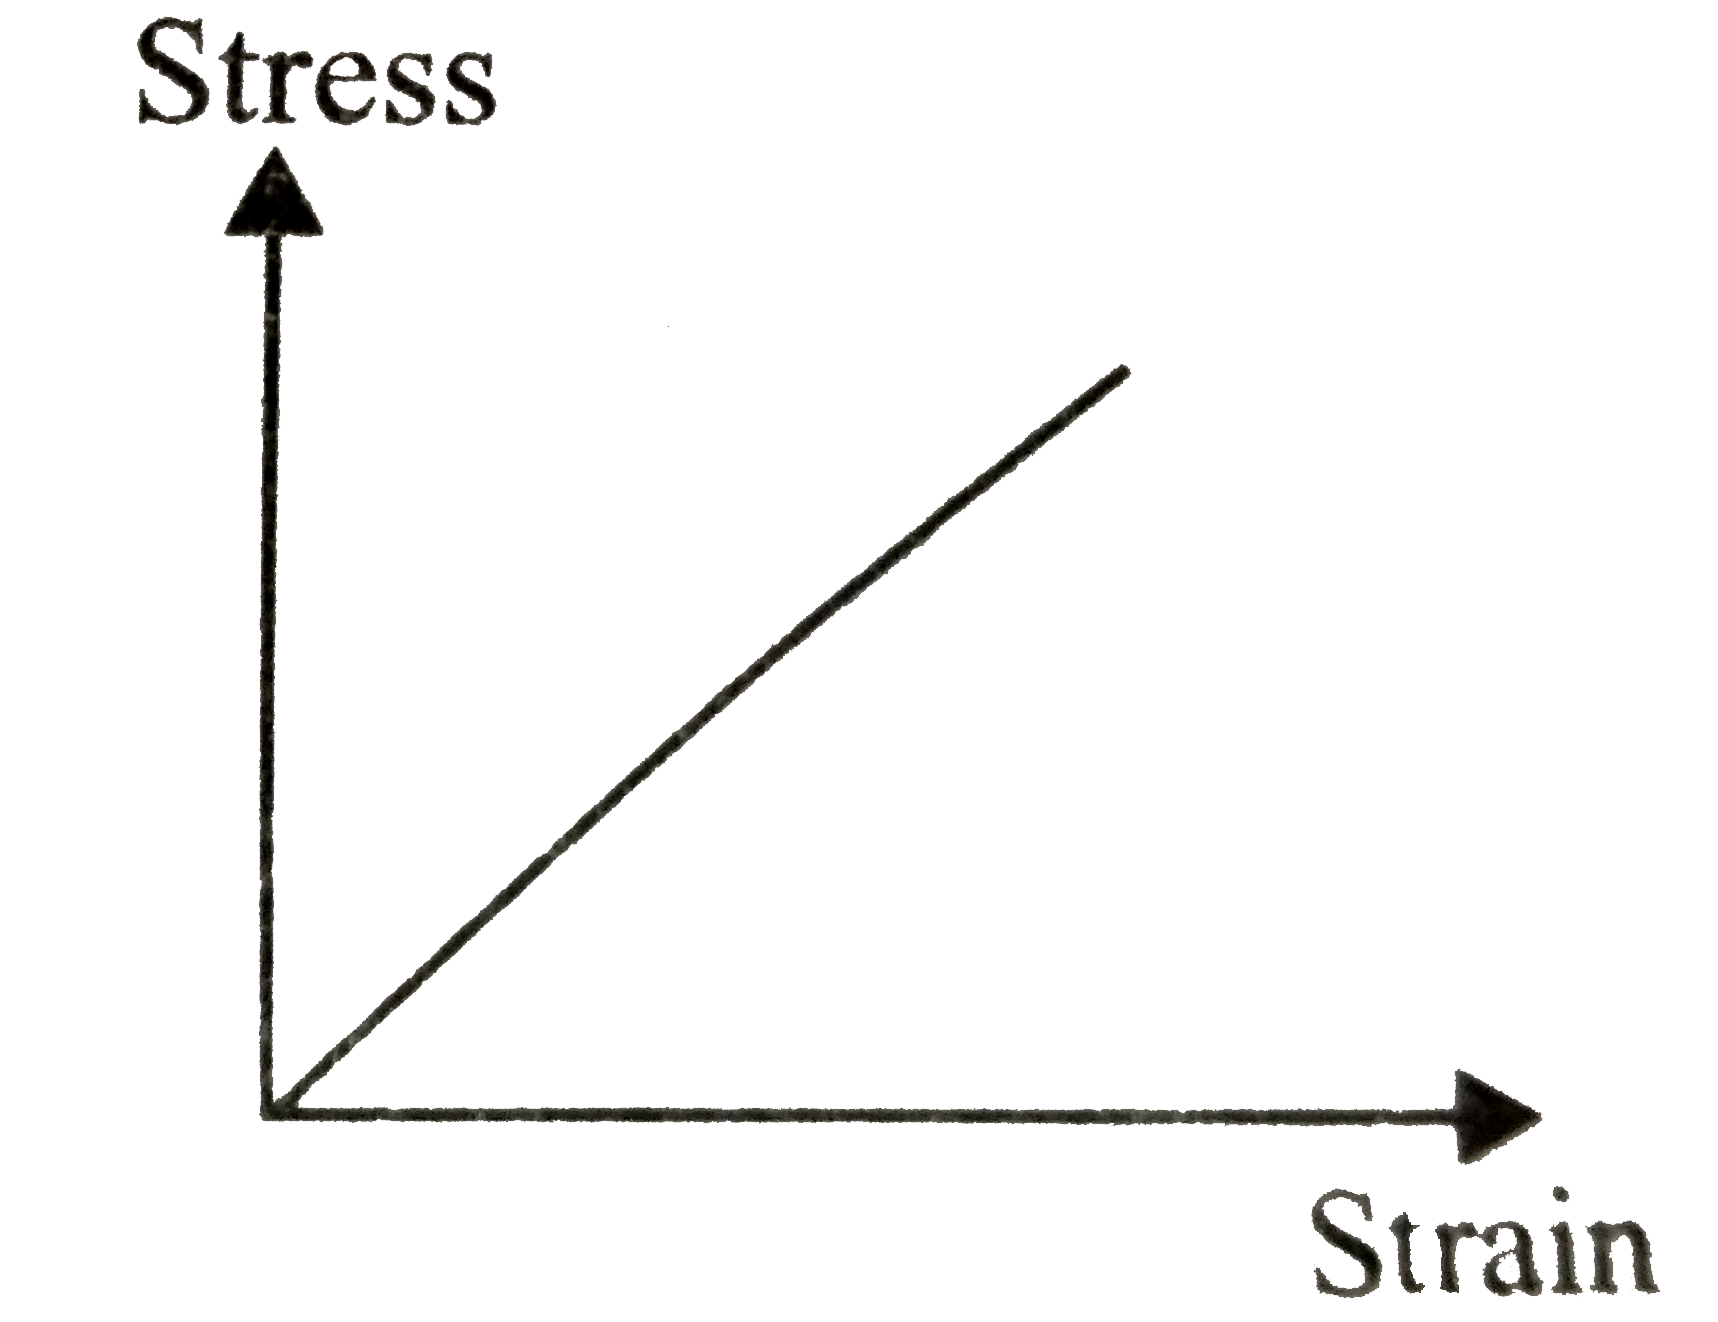
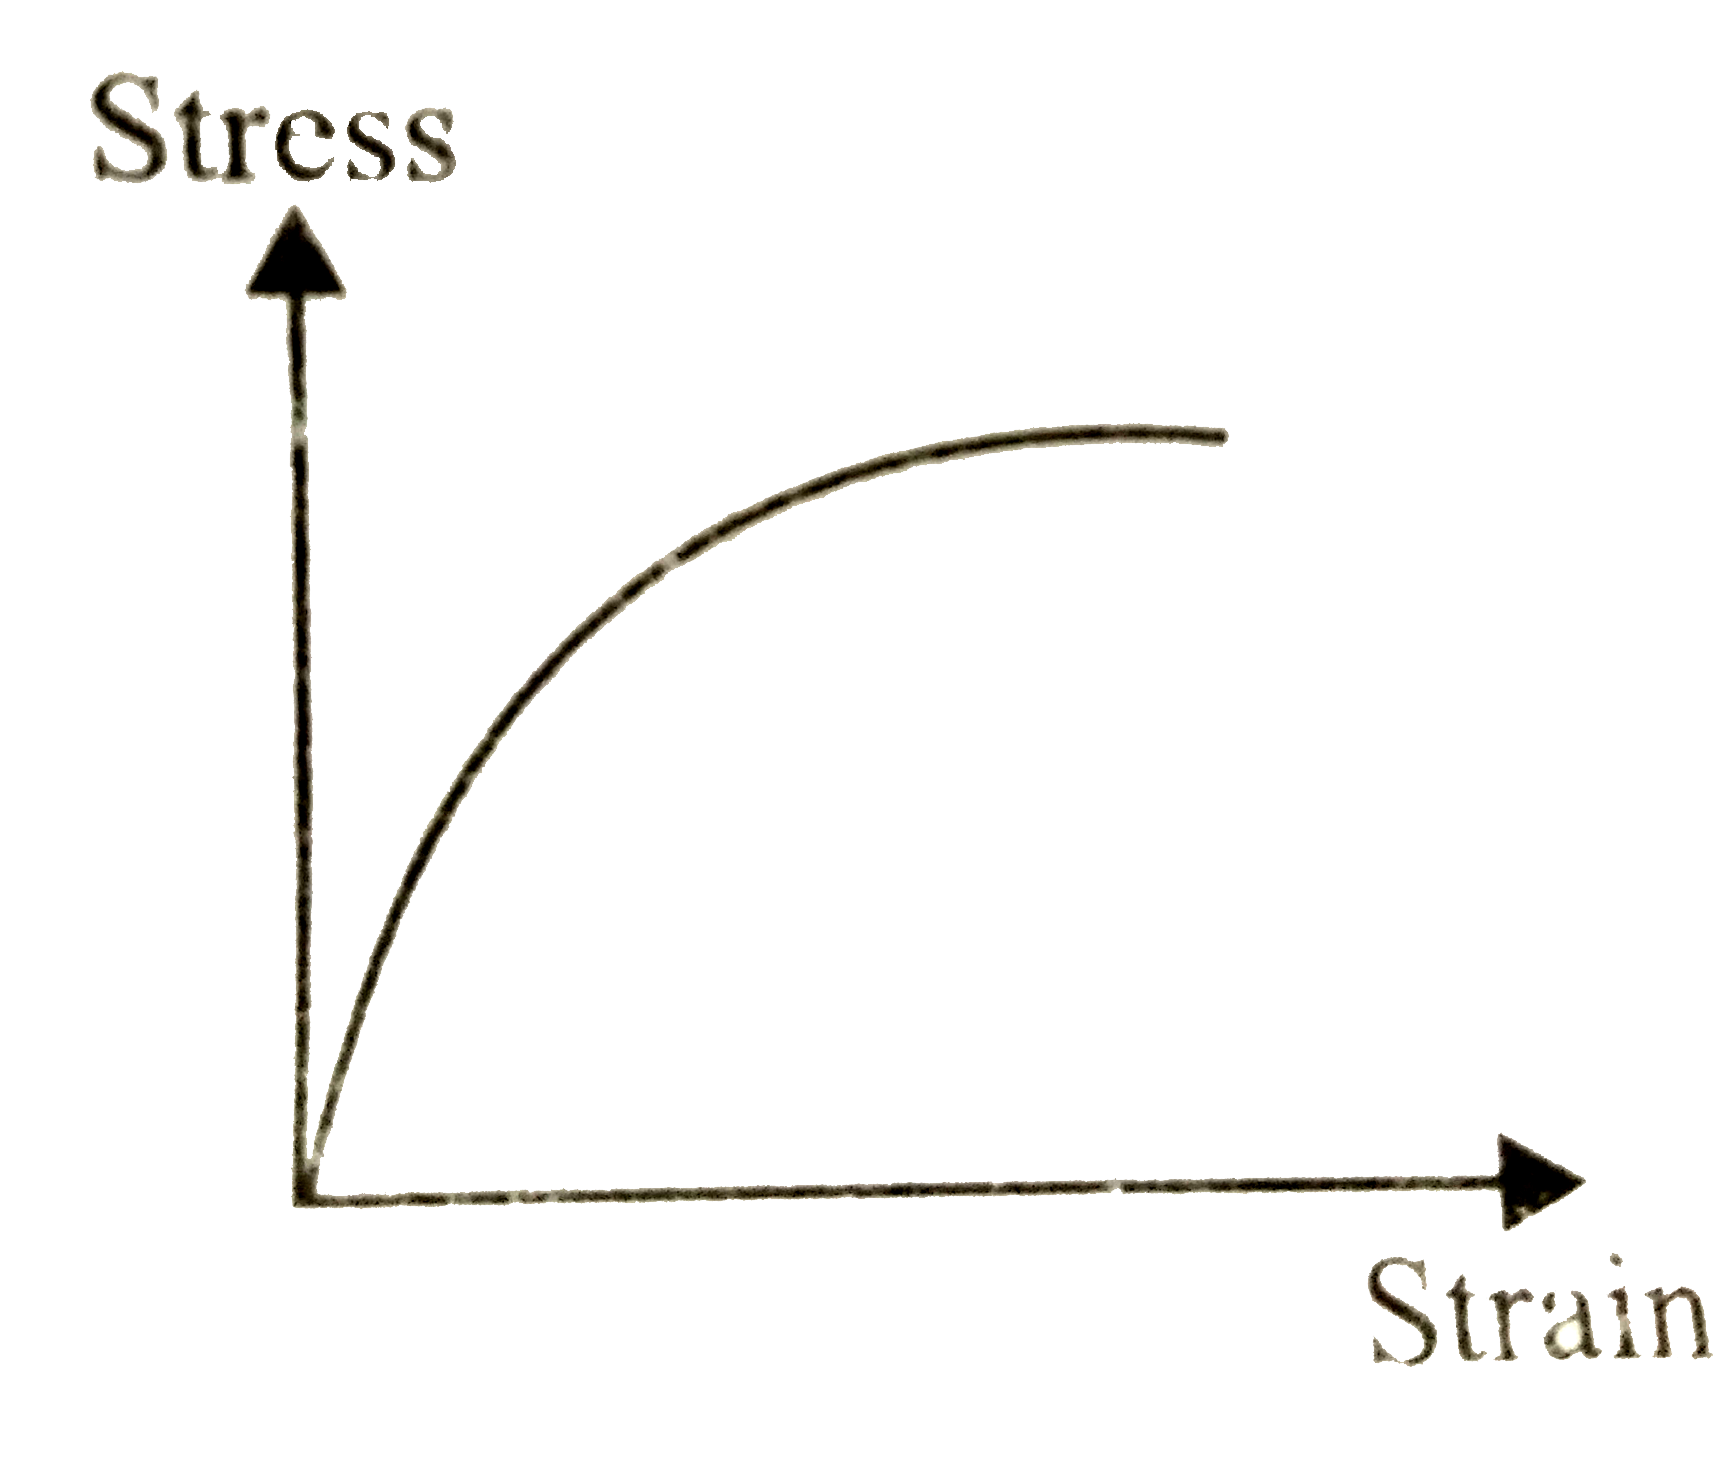
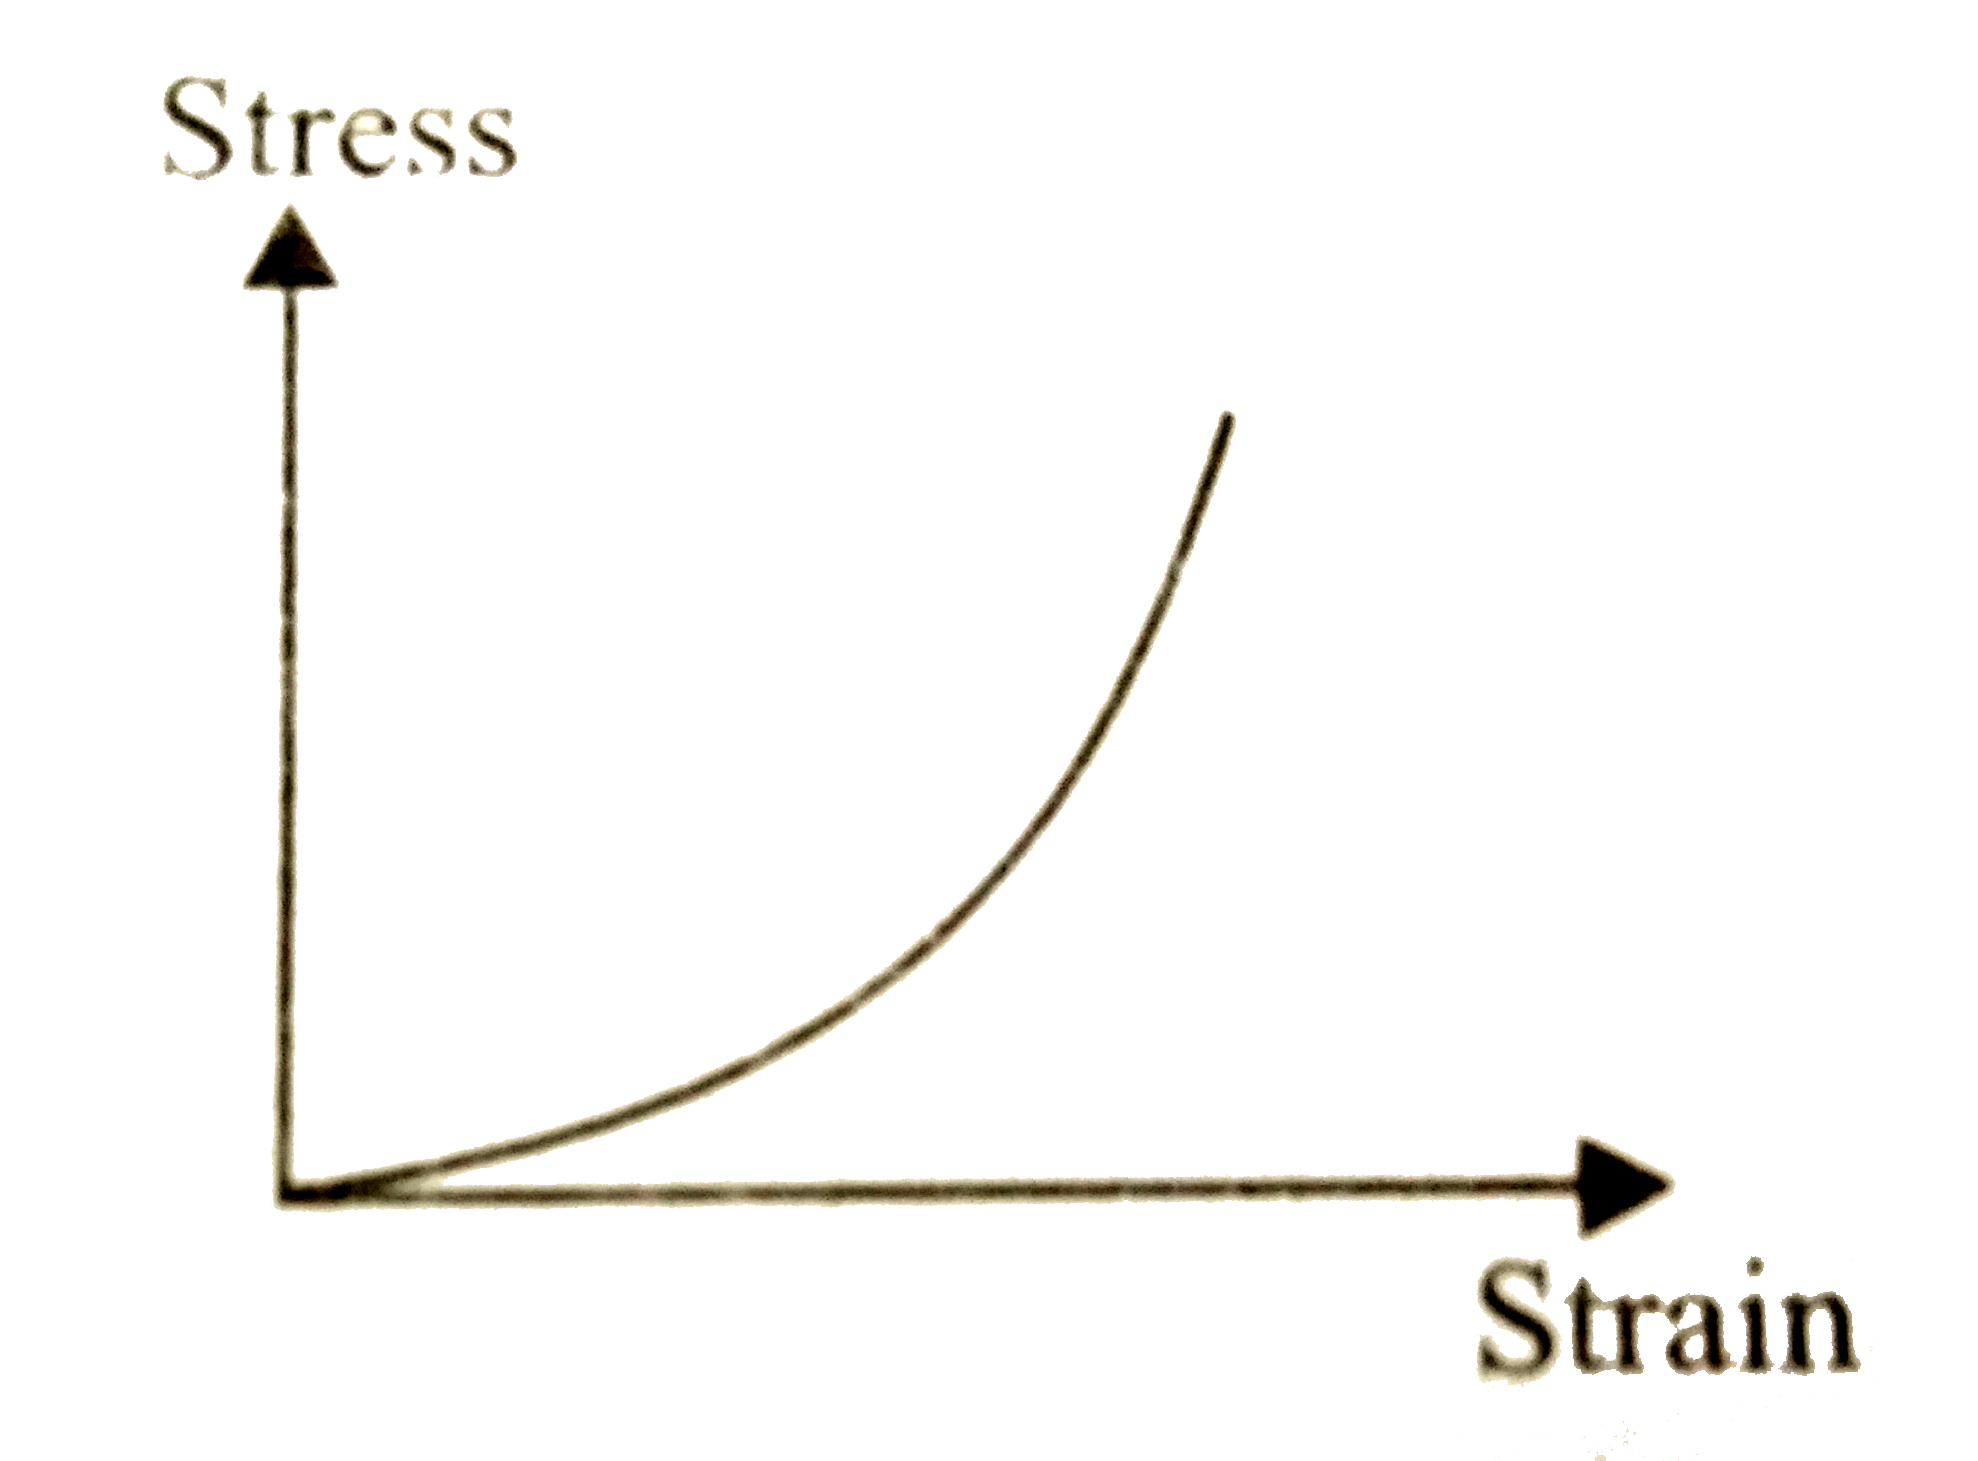
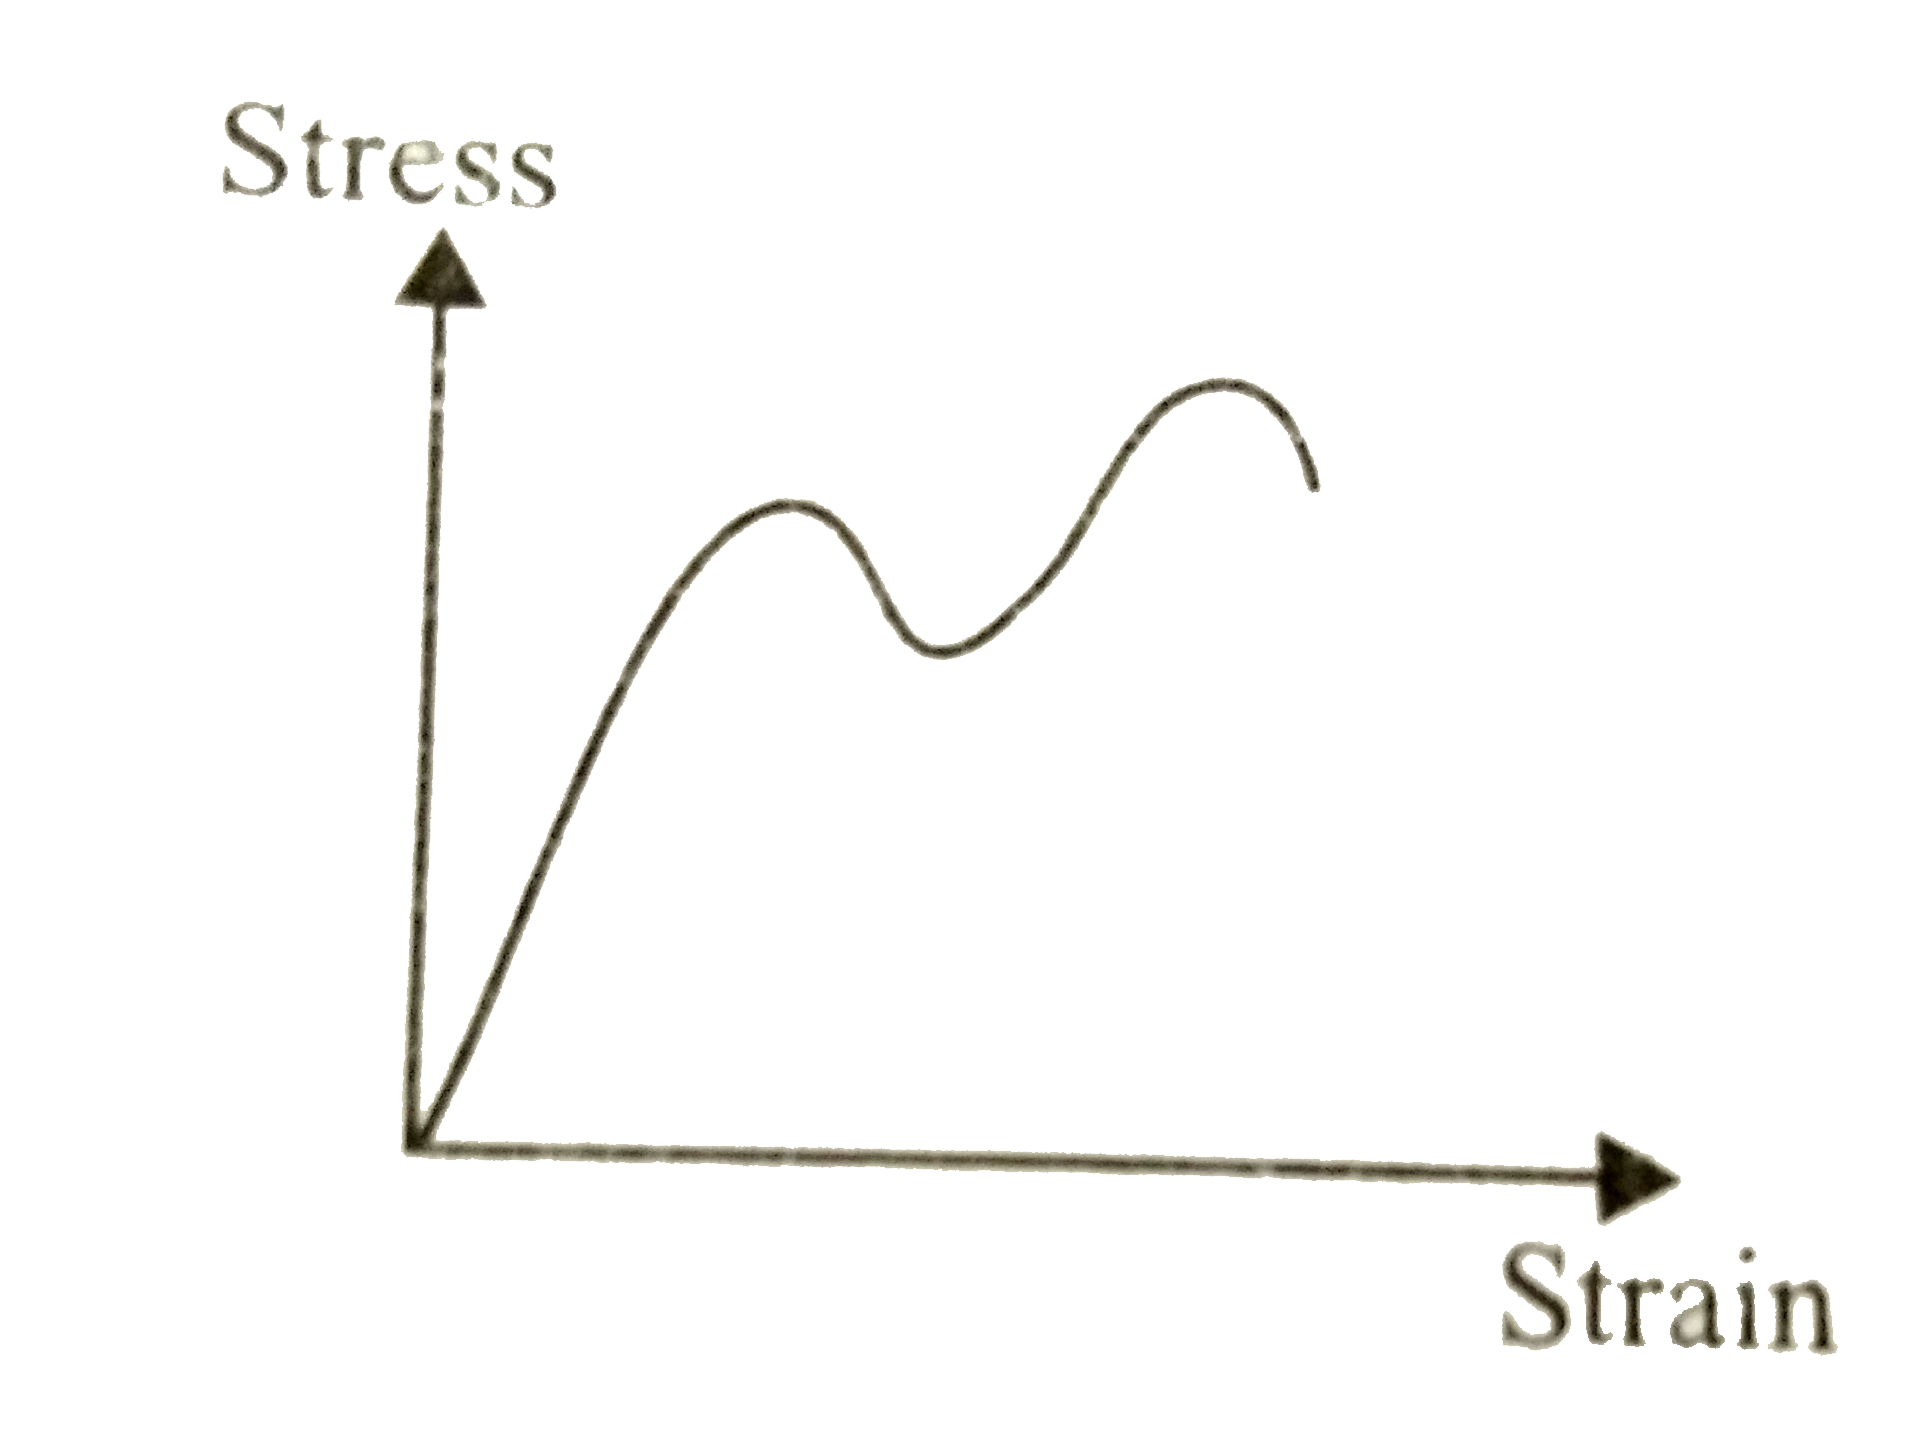
The correct Answer is:C
To determine which graph shows the stress-strain variation for elastomers, we need to understand the characteristics of elastomers. Here's a step-by-step solution:
Step 1: Understand Elastomers
Elastomers are materials that exhibit significant elasticity. When a small amount of stress is applied, they undergo a large amount of strain. This means that they can stretch or deform significantly without breaking.
Hint: Remember that elastomers are highly elastic materials, meaning they can stretch a lot with little applied stress.
Step 2: Analyze the Graphs
We will evaluate each graph based on the behavior of elastomers:
1. First Graph: Shows a linear relationship where stress and strain increase equally. This indicates a material that behaves like a solid, not an elastomer.
- Conclusion: Incorrect graph.
2. Second Graph: Shows that a small increase in stress leads to a large increase in strain. This is consistent with the behavior of elastomers.
- Conclusion: Potentially correct graph.
3. Third Graph: Similar to the first, it shows a less pronounced increase in strain with increasing stress. This suggests a stiffer material.
- Conclusion: Incorrect graph.
4. Fourth Graph: This graph also shows a linear relationship, indicating it is not representative of elastomers.
- Conclusion: Incorrect graph.
Step 3: Identify the Correct Graph
Based on the analysis, the second graph is the only one that accurately represents the stress-strain relationship for elastomers, where a small increase in stress results in a large increase in strain.
Final Answer: The correct graph showing stress-strain variation for elastomers is the second graph.
---
Elastomers are materials that exhibit significant elasticity. When a small amount of stress is applied, they undergo a large amount of strain. This means that they can stretch or deform significantly without breaking.
We will evaluate each graph based on the behavior of elastomers:
- Conclusion: Incorrect graph.
- Conclusion: Potentially correct graph.
- Conclusion: Incorrect graph.
- Conclusion: Incorrect graph.
Based on the analysis, the second graph is the only one that accurately represents the stress-strain relationship for elastomers, where a small increase in stress results in a large increase in strain.
Topper's Solved these Questions
- MECHANICAL PROPERTIES OF SOLIDSBOOK - NCERT FINGERTPS ENGLISHCHAPTER - MECHANICAL PROPERTIES OF SOLIDSEXERCISE - ELASTIC MODULI
69 Videos
- MECHANICAL PROPERTIES OF SOLIDSBOOK - NCERT FINGERTPS ENGLISHCHAPTER - MECHANICAL PROPERTIES OF SOLIDSEXERCISE - APPLICATIONS OF ELASTIC BEHAVIOUR OF MATERIALS
8 Videos
- MECHANICAL PROPERTIES OF SOLIDSBOOK - NCERT FINGERTPS ENGLISHCHAPTER - MECHANICAL PROPERTIES OF SOLIDSEXERCISE - HOOKE S LAW
3 Videos
- MECHANICAL PROPERTIES OF FLUIDSBOOK - NCERT FINGERTPS ENGLISHCHAPTER - MECHANICAL PROPERTIES OF FLUIDSEXERCISE - NCERT Exemplar
5 Videos
- MOTION IN A PLANE BOOK - NCERT FINGERTPS ENGLISHCHAPTER - MOTION IN A PLANE EXERCISE - Assertion And Reason
15 Videos
Similar Questions
Knowledge Check
The velocity -displacement graph of a particle is as shown in the figure. Which of the following graphs correctly represents the variation of acceleration with displacement?
 A
A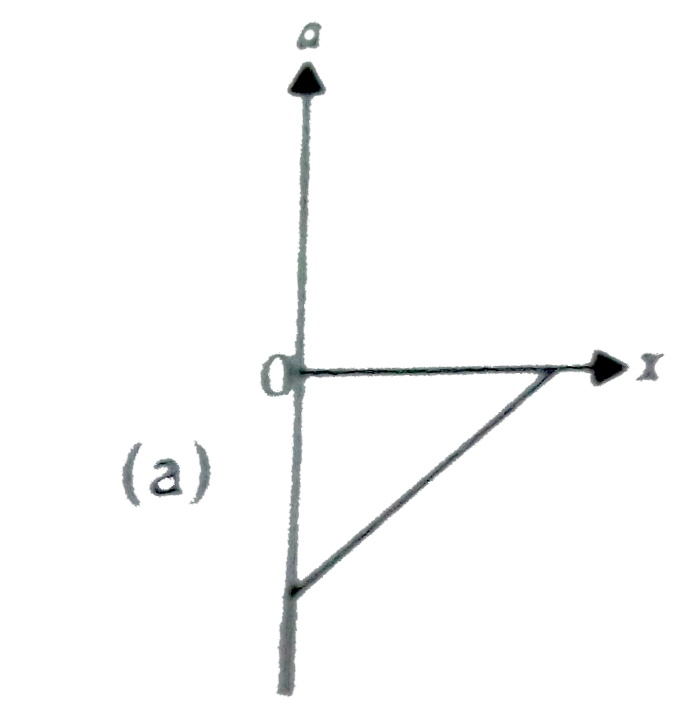 B
B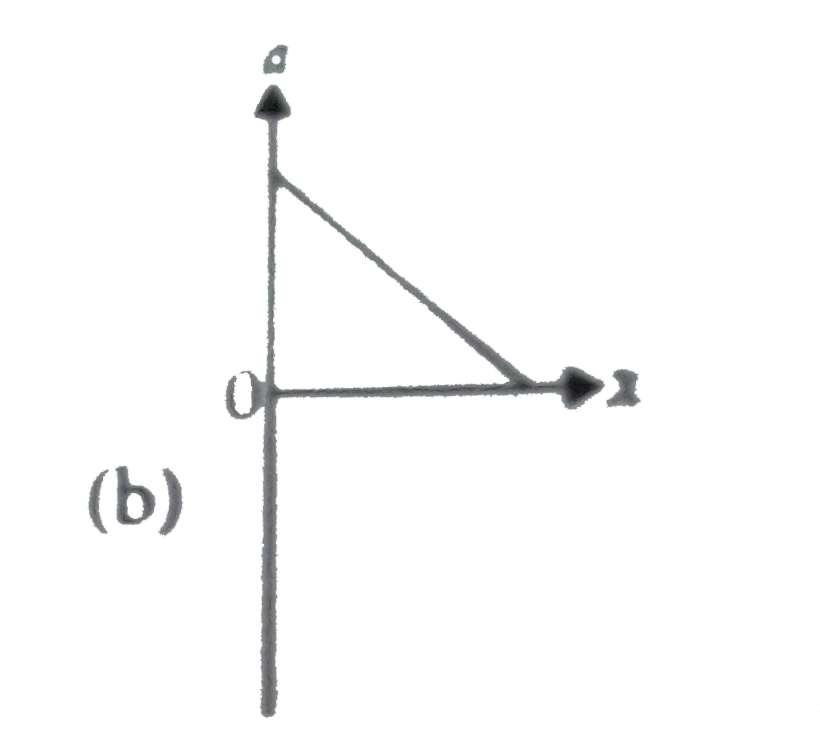 C
C D
D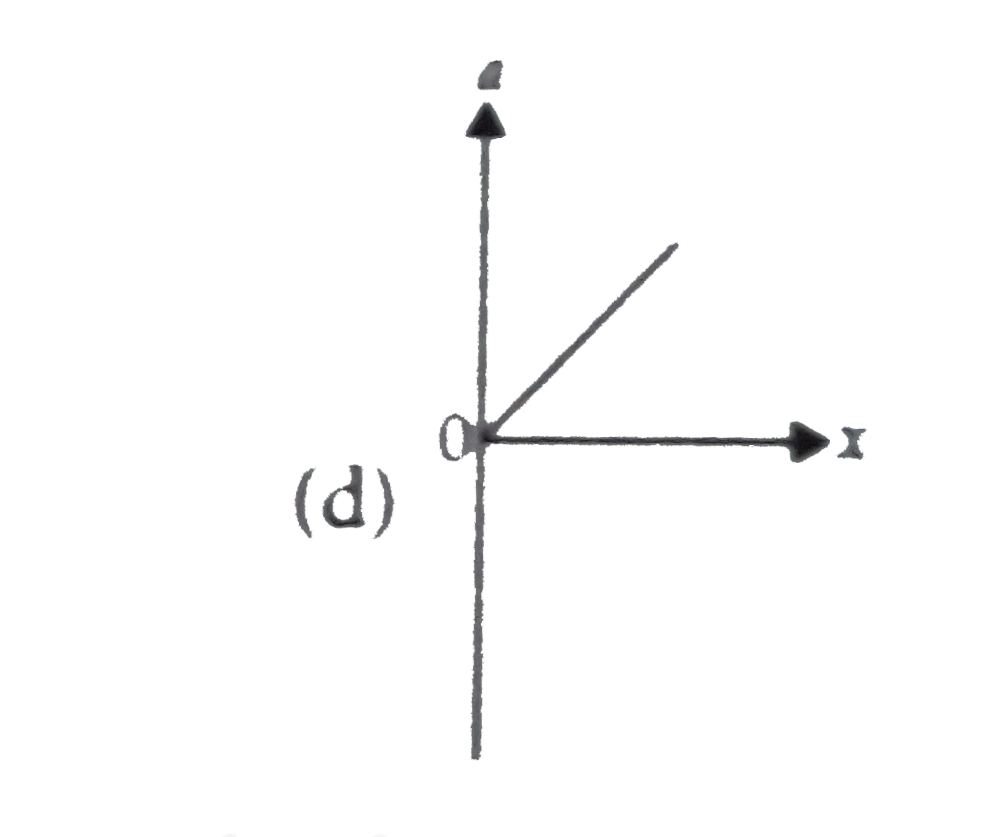
Which one of the following graphs in following figure represents variation of de Broglie wavelength (λ) of a particle having linear
A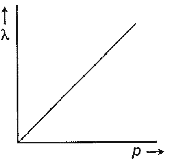 B
B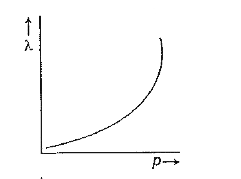 C
C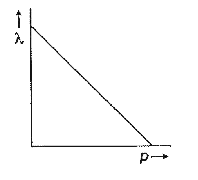 D
D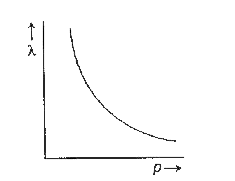
Which of the following is an elastomer?
View SolutionWhich of the following graphs shows the variation of acceleration due to gravity g with depth h from the surface of the earth ?
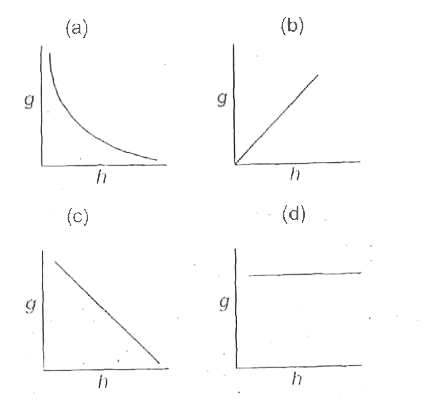
View SolutionThe graph shown the variation with times t of the velocity v of an object . Which one of the following graphs best represents the variation of acceleration a of the object with time t?

View SolutionWhich one of the following graphs in figure shows the variation of photoelectric current (I) with voltage (V) between the electrodes in a photoelectric cell?
View SolutionWhich one of the following shows crossing over and variations
View SolutionWhich of the following graphs best represents the variation of acceleration 'a' with displacement x?
View Solution
