Which of the following graphs best represents the variation of acceleration 'a' with displacement x?
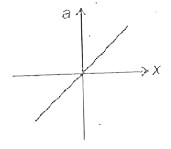

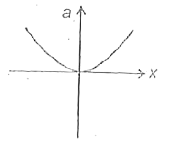

The correct Answer is:B
To determine which graph best represents the variation of acceleration 'a' with displacement 'x' for a body performing Simple Harmonic Motion (SHM), we can follow these steps:
Step 1: Understand the relationship between acceleration and displacement in SHM
In SHM, the acceleration 'a' is directly related to the displacement 'x' from the equilibrium position. The formula for acceleration in SHM is given by:
a=−ω2x
where ω is the angular frequency.
Step 2: Analyze the equation
From the equation a=−ω2x, we can see that:
- The acceleration 'a' is proportional to the displacement 'x'.
- The negative sign indicates that the acceleration is directed opposite to the displacement. This means that when the displacement is positive (to the right of the equilibrium), the acceleration is negative (to the left), and vice versa.
Step 3: Identify the graph characteristics
The equation a=−ω2x represents a linear relationship between 'a' and 'x'. Specifically:
- It is a straight line with a slope of −ω2.
- The graph will pass through the origin (0,0) because when x=0, a=0.
- The line will slope downwards from left to right due to the negative slope.
Step 4: Choose the correct graph
Based on the characteristics identified:
- The correct graph will be a straight line that starts at the origin and slopes downwards.
- This corresponds to option (b) in the provided choices.
Conclusion
Thus, the graph that best represents the variation of acceleration 'a' with displacement 'x' is option (b).
---
In SHM, the acceleration 'a' is directly related to the displacement 'x' from the equilibrium position. The formula for acceleration in SHM is given by:
a=−ω2x
where ω is the angular frequency.
From the equation a=−ω2x, we can see that:
- The acceleration 'a' is proportional to the displacement 'x'.
- The negative sign indicates that the acceleration is directed opposite to the displacement. This means that when the displacement is positive (to the right of the equilibrium), the acceleration is negative (to the left), and vice versa.
The equation a=−ω2x represents a linear relationship between 'a' and 'x'. Specifically:
- It is a straight line with a slope of −ω2.
- The graph will pass through the origin (0,0) because when x=0, a=0.
- The line will slope downwards from left to right due to the negative slope.
Based on the characteristics identified:
- The correct graph will be a straight line that starts at the origin and slopes downwards.
- This corresponds to option (b) in the provided choices.
Thus, the graph that best represents the variation of acceleration 'a' with displacement 'x' is option (b).
Topper's Solved these Questions
- OSCILLATIONSBOOK - AAKASH INSTITUTE ENGLISHCHAPTER - OSCILLATIONSEXERCISE - Assignment (Section - B) (OBJECTIVE TYPE QUESTIONS)
30 Videos
- OSCILLATIONSBOOK - AAKASH INSTITUTE ENGLISHCHAPTER - OSCILLATIONSEXERCISE - Assignment (Section C) (PREVIOUS YEARS QUESTIONS)
43 Videos
- OSCILLATIONSBOOK - AAKASH INSTITUTE ENGLISHCHAPTER - OSCILLATIONSEXERCISE - Exercise
18 Videos
- NUCLEIBOOK - AAKASH INSTITUTE ENGLISHCHAPTER - NUCLEIEXERCISE - ASSIGNMENT (SECTION-D)
10 Videos
- PHYSICAL WORLDBOOK - AAKASH INSTITUTE ENGLISHCHAPTER - PHYSICAL WORLDEXERCISE - ASSIGNMENT (Section-B)
4 Videos
Similar Questions
The velocity v of a particle moving along x - axis varies with ist position (x) as v=α√x, where α is a constant. Which of the following graph represents the variation of its acceleration (a) with time (t)?
View SolutionThe graph shown the variation with times t of the velocity v of an object . Which one of the following graphs best represents the variation of acceleration a of the object with time t?

View Solution
Knowledge Check
The velocity -displacement graph of a particle is as shown in the figure. Which of the following graphs correctly represents the variation of acceleration with displacement?
 A
A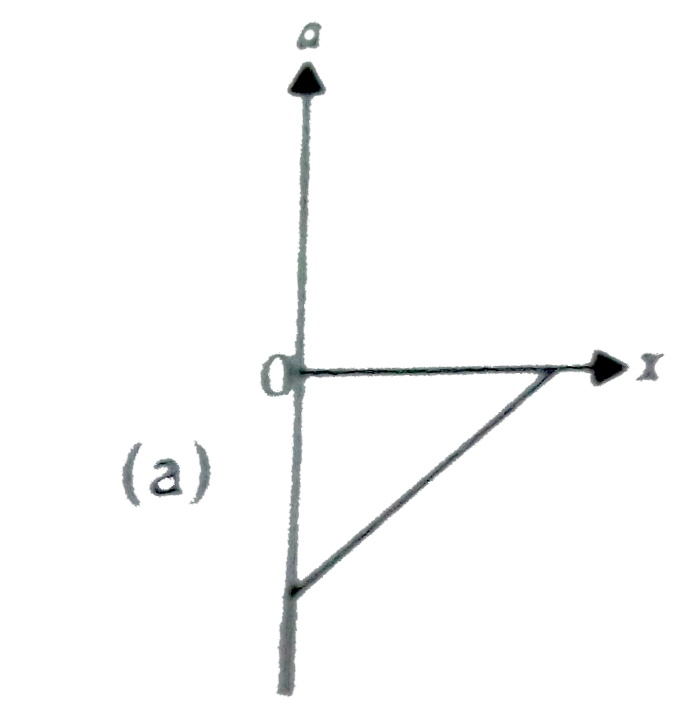 B
B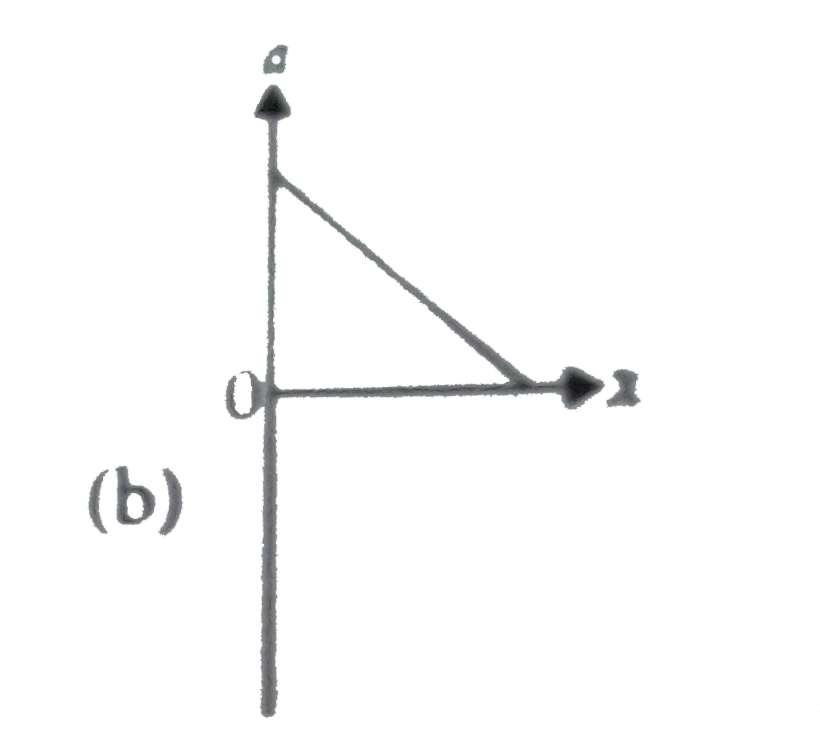 C
C D
D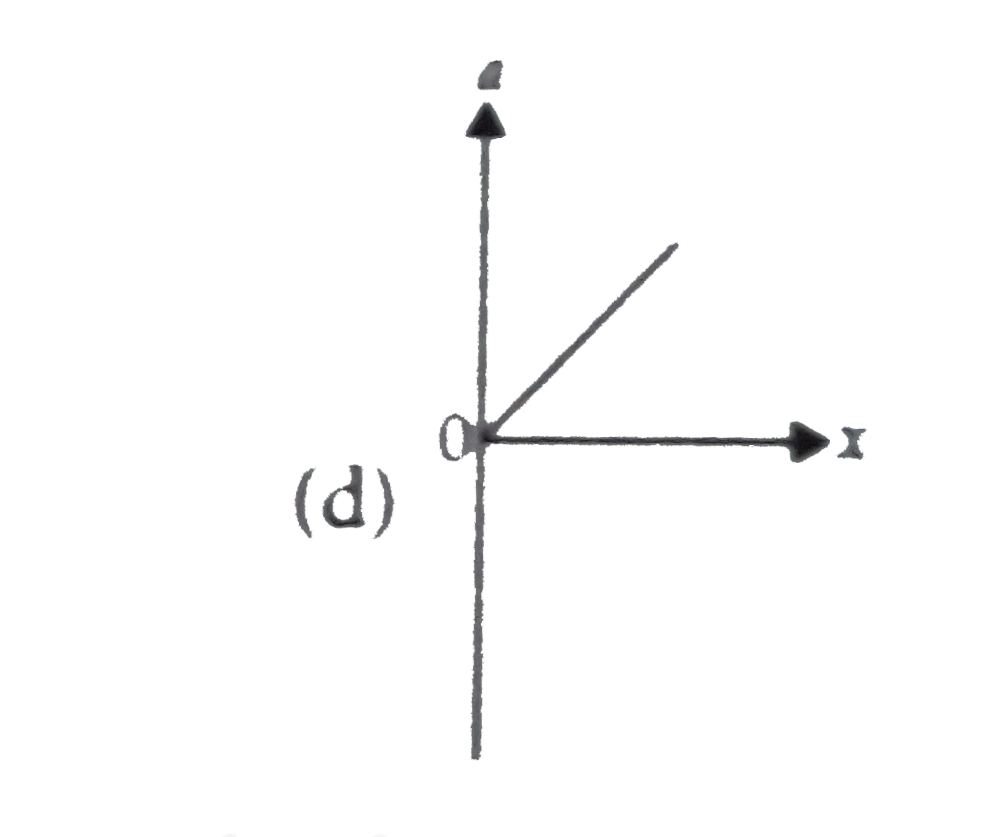
Within elastic limit, which of the following graphs correctly represents the variation of extension in the length of wire with the external load?
A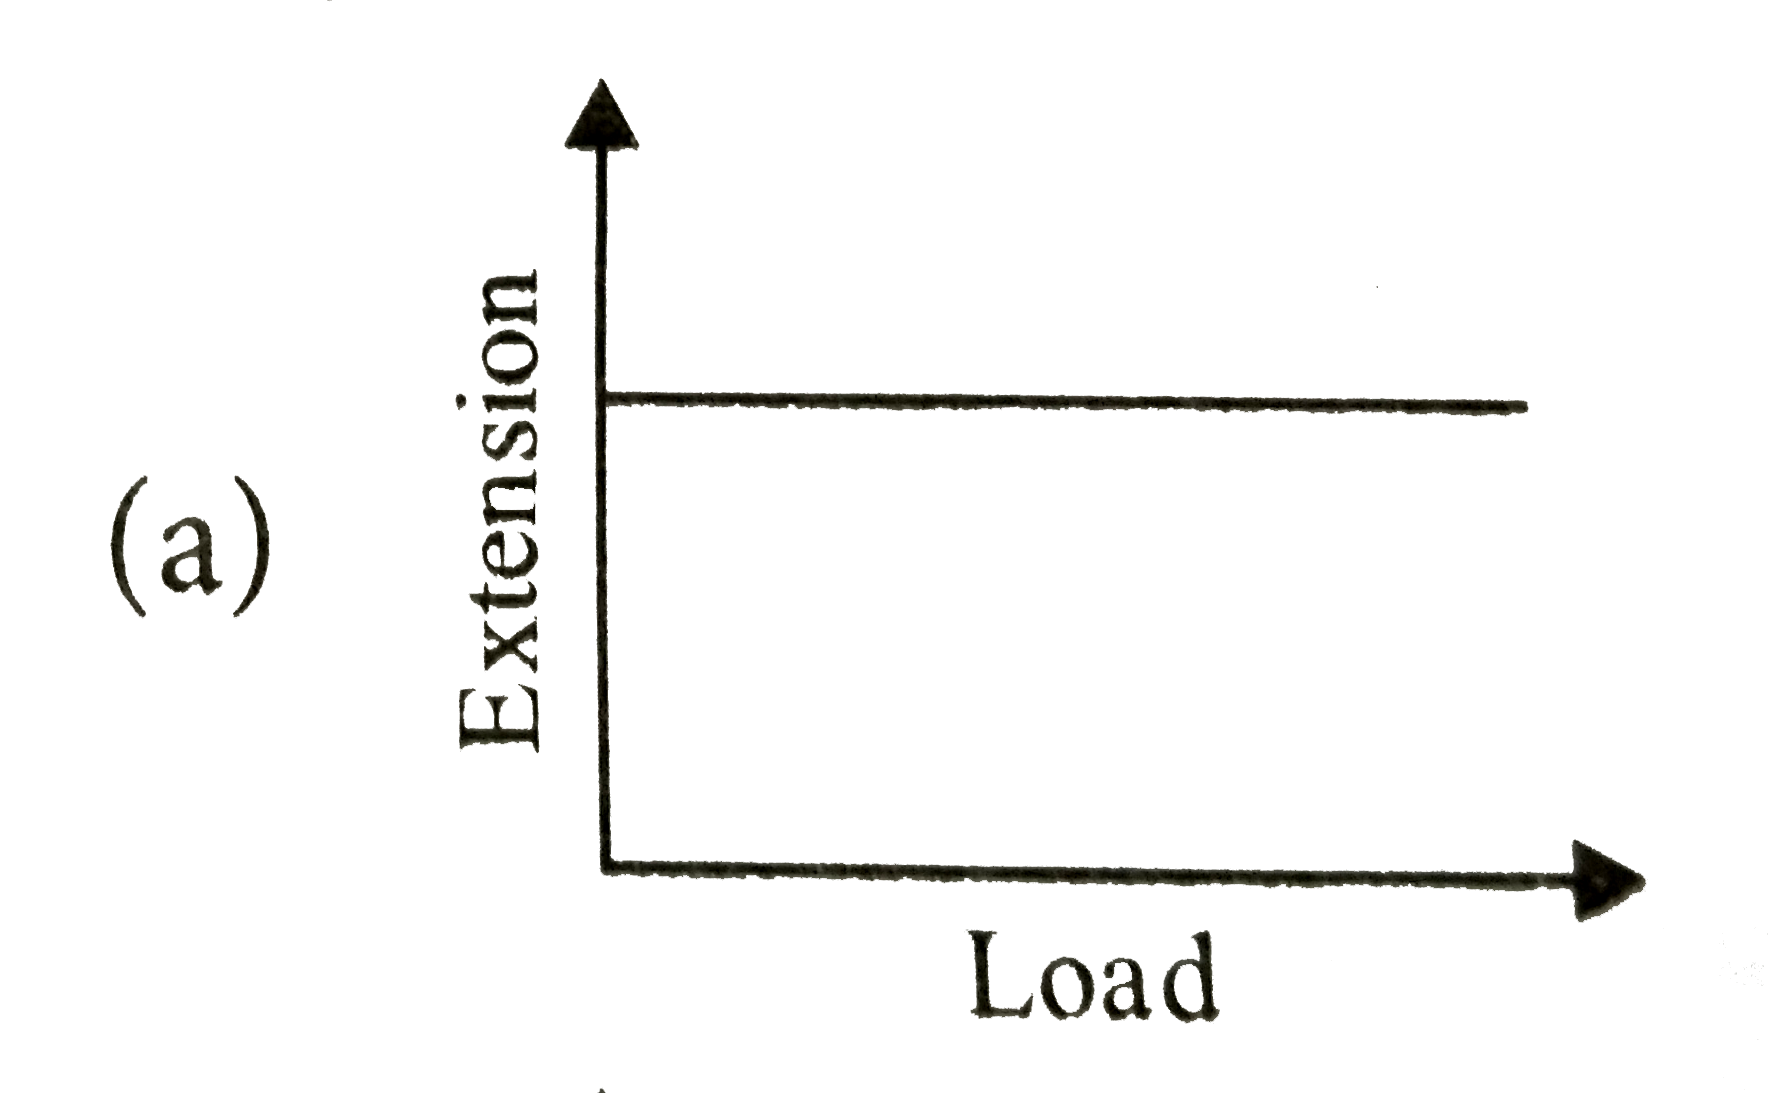 B
B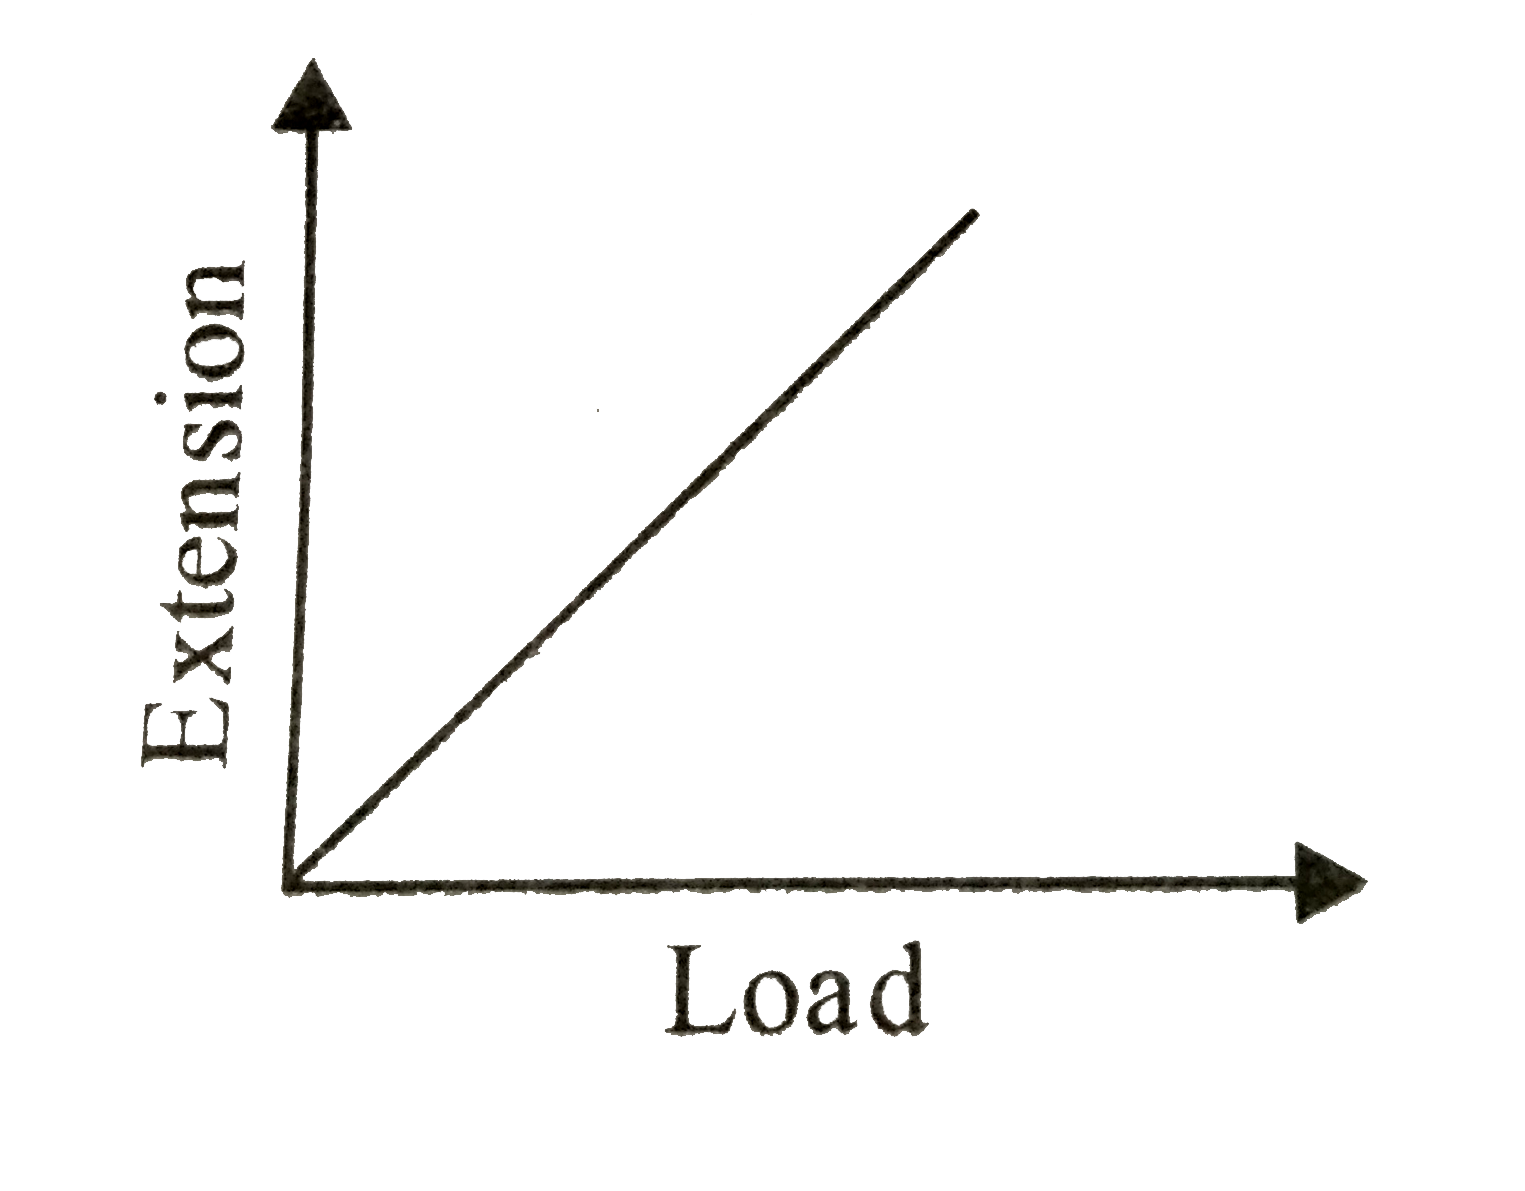 C
C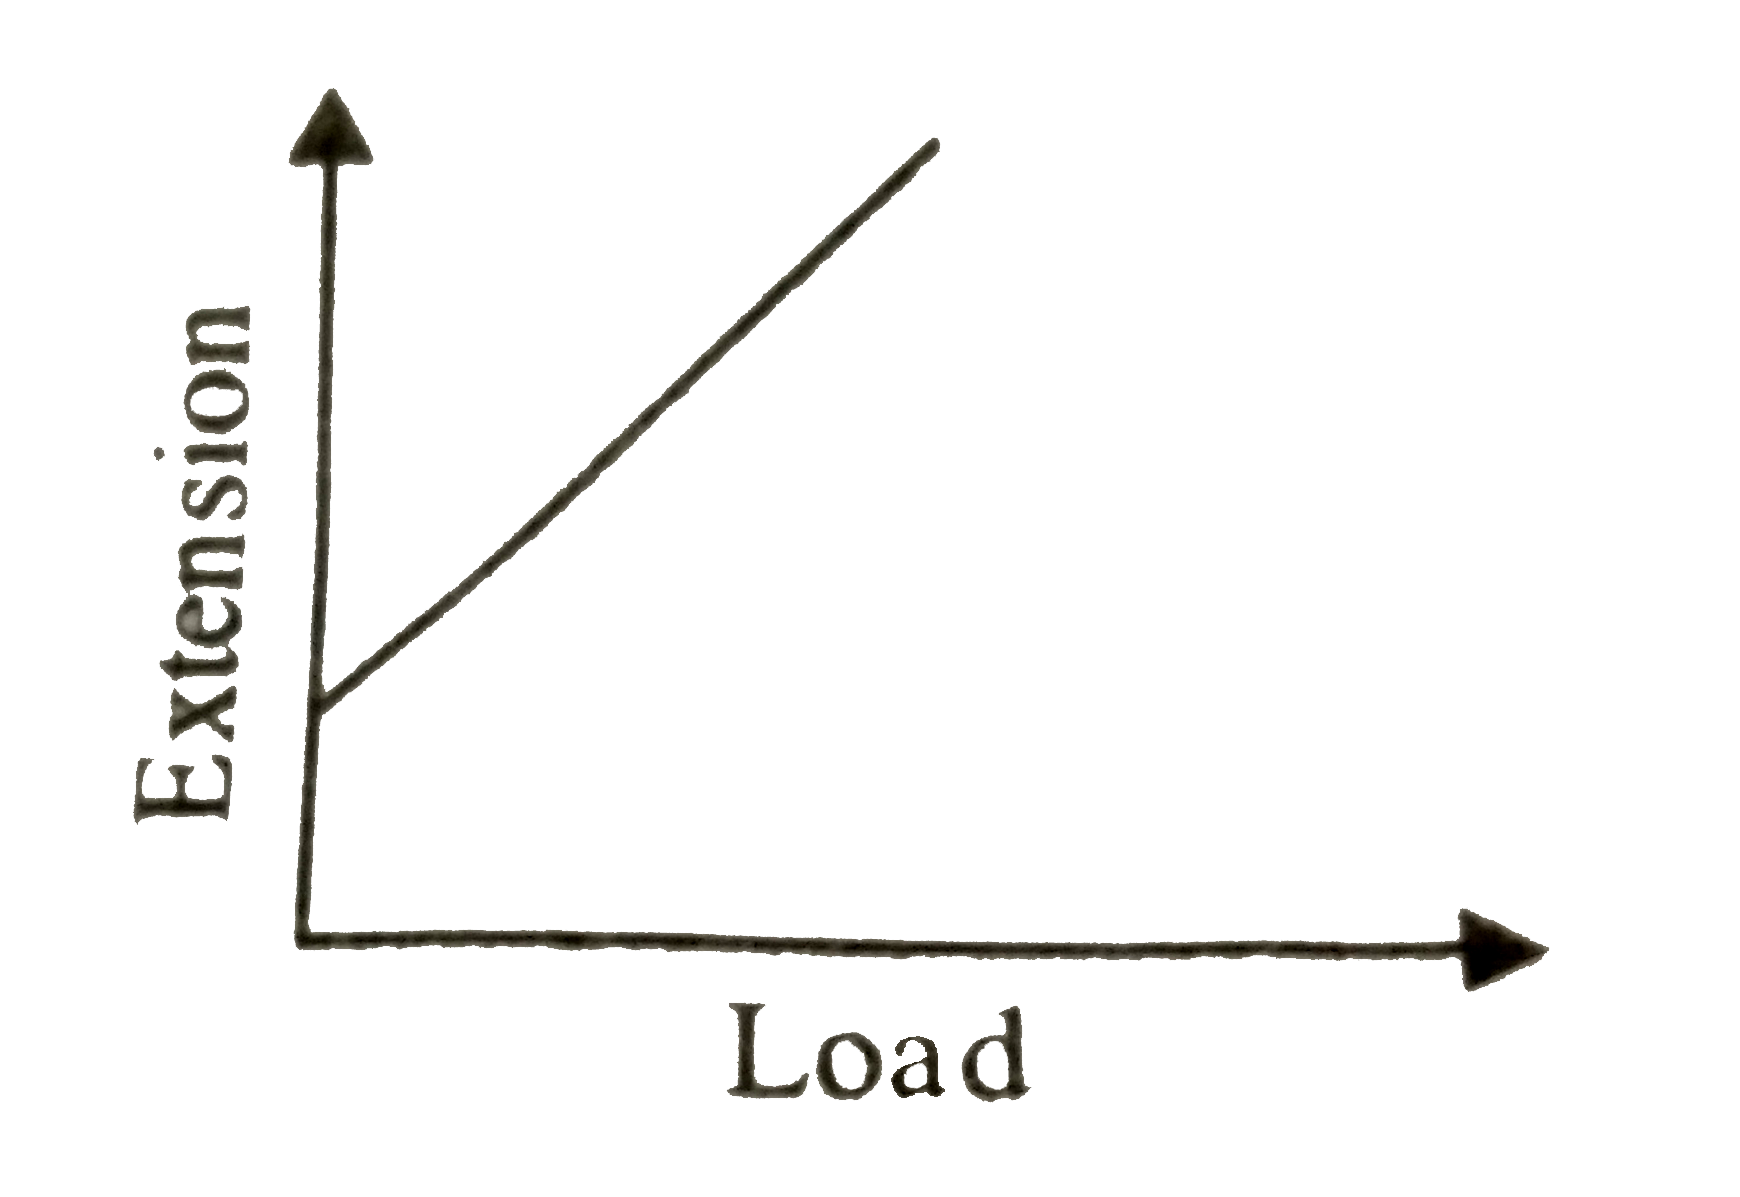 D
D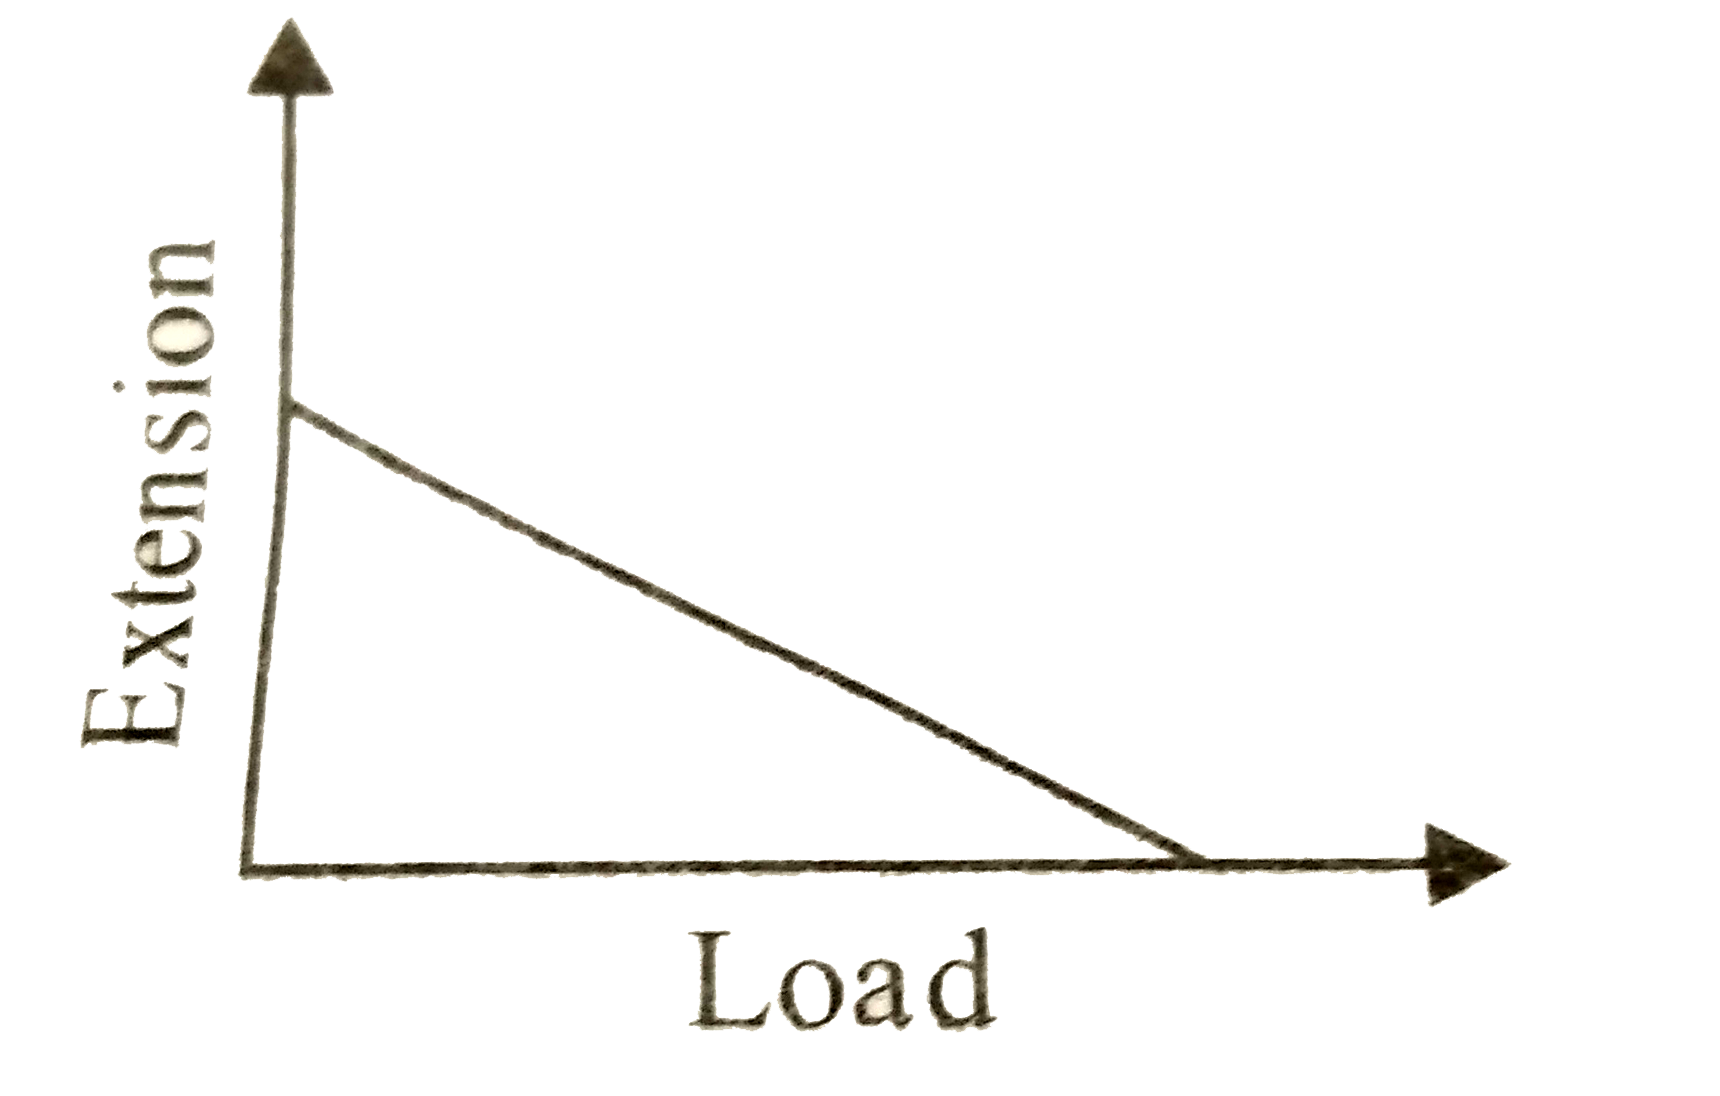
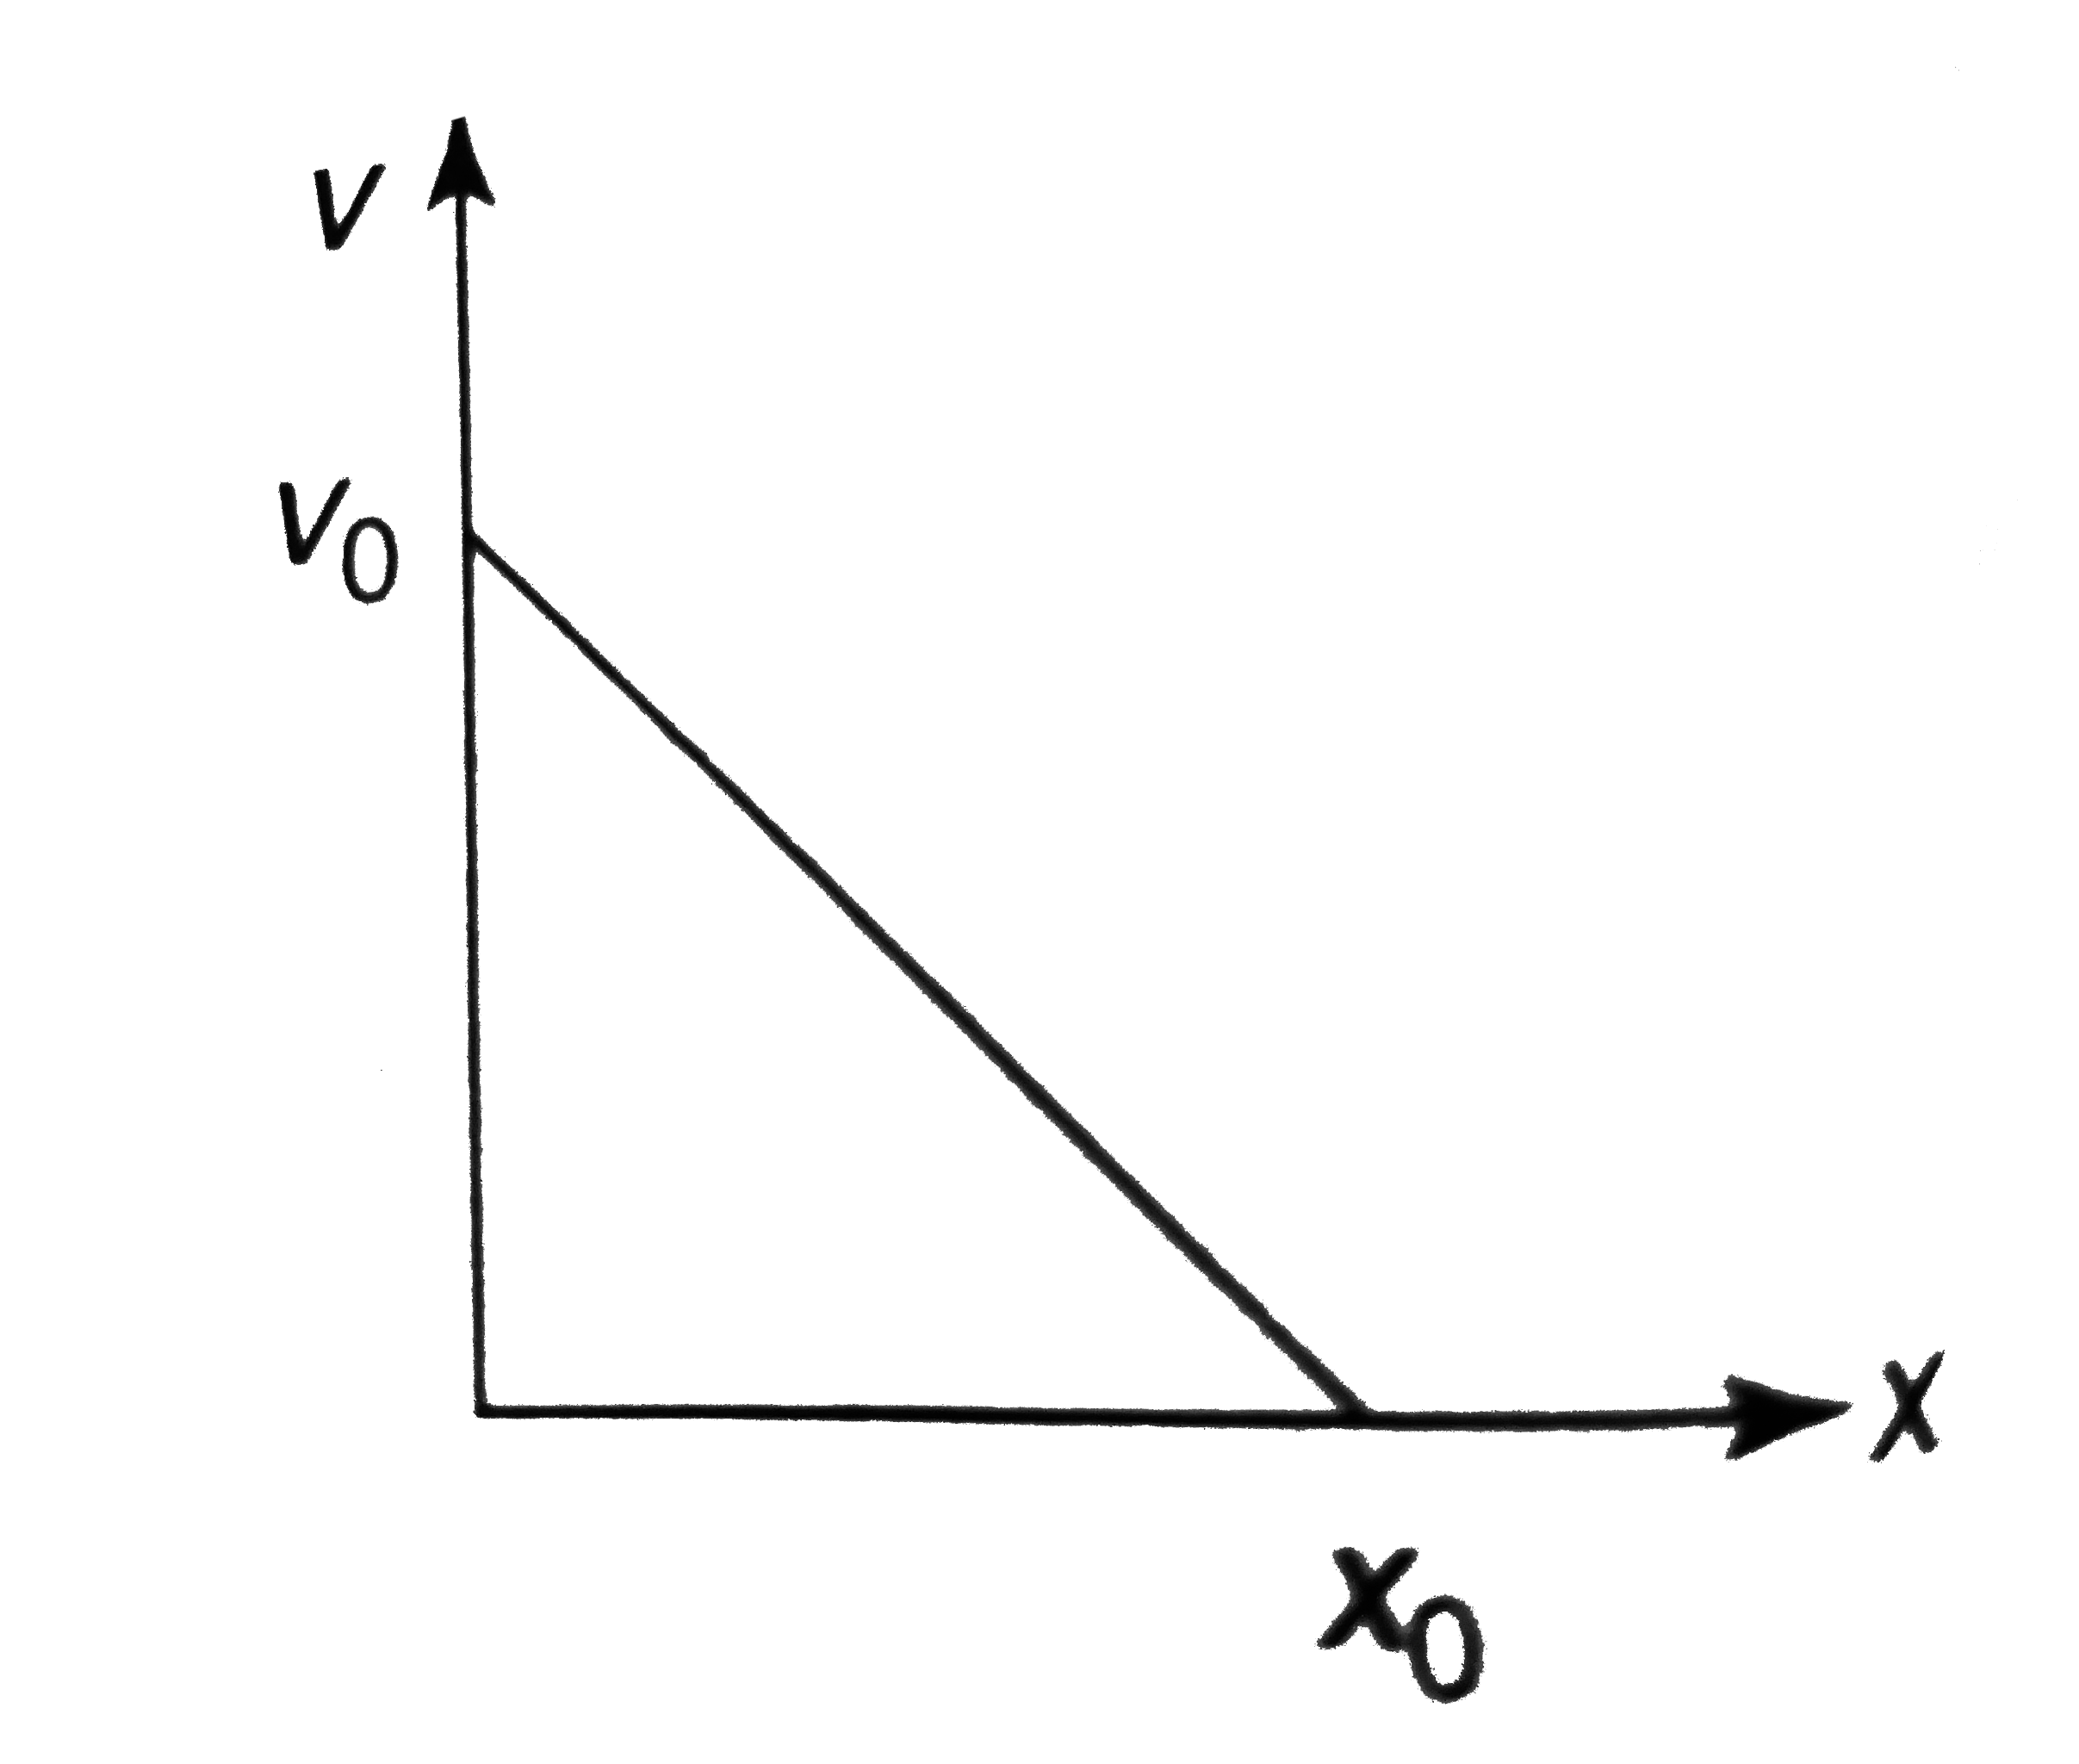
The given graph shows the variation of velocity with displacement. Which one of the graph given below correctly represents the variation of acceleration with displacement :-
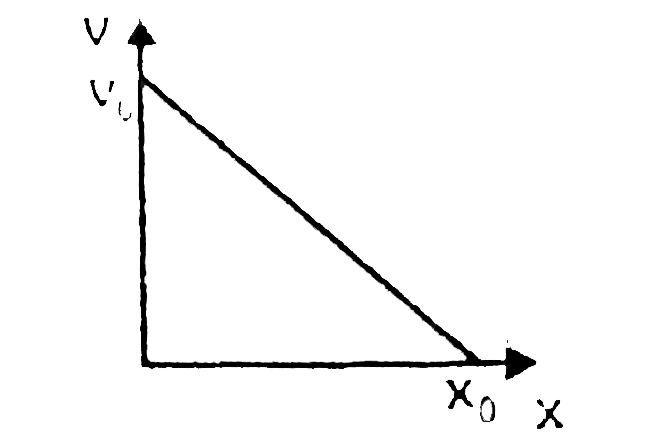
View SolutionThe given graph shows the variation of velocity with displacement. Which one of the graphs given below correctly represents the variation of acceleration with displacement ?
View SolutionWhich of the following graphs correctly represents the variation of g on the - Earth?
View SolutionFour point charges are kept on y-axis at (0,a),(0,2a),(0,−a)and(0,−2a) as shown in the figure. Which of the following graphs, best represents the variation of electrostatic potential V as a function of distance x from the origin, on the x-axis.

View SolutionA body moves from rest with a constant acceleration. Which one of the following graphs represents the variation of its kinetic energy K with the distance travelled x?
View SolutionA body moves from rest with a constant acceleration. Which one of the following graphs represents the variation of its kinetic energy K with the distance travelled x?
View Solution