Which one is the correct graph which gives the variation of magnetic susceptibility (x) with tempperature for a diamagnetic substacne?
A

B

C

D

Text Solution
The correct Answer is:C
For a diamagnetic substance the susceptibility is vbery lsmall and it is negative similarly it does not depen d upon the temperature Graph (c ) correctly repersents the variation In (B) x is +ve
|
Topper's Solved these Questions
- MAGNETISM Book:MARVEL PUBLICATIONChapter:MAGNETISM Exercise:TEST YOUR GRASP
Explore 15 Videos
- MAGNETIC EFFECTS OF ELECTRIC CURRENTBook:MARVEL PUBLICATIONChapter:MAGNETIC EFFECTS OF ELECTRIC CURRENTExercise:MCQ
Explore 195 Videos
- OSCILLATIONSBook:MARVEL PUBLICATIONChapter:OSCILLATIONSExercise:MCQ
Explore 368 Videos
Similar Questions
Knowledge Check
The correct graph which shows the variation of paramagnetic susceptibility S with temperature T is
A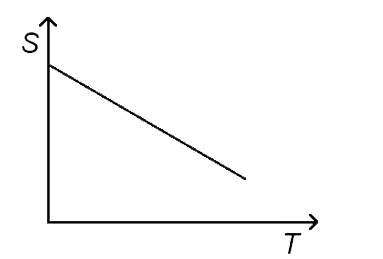 B
B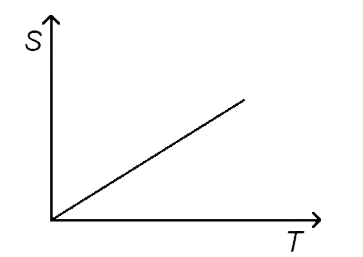 C
C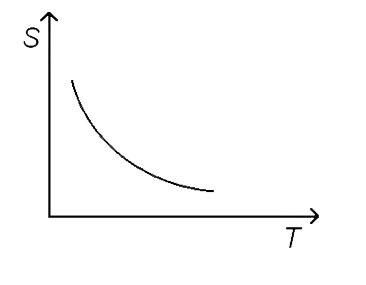 D
D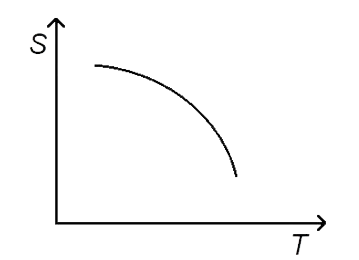
The variation of magnetic susceptibility (χ) with temperature for a diamagnetic substance is best represented by
A B
B C
C D
D
The variation of magnetic susceptibility (χ) with temperature for a diamagnetic substance is best represented by
A B
B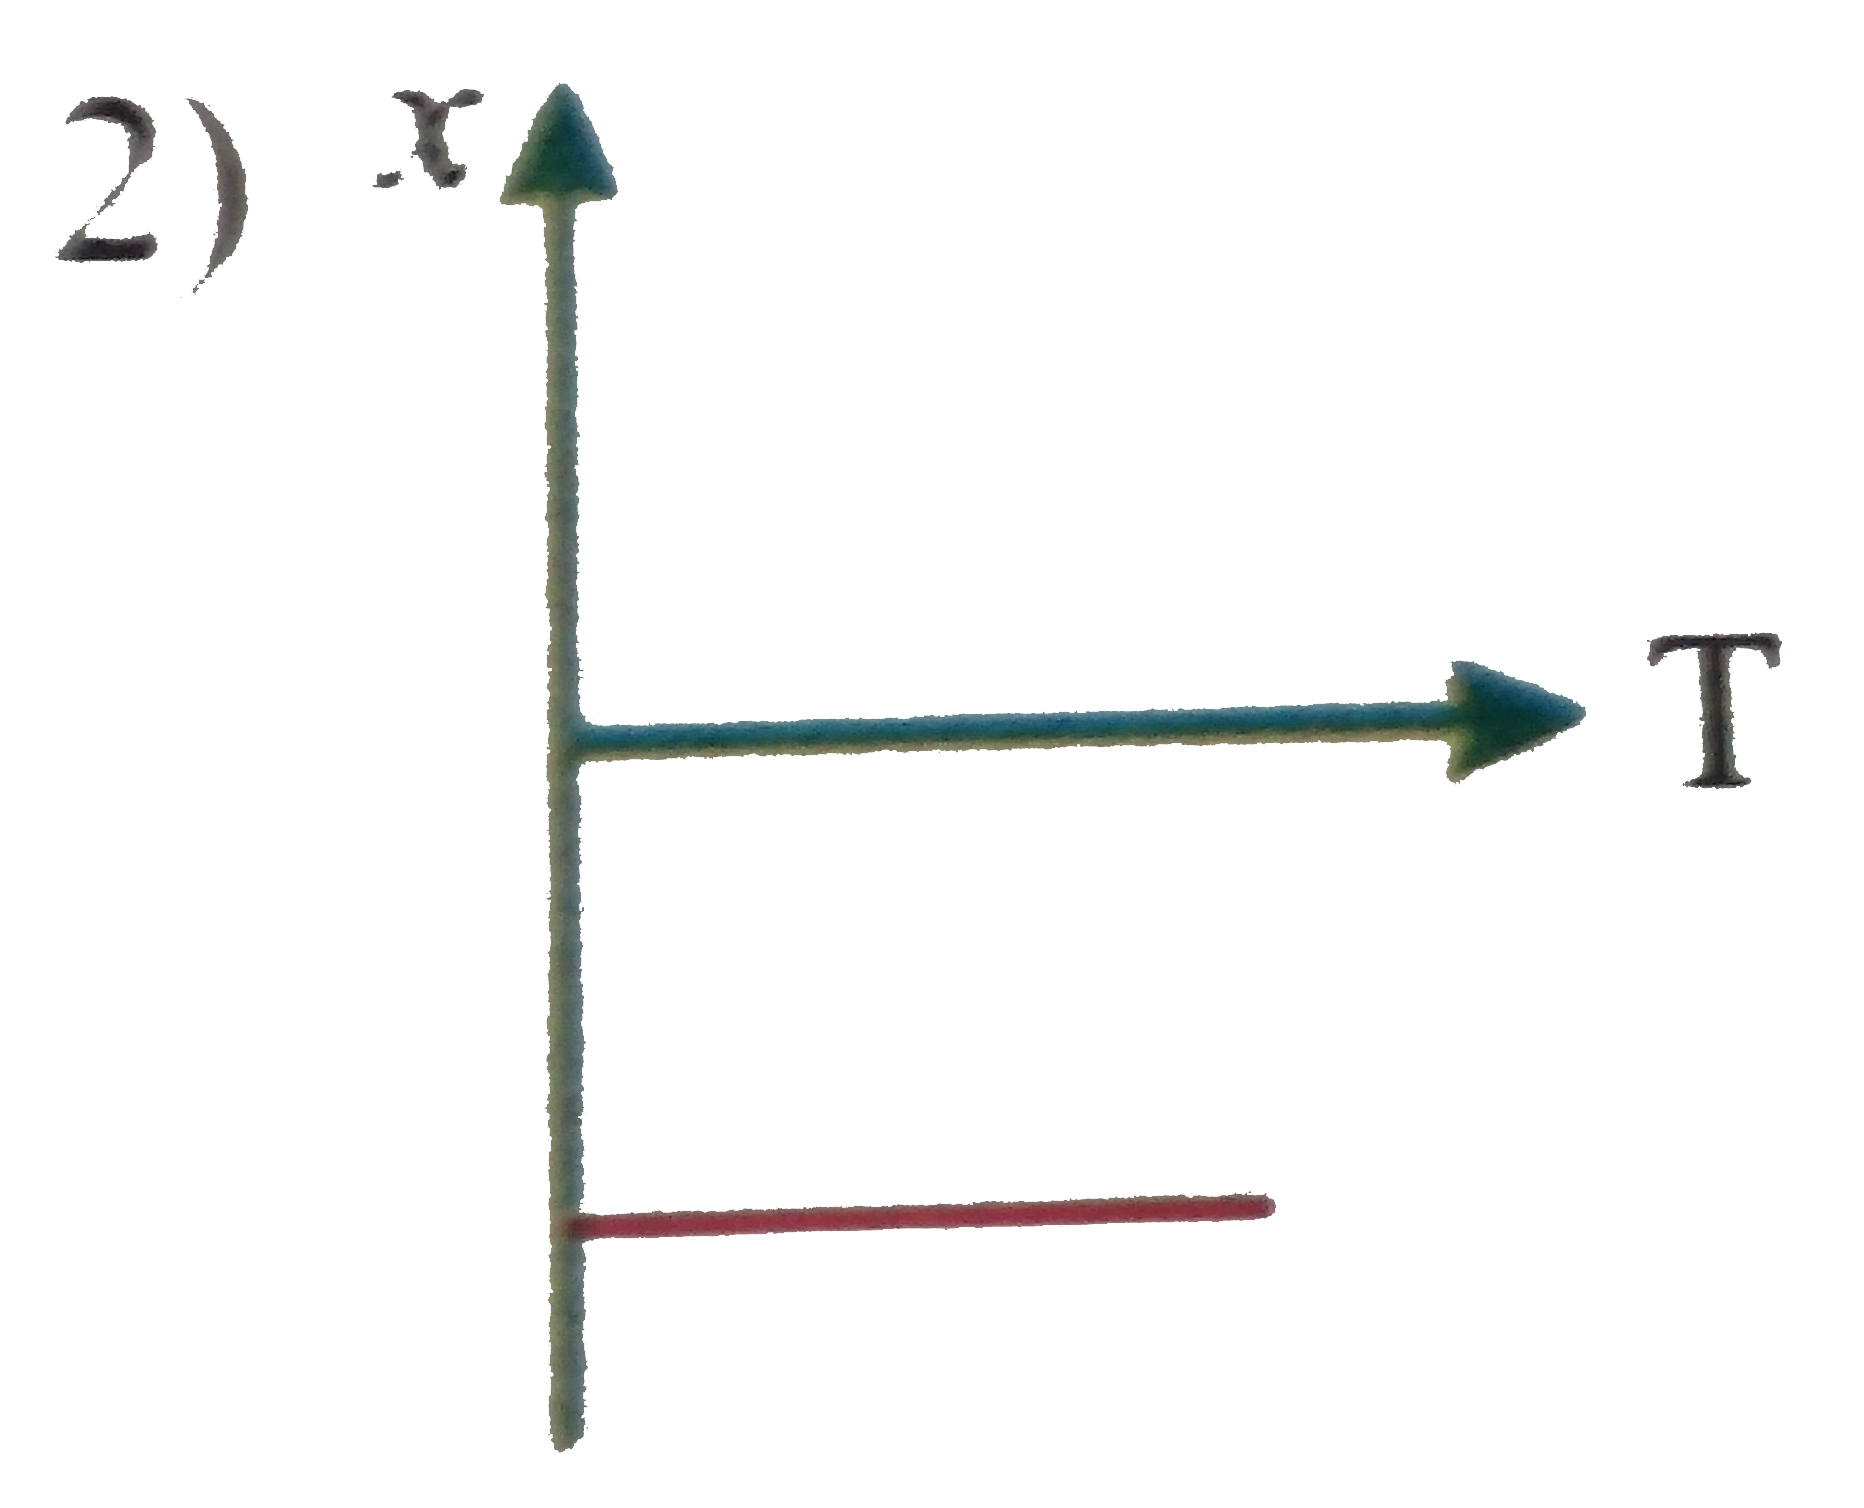 C
C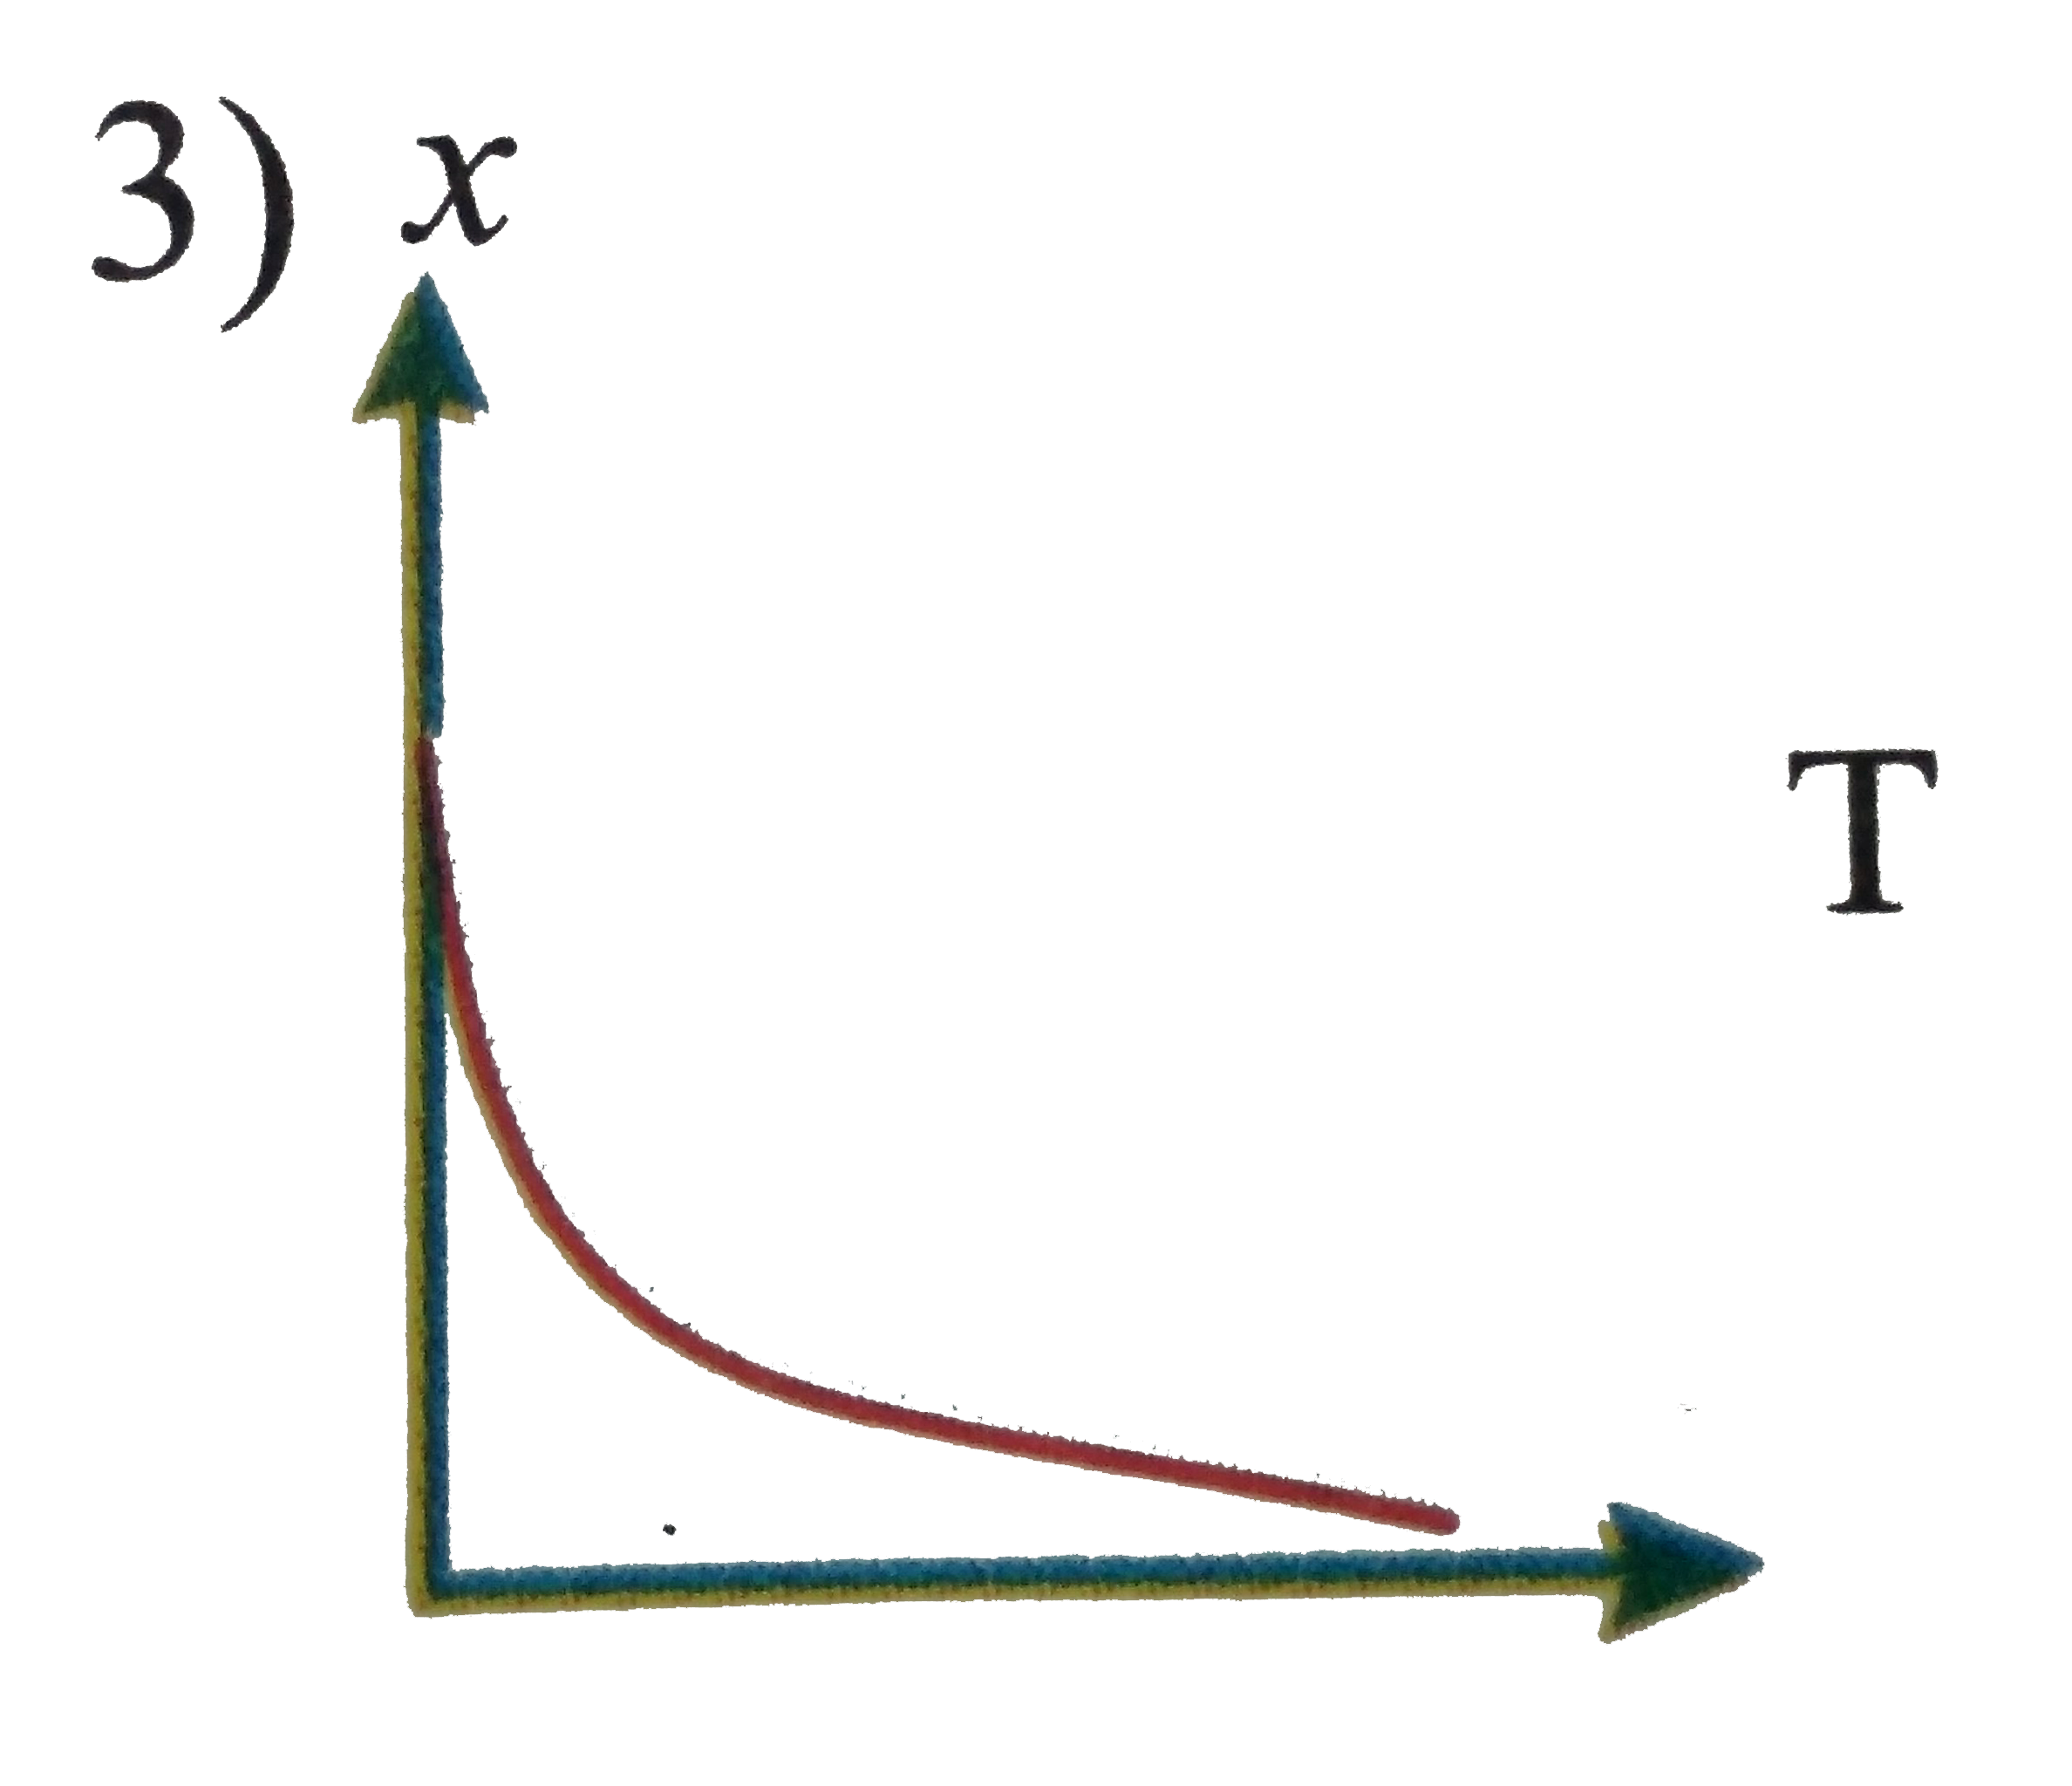 D
D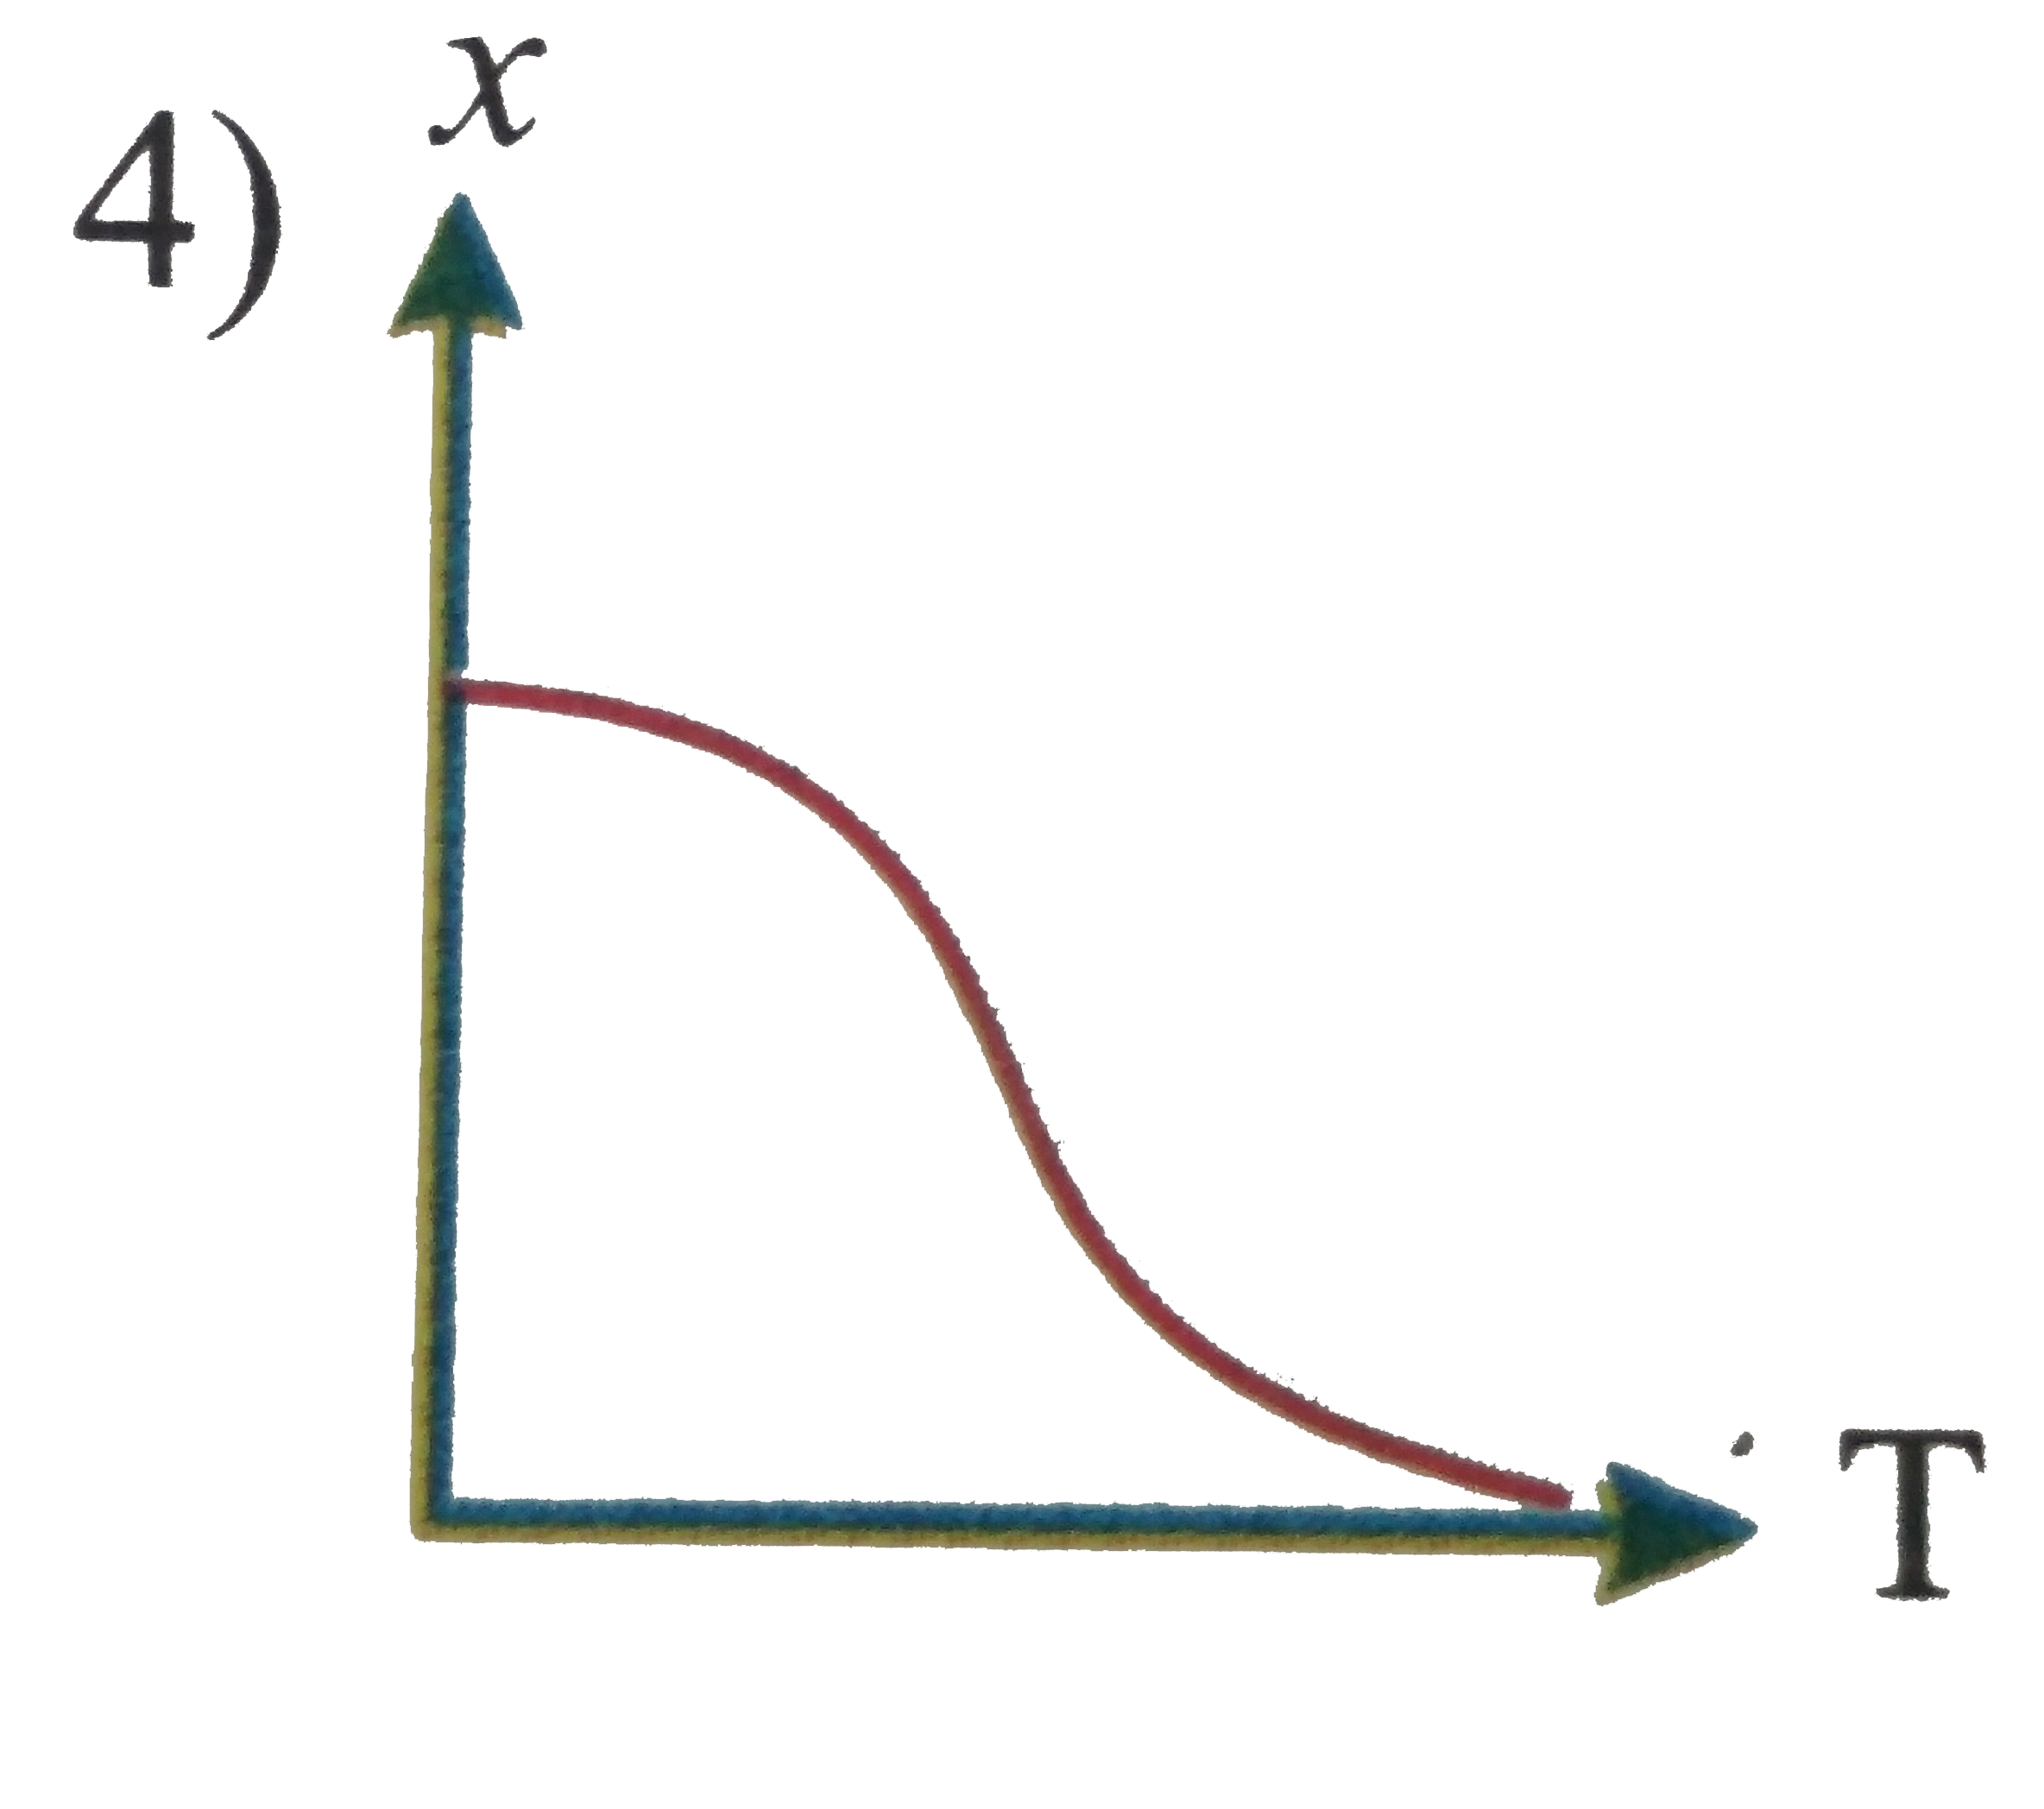
The variation of magnetic susceptibility (χ) with temperature for dimagnetic substance is represented by
View SolutionThe variation of magnetic susceptibility (χ) with temperature for a diamagnetic substance is best represented by
View SolutionThe variation of magnetic susceptibility (χ) with temperature for dimagnetic substance is represented by
View SolutionThe variation of magnetic susceptibility (x) with temperature (T) for a diamagnetic material is best represented by
View SolutionWhich gives the variation of magnetic suscetibility (x) with magnetising field for a paramagnetic substance ?
View Solution
